Mapping Flood Disadvantage in Scotland 2015: Methodology Report
This report describes the methods applied in developing the flood disadvantage dataset for the project Mapping Flood Disadvantage in Scotland 2015.
Appendix 2: Selection of the indicators reflecting low income
The aim of this exercise was to select indicators representing different aspects of low income (associated with either being out of work or employed in low-income jobs, and also taking into account household composition). The indicators representing low-income communities were based on the 2013 flood disadvantage assessment (Lindley and O'Neill, 2013) and additional indicators were drawn from the literature and verified through consultations with stakeholders from local authorities and the Scottish Government.
The Scottish Index of Multiple Deprivation - Income, which was used originally in the assessment of social vulnerability to flooding (Lindley et al., 2011) and flood disadvantage assessment (Lindley and O'Neill, 2013) was disaggregated to provide more meaningful information rather than an abstract index. The initial list of indicators considered was as follows:
- i5 - percentage of people unemployed (from 2013 disadvantage assessment)
- i6 - percentage of all pensioner households (from 2013 disadvantage assessment)
- i7 - percentage of people in routine or semi-routine jobs, indicating low-income occupations (from 2013 disadvantage assessment)
- i8 - percentage of people in long-term unemployment or who have never worked (from 2013 disadvantage assessment)
- i9- percentage of households with no adults in employment and with children (from 2013 disadvantage assessment)
- i10 - Percentage of people income deprived (Scottish Index of Multiple Deprivation 2012 - Income; from 2013 disadvantage assessment)
- i10a - Number of people claiming Income Support (used to calculate SIMD 2012 Income)
- i10b - number of people claiming Job Seeker's Allowance (used to calculate SIMD 2012 Income)
- i10c - number of people claiming pension credits (used to calculate SIMD 2012 Income)
- i10d - number of families in work claiming Work Tax Credits or Child Tax Credits (used to calculate SIMD 2012 Income)
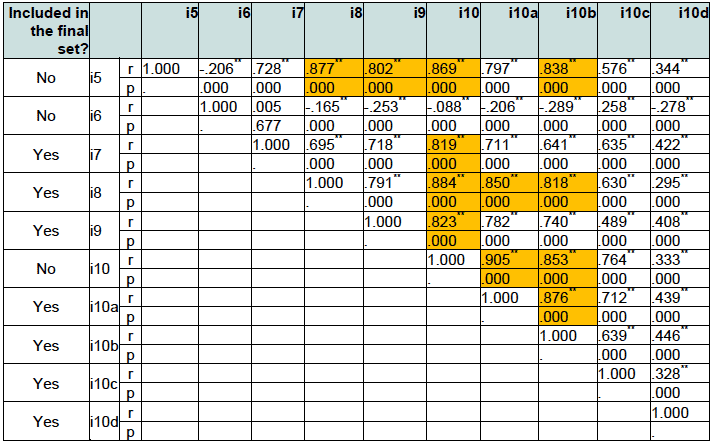
Spearman's rank correlation was calculated among these indicators for all data zones (6500) and the results are reported in Table A.1. The correlation results would suggest removing some indicators when:
- There is a very strong correlation between a pair of indicators, thus it can be assumed that they reflect the same phenomenon and that therefore one of them is redundant.
- There is a negative correlation between the indicator and the remaining ones, and thus it can be assumed that it does not reflect the phenomenon at all.
Based on the above, the correlations suggest removing indicator i10 (SIMD 2012 income index) because it is highly correlated with most of the indicators (this is not surprising for the indicators used to build the SIMD index, e.g. i10a and i10b).
It was decided to remove the more generic % of people unemployed (i5) indicator and retain the number of Job Seeker's Allowance claimants (i10b) and percentage of people long-term unemployed or who have never worked (to cover two different aspects of unemployment: short- and long term).
The indicator of percentage of all pensioner households (i6) is negatively correlated with all other indicators, which would suggest removing it too, since it does not reflect low income. This was also supported by existing literature that all pensioner households are not more income-deprived than other households[13]. The number of people in receipt of pension credits (i10c) seems to be a more valid indicator due to its strong, but not very strong correlation with other indicators.
Table A.1 Spearman's rank correlation among the income indicators (r - correlation coefficient; p - statistical significance). The number of data zones is 6500; very strong correlations (r >0.8) are highlighted.

The final set of indicators representing the income domain includes: i7, i8, i9, i10a, i10b, i10c, i10d (see the spreadsheet). There is still correlation between these, which can be expected due to concentrations of income deprivation associated with low income occupations or unemployment in certain areas, but only a couple of very strong correlations remain (i10b with i10a and i8), thus the overlap in data is minimal.
Contact
Email: Carol Brown
There is a problem
Thanks for your feedback