Marine mammals: methodology for combining data
This report introduces a method for integrating digital aerial survey data and passive acoustic baseline data to record the abundance and distribution of marine mammals. The report applies the method in a test case study and provides recommendations on data collection.
Appendix 1 - Survey design and simulation using dsims
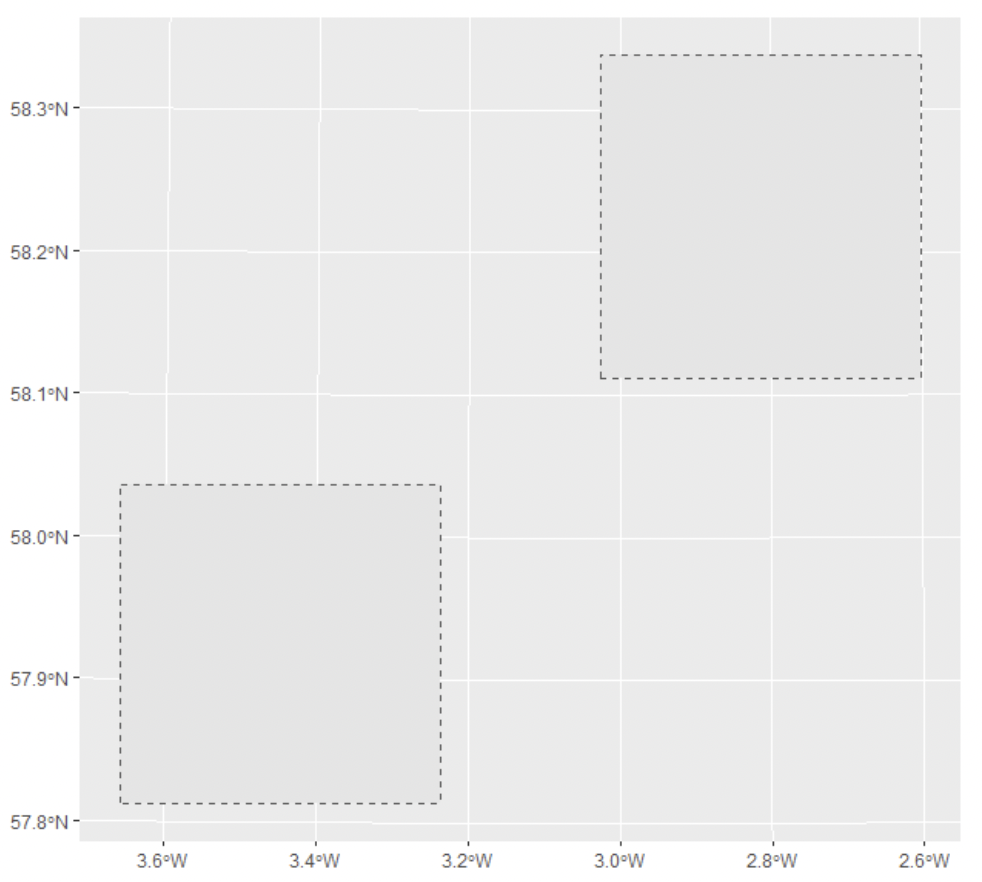
This exercise used dsims to design (1) a line transect survey and (2) a point transect survey for one of the 25 km x 25km monitoring areas from the case study (Fig. A1). In each case, the design was created using guidance from Buckland et al. (2001) regarding the number of recommended lines and points i.e., between 10 and 20. The coverage of the designs was then assessed using the simulation capabilities in dsims.

Methods
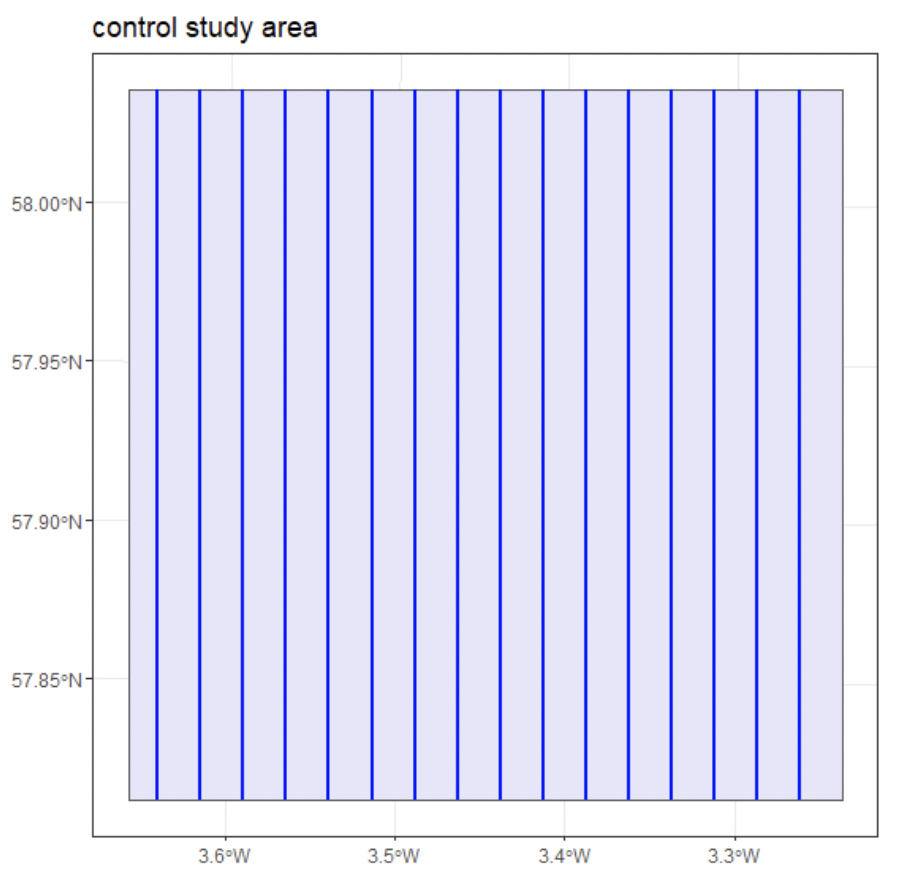
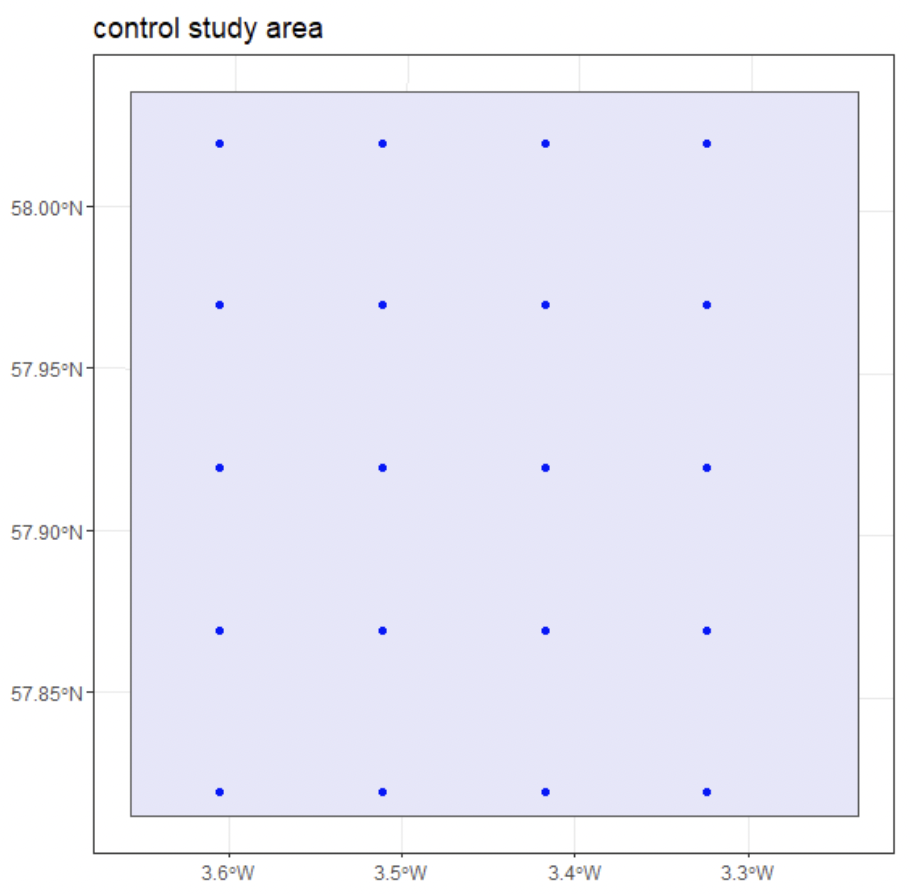
The line transect design assumed a spacing of 1,500 m and generated systematically-placed parallel lines with a random start point, which resulted in a design with 16 transect lines across the area. Line strip width was assumed to be 100 m. Coverage was assessed by generating 100 examples of the survey design and then using 1,000 grid points overlaid onto the survey area to quantify the number of times each point was covered by a survey (generating a coverage score per grid point). The point transect analysis assumed 20 monitoring points arranged in a systematic grid with a random start point. A monitoring radius of 100 m was also assumed. Coverage was assessed in the same way as the line transect survey.


Results
The resulting designs are shown in Figs A2 and A3. The coverage assessment resulted in a mean coverage of 13.3% for the line transect design, with individual coverage scores ranging between 0.09 and 0.2. Coverage was much lower for the point transect design with only 0.1% of the survey area being monitored. Corresponding coverage scores were also very low; the majority of points did not have any coverage across the 100 replicates of the design and the remaining coverage scores ranged between 0.01 and 0.02.
Conclusions
The results of the simulated analyses demonstrated the differences between the coverage of the line transect survey compared to the point transect survey. This is not surprising as CPODs (on which this simulation was based) typically have small detection ranges (and associated detection probability). This is an important consideration for survey design because the encounter rate variance can be affected by small sample sizes, which may result from very low coverage. dsims provides the opportunity to (1) design both line and point transect surveys and (2) assess their coverage. Further, dsims can be used to (3) simulate distance sampling analyses to assess many other aspects of the survey design (not demonstrated here) including encounter rate variance and bias in resulting abundance/density estimates. Therefore, dsims is a useful survey design tool, with several potential future extensions (see Section 2) being particularly relevant for integrated data analyses including (but not limited to) PAM and DAS data.
Contact
Email: ScotMER@gov.scot
There is a problem
Thanks for your feedback