Marine mammals: methodology for combining data
This report introduces a method for integrating digital aerial survey data and passive acoustic baseline data to record the abundance and distribution of marine mammals. The report applies the method in a test case study and provides recommendations on data collection.
Section 2: Available Software Tools to Assist Data Integration
A goal of the project was to provide software to aid data integration, so existing tools were evaluated that the project team had ready access to i.e., developed by several of the CREEM project team members, to see how these tools could either (1) be directly used in or (2) adapted for the selected modelling framework. Therefore, we do not suggest that these are the only tools available to practitioners, though many of the tools described below were developed to address specific research gaps and/or are now widely used by a variety of stakeholders (details given below for each described tool). We also note that this software review was not focussed on abundance and density estimation software such as the R packages Distance (Miller et al., 2019), dsm (Miller et al., 2022) and ascr (Stevenson et al., 2015) but specifically on the survey design and power analysis tools available. There are relevant features in these packages, however, particularly the spatial modelling capabilities in the dsm package.
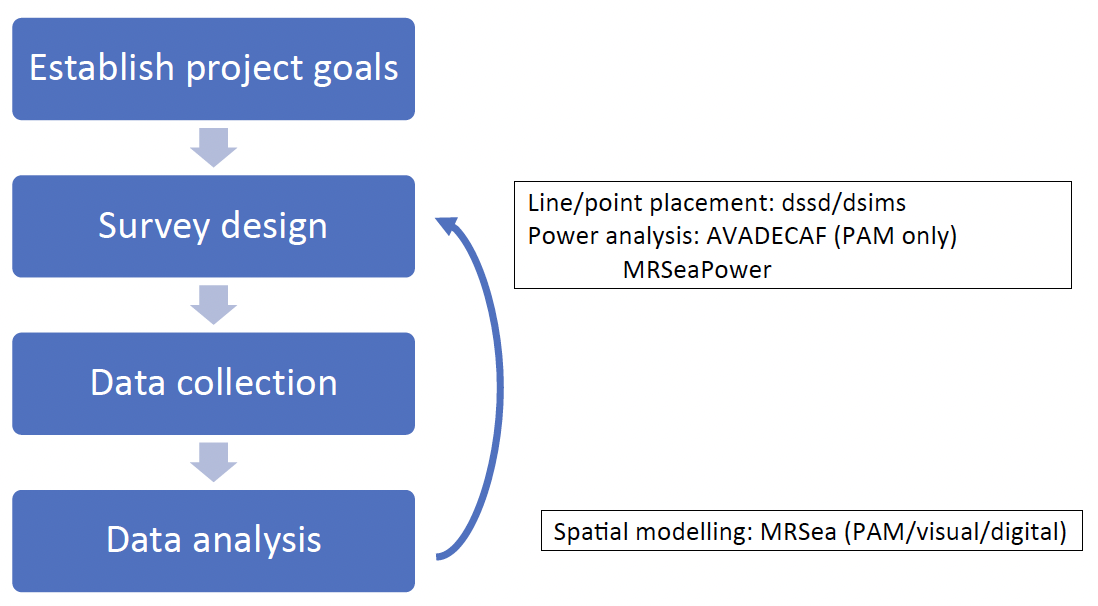
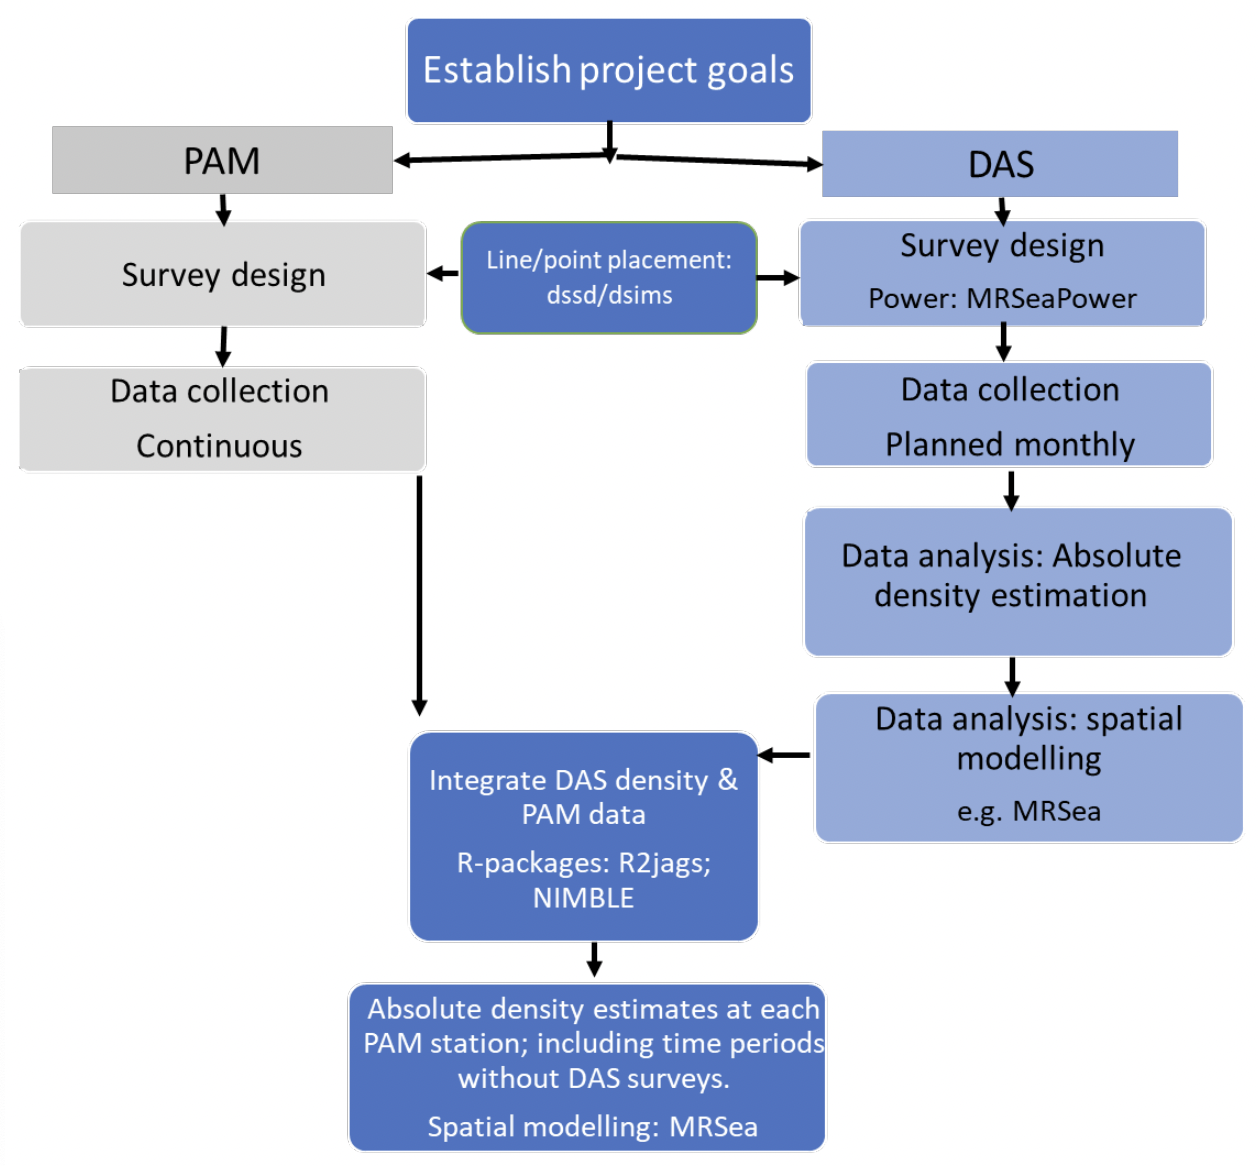
First a generic survey design, monitoring, and analysis workflow is outlined (Fig. 1), before a description of the evaluated survey design and power analysis software tools and how these tools would fit in the described workflow is provided. An overview of possible extensions that could be developed in the future is also included, highlighting the extensions that would particularly benefit the integration of PAM and DAS data (summarised in Table 1). A specific workflow for the category 2 data integration method chosen for the case study is then described, demonstrating where the software tools fit within the workflow (Fig 2).
Section 2a: Survey Design and Analysis Workflow
A typical survey design workflow might be as follows (summarised in Fig. 1):
1. Establish project goals and research questions (e.g., baseline monitoring of target species by obtaining absolute abundance, where end products are density surfaces of target species with associated uncertainty).
2. Design a survey to meet these goals considering:
a. Survey platform(s) and survey methods to be used.
b. Spacing of transect lines/point transects to achieve desired survey coverage/effort.
c. For PAM surveys, number, configuration, and capabilities of deployed instrumentation; can detection probability be estimated from each monitoring station?
d. Does the survey design have enough statistical power to detect change in abundance at the required spatial and temporal scales?
e. Where spatial modelling is required, are relevant environmental covariates also available or being collected e.g., sea surface temperature, primary productivity data.
NB: in the survey design phase, any existing relevant data e.g., pilot survey data or data from a similar study will provide valuable information and help to optimise the survey design.
3. Data collection
4. Data analysis and survey design feedback
a. After initial data collection, perform preliminary analyses of collected data to ensure that the assumptions of the survey design are realistic. Analysis steps will include:
i. Process survey data (visual/digital and/or acoustic).
ii. Estimate absolute densities from the data where possible.
iii. Perform spatial modelling to produce density surfaces (with associated uncertainties).
b. Adjust the survey design if needed (re-considering points 2a – e as needed).
c. On completion of data collection analyse whole dataset, following steps 4ai – iii.

Section 2b: Evaluated Software Tools
1. dssd and dsims
The R package “dssd”is a distance sampling survey design package used to define designs and generate transects (Marshall, 2022a) and “dsims” is a simulation R package which extends “dssd” to additionally simulate populations of interest and subsequent surveys to allow better assessment of design properties (Marshall, 2022b). These can be used to design optimal line and point transect surveys and so are relevant to the design of both DAS and PAM surveys. The simulation package currently focusses on design-based estimation (Buckland et al., 2015).
Possible future extensions to dsims are given below, with the extensions most useful to PAM/DAS data integration highlighted by “(PAM-aerial)” notation, though all extensions are relevant:
- Include space-filling designs, which use an algorithm to achieve even placement of a given number of instruments within a study area, though uniform coverage may be lost (PAM-aerial, specifically for PAM data).
- Facilitate cue-based analyses (PAM-aerial, specifically for PAM data).
- Include designs with combined lines and points (PAM-aerial).
- Implement downsampling to assess effect of fewer lines/points on coverage. (PAM-aerial).
- Combine dssd/dsims and MRSea (see below). (PAM-aerial).
- Incorporate model-based density estimation options.
- Generate the population only in the covered areas, not the whole study area. This should speed simulations up and allow larger population sizes to be simulated.
2. AVADECAF
AVADECAF (Booth et al., 2017) is a set of R functions that perform a power analysis to address the question whether a given acoustic survey design will allow a change in animal density to be identified for a species of interest. Several input parameters are required to set up the power analysis such as the expected densities (e.g., via a density surface), detection probability estimates and parameters related to acoustic behaviour of the target species. Survey data are simulated and analysed, then a Generalised Linear Model (GLM) is fitted to the resulting density estimates to see whether estimates are changing over time (by fitting year or season as a covariate in the GLM).
Possible future extensions to AVADECAF are:
- Enable an existing survey design to be uploaded, rather than generating one in the software (PAM-aerial).
- Include variable spatial density surfaces to incorporate the uncertainty in the density surface estimates. Currently, only one density surface is generated per power analysis.
3. MRSea and MRSea Power
MRSea and MRSeaPower are R packages that allow the fitting of spatially adaptive models and spatially-explicit power analysis (Mackenzie et al., 2013, Scott-Hayward et al., 2021).
The MRSea package fits Generalised Additive Models (GAMs) to survey data and includes functionality to account for spatial and temporal correlation in observed data, and can be used to compare different surfaces (e.g., between years or construction phases). MRSea is very flexible and can be used to model different data types e.g., PAM, visual, digital, telemetry data. In particular, it is the recommended approach by NatureScot for analysing aerial survey data for baseline site characterisation for marine ornithology (e.g., one survey a month over two years) (NatureScot, 2023).
MRSeaPower is an extension of MRSea that enables a simulation-based approach to power analysis with spatially explicit outcomes (power to detect change can be visualised across a study area).
Possible future extensions to MRSea/MRSeaPower relevant to this work include:
- Link with the dssd/dsims packages by (1) providing MRSea density surfaces to be used in dsims and/or (2) using dssd survey designs in MRSeaPower. (1) allows a real density surface to be used to determine the best survey design (PAM or DAS) and (2) allows spatially explicit power to be estimated for a variety of survey designs. In principle this can be done with the existing packages but has not been tried or tested. Further work would allow seamless integration and user documentation. (PAM-aerial).
- Include ways to propagate uncertainty from machine learning species classification from DAS/PAM data.
Section 2c: Conclusions of Available Software Review and Implications for Case Study
The review identified that existing spatial modelling software (MRSea) could be used for the spatial modelling components of the case study analysis, and that other R-based tools can be used for survey design (dssd/dsims) and to assess power to detect changes in density/abundance (MRSeaPower/AVADECAF). How these software tools fit into the workflow for the category 2 method is given in Fig. 2. However, it was concluded that there was no available software that could readily combine PAM and DAS data, nor future extensions that could be implemented within the timeframe of the project. The review outlined where existing tools could be extended in the future to facilitate (1) survey design of monitoring programs in general and (2) specifically combining data from PAM and aerial platforms (summarised in Table 1). Finally, discussions about software concluded that clear documentation and long-term support are key features of any software used for analysis so should be considered a priority in any future software development.
| Capabilities | dssd/dsims | MRSea | MRSea Power | AVADECAF |
|---|---|---|---|---|
| Create survey design | Yes | No | No | Yes |
| Upload existing design for use in analysis | Yes | n/a | Yes | No |
| Spatial modelling capabilities | No | Yes | No | No |
| Power analysis (PA) capabilities | No | No | Yes | Yes |
| Spatially referenced power outputs | n/a | n/a | Yes | No |
| Declines can be assessed in PA | n/a | n/a | Yes | Yes |
| Spatial redistributions can be assessed in PA | n/a | n/a | Yes | Yes |
| Changes in survey design can be assessed in PA | n/a | n/a | Yes | Yes |
| Can work with non-density data (i.e. detection-only) for PA | n/a | n/a | Yes | No |
| Future potential extensions to aid data integration | Yes | Yes | Yes | Yes |
| Main future extension(s) to aid data integration | Space-filling designs Cue-based analyses Combined lines/point designs Enable downsampling Link with MRSea/MRSeaPower | Link with dssd/dsims | Link with dssd/dsims | Enable existing survey design upload |

Contact
Email: ScotMER@gov.scot
There is a problem
Thanks for your feedback