Minimum Income Guarantee: Experts by Experience Panel report
The full report from the Minimum Income Guarantee Experts by Experience Panel who have deliberated on the complexities of designing a Minimum Income Guarantee and provided rich insights which will continue to inform the Expert Group’s decision making.
Member survey of experiences and additional information
This section summarises the data from the Involve survey taken during February 2023 where a total of 26 members completed the survey. The survey was voluntary and members could choose 'Prefer not to say' for any of the questions. In addition to the information provided below, survey responses also revealed that the panel includes experiences of being in care.
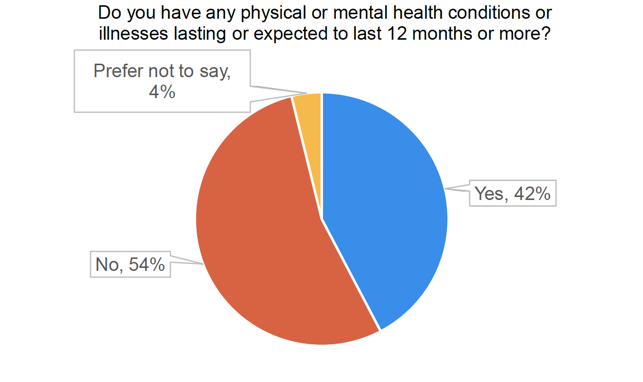
The results of this question indicate that a significant proportion of the panel members responding to the survey (11 out of 26, or 42.3%) reported having physical or mental health conditions or illnesses expected to last for 12 months or more.
One person chose not to answer the question and 14 out of 26 or (53.8%) reported not having any physical or mental health conditions or illnesses expected to last for 12 months or more.
We then asked the 11 members who reported having a health condition or illness about the extent to which reduces their ability to carry out day to day activities. 10 members responded to this question, all who reported having health conditions or illnesses expected to last for 12 months or more stated that their conditions reduce their ability to carry out day-to-day activities, with 4 out of 11 individuals (36.4%) reporting that their conditions reduce their ability to carry out day-to-day activities "a lot", and 6 out of 11 (54.5%) individuals reported that their conditions reduce their ability to carry out day to day activities "a little".
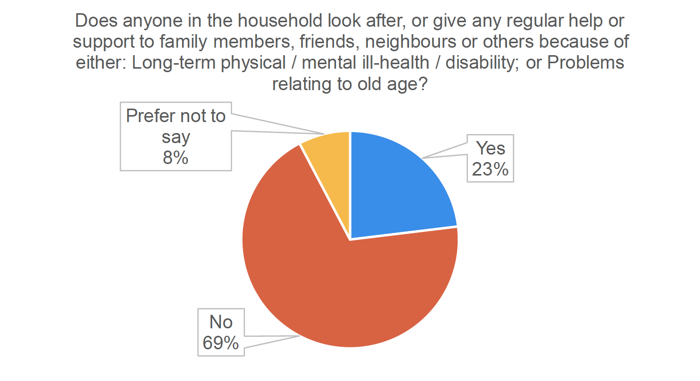
The results of this question indicate that a minority of panel members responding to the survey (6 out of 26, or 23.1%) have someone in their household who provides regular help or support due to long-term physical/mental ill-health/disability or problems relating to old age.
Two panel members chose not to answer the question, which could indicate that they may feel uncomfortable sharing information about their caregiving responsibilities.
On the other hand, the majority of panel members (18 out of 26, or 69.2%) reported not having anyone in their household who provides regular help or support due to the above reasons.
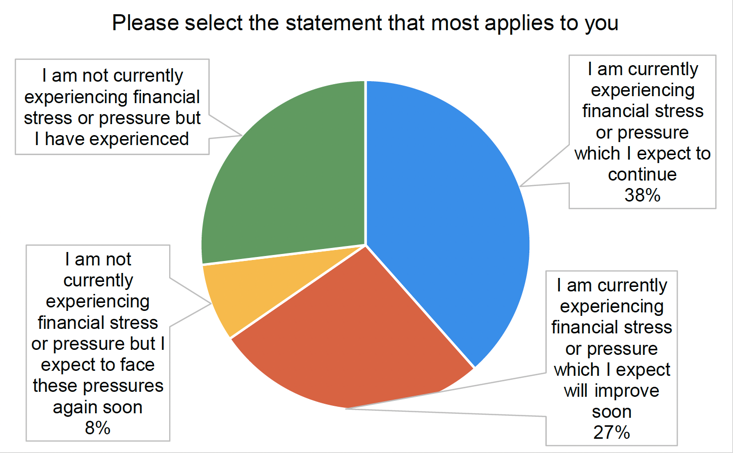
The results of this question provide insight into the current financial situation of panel members and how it has changed over time.
A significant number of panel members (10 out of 26, or 38.5%) reported currently experiencing financial stress or pressure which they expect to continue.
On the other hand, 7 out of 26 (26.9%) reported currently experiencing financial stress or pressure but expect it to improve soon.
Two panel members (7.7%) reported not currently experiencing financial stress or pressure but expect to face these pressures again soon.
Finally, 7 out of 26 (26.9%) reported not currently experiencing financial stress or pressure but have experienced this in the past.
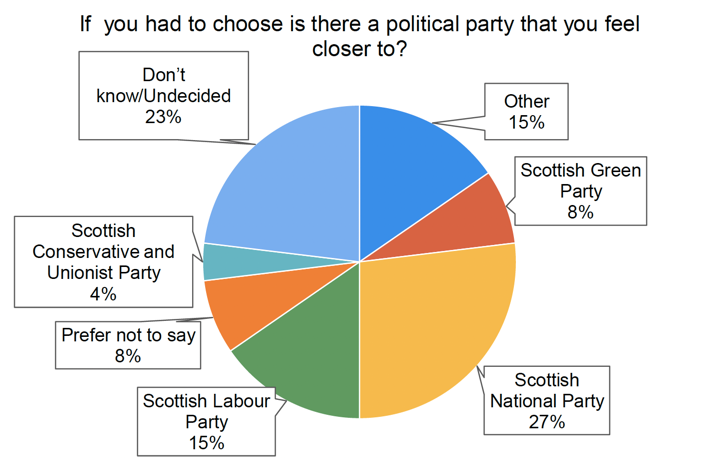
The question about political party affiliation provides insights into the diversity of opinions and backgrounds among the panel members, and helps us to ensure we are engaging across the political spectrum in Scotland on this issue.
According to the responses, the Scottish National Party (SNP) was the most commonly selected option, with seven panel members (26.9%) indicating that they feel closer to this party than others. 23.1% of members do not know or are undecided. The Scottish Labour Party was the second most commonly selected party, with four panel members (15.4%) indicating that they feel closer to this party than others. The Scottish Green Party and Scottish Liberal Democrats each received two responses (7.7%) from panel members who feel closer to these parties.
In addition, four panel members (15.4%) selected "other" and specified their affiliation with different parties or political movements. This included the Scottish Socialist Party. Six panel members (23.1%) selected "don't know/undecided," indicating that they are either not sure which party they feel closer to, or are not politically active. Finally, two panel members (7.7%) chose to not disclose their answer.
Contact
Email: MIGsecretariat@gov.scot
There is a problem
Thanks for your feedback