Minimum Unit Pricing (MUP) Continuation and future pricing: Business and Regulatory Impact Assessment
Scottish Government developed a Business and Regulatory Impact Assessment to analyse the costs and benefits of the continuation and uprating of Minimum Unit Price (MUP) on businesses.
6. REGULATORY AND EU ALIGNMENT IMPACTS
This section of the BRIA has been updated to include additional presentation of the assessment of the analysis undertaken in understanding potential regulatory impacts, in particular in relation to the UK Internal Market Act 2020.
The UK Internal Market Act 2020
The United Kingdom Internal Market Act 2020 (IMA) introduced two market access principles for goods – the principles of mutual recognition and non-discrimination. The current MUP requirements are not subject to the principles, as the requirements were in place on 30 December 2020.
However, an increase in the minimum unit price to 65ppu will be a substantive change to the existing requirements and bring them within the scope of the IMA. As such, consideration has been given to the application of the market access principles to minimum unit pricing at 65ppu. For the reasons set out below, the Scottish Ministers do not expect the IMA to affect the operation of the minimum unit pricing provisions.
The MUP legislation is excluded from the scope of the mutual recognition principle, as the minimum unit pricing requirements are manner of sale requirements within the meaning of the IMA.
It does, however, fall within the scope of the principle of non-discrimination for goods. This principal means that a statutory requirement will have no effect if, and to the extent that, it either directly or indirectly discriminates against goods with a relevant connection with another part of the UK (“incoming goods”).
MUP requirements do not directly discriminate, but the Scottish Ministers have considered whether the proposals could indirectly discriminate against incoming goods. This would be the case if an “adverse market effect” arises and if minimum unit pricing cannot be considered a necessary means of achieving a legitimate aim.
Under the IMA, an “adverse market effect” arises if incoming goods are put at a disadvantage by MUP but comparable goods with a relevant connection to Scotland (and no other part of the UK) are not put at that disadvantage (at all or to the same extent) and as a result, it causes a significant adverse effect on competition in the market for those goods in the UK.
Our analysis of the impacts on intra-UK trade (set out in detail below) does not suggest there is any advantage to Scottish goods over goods from the rest of the UK at the overall level or product level. Our analysis of the top 50 products and top 20 selling products in each category suggests that the average price of products produced in Scotland and by a company based in Scotland is lower than products known to have a relevant connection to the rest of the UK.
However, it is recognised that distributional impacts will occur and it cannot be discounted that some incoming goods could be disadvantaged more than comparable Scottish products with no relevant connection to the rest of the UK. To the extent that occurs, any negative impact can be expected to be most marked in relation to the cheapest products and least marked in relation to more expensive products (ie those priced closest to 65ppu). It is also recognised that some categories of goods, such as cider and vodka, are likely to be impacted to a greater extent and that may be more likely to be incoming goods by virtue of their ingredients, production location or the registered business address. By contrast, it is recognised that whisky is less likely to be impacted by the increase in minimum unit price and that whisky may be more likely to have no relevant connection to another part of the UK other than Scotland than other products. However, we are not aware of any specific examples of where this would give rise to any adverse market effect.
The likelihood of any such disadvantage to incoming goods causing a significant adverse effect on competition in the market for goods in the UK is, however, reduced by two factors. Firstly, MUP in Scotland has a relatively small impact on the UK market for goods due to the scale of Scotland in the context of that market (albeit this impact varies depending on the category of good under consideration). Secondly, given the range of factors which can establish a relevant connection to another part of the UK, the number of Scottish alcoholic goods that have no relevant connection to another part of the UK is expected to be very low, and it is expected that such goods would likely have a relatively low level of production, distribution and market share.
It is noted it is very difficult to determine whether alcoholic products are incoming goods or fall into the category of being goods with a relevant connection to Scotland and no other part of the UK. A good has a relevant connection with another part of the UK if it (or any of its components or ingredients) is produced in, produced by a business based in, comes through or passes through that part of the UK before reaching the part of the UK in which it is sold. For example, a beer brewed in Scotland, constitutes an incoming good if one ingredient (for example, hops) were to have been grown in England or were imported from outside the UK and transported through England to reach the brewer in Scotland. As noted below, there is limited publicly available information or data on the movement of alcoholic products between different parts of the UK and about the origin or movement of the components or ingredients of alcoholic products. Our analysis of the top 50 products and top 20 selling products in each product category suggests that the number of products with no relevant connection to the rest of the UK is likely to be very small.
In line with the above, it seems unlikely that an adverse market effect will arise but it cannot be discounted on the information available.
However, even if an adverse market effect were to arise, the IMA provides that there is no indirect discrimination if the restrictions can reasonably be considered a necessary means of achieving a legitimate aim.
The Scottish Ministers consider that the minimum unit pricing requirements are a necessary means of achieving the legitimate aim of protecting the life and health of humans. Taking into account the effects of the requirements, including potential effects on the UK market outlined in this BRIA, it is considered that the requirements are justified in light of the health benefits which the Scottish Ministers are seeking to achieve. The aims of the policy are significant and important in terms of improving health outcomes and reducing deaths. Alternative means of achieving this aim have been considered, such as excise duty or continuation of minimum unit pricing at the existing price of 50ppu. For the reasons set out in the Options section, these are not considered capable of achieving the desired outcomes.
In conclusion, the Scottish Ministers do not consider the proposals would indirectly discriminate against incoming goods and the IMA is not expected to affect how the minimum unit pricing provisions operate.
Intra-UK Trade
The MUP proposals have the potential to impact on intra-UK trade, as they seeks to impact the demand from Scottish consumers for alcoholic drinks products. This would primarily be expected to result in a change in sales in Scotland, but a price divergence between parts of the UK also has the potential to result in a change in cross-border sales.
A survey by the Office for the Internal Market[111] found that most of the respondents that trade with other UK nations said that doing so was either fairly or very easy, and difficulties were primarily general difficulties rather than regulatory differences.
However, a notable number of firms identified some existing differences in regulations likely to affect their sales (42 out of 337 who trade across UK nations), and regulations relating to food and drink, including alcohol policies such as MUP, was one of the four most frequently cited areas, cited by medium and large producers and accommodation providers.
The UK alcoholic beverage production industry is highly integrated, with a number of businesses with operations across different countries in the UK. Production in the UK, particularly of beer, is dominated by a small number of global multinational companies, following a trend of consolidation over the previous decades[112].
This section of the BRIA sets out information relevant to potential impacts on intra-UK trade.
Production location of top selling brands in Scotland
The ability to identify any potential significant impacts on intra-UK trade as a result of the proposals is limited by the lack of available data on the location of production within, or import into or within, the UK, of products sold in the Scottish on and off-trade.
To understand more about the potential for differential impacts of MUP on products originating from other parts of the UK, or internationally, the Scottish Government has sought to identify the production location of the top selling alcoholic beverage products in the Scottish off-trade using publicly available information such as product and supermarket websites, industry journals and news articles. Brands which have production locations in Scotland as well as the rest of the UK are classified as being produced in Scotland, to reflect the likelihood that this will be used to meet domestic demand.
The top 50 selling brands in the supermarket and convenience sectors[113], along with their average price, sales volume and value in 2022, have been identified through analysis of market data purchased by the Scottish Government[114]. These products made up 59.2% of off-sales in Scotland by volume in 2022.
Of the top selling 50 brands, we estimate that 15 were produced in Scotland, 15 produced in the rest of the UK, and 20 internationally. The products produced in Scotland make up a larger share of the total volume and value of sales compared to those from the rest of the UK and internationally (Table 56).
| Products | Volume (units) | % of Volume | Value (£) | % of Value | |
|---|---|---|---|---|---|
| Scotland | 15 | 690,881,230 | 48% | 387,608,832 | 44% |
| rUK (rest of the UK) | 15 | 427,724,859 | 29% | 264,059,804 | 30% |
| International | 20 | 331,316,081 | 23% | 223,330,988 | 26% |
| Total | 50 | 1,449,922,170 | 100% | 874,999,624 | 100% |
Source: Scottish Government analysis of Circana Ltd data.
Average price and distribution of top selling brands in Scotland
The potential impact of a change in the level of MUP on intra-UK trade is dependent on the extent to which goods entering the Scottish market would have to adjust their price to meet the new requirements and the resulting impact on demand – both absolutely and relative to Scottish goods.
The average unit price of the top selling brands in Scotland by production location is shown in Table 57.
| Production location | Average Unit Price 2022 (by volume) |
|---|---|
| Scotland | 0.56 |
| rUK | 0.62 |
| International | 0.67 |
| Total | 0.60 |
Of the top 50 selling brands, Scottish produced brands are sold at the lowest price per unit on average (Table 58) where average unit price is calculated weighted by the volume of sales of each product.
While limited to the top selling products, the lower average unit price for products produced in Scotland compared to the rest of the UK in this analysis suggests that - on average - changes to the MUP level would have less impact on trade of products produced in the rest of the UK over those produced in Scotland.
The average price masks the variation in the prices of specific products originating from different locations. This price distribution of the top selling products helps identify the share of products (in both absolute number and by volume of sales) which could potentially be impacted by a different level of minimum unit price. The share of products priced below a section of unit prices is presented in Table 58 across different production locations.
| Scotland | rUK | International | ||
|---|---|---|---|---|
| Share sold below £0.55 per unit | By number of products | 40% | 27% | 10% |
| By volume of sales | 28% | 15% | 11% | |
| Share sold below £0.60 per unit | By number of products | 87% | 47% | 25% |
| By volume of sales | 95% | 53% | 23% | |
| Share sold below £0.65 per unit | By number of products | 93% | 67% | 40% |
| By volume of sales | 97% | 64% | 35% |
The price distribution for products produced in Scotland is more skewed towards the lower price per unit than products from the rest of the UK for both the number of products and also when taking into account the volume of alcohol in the sales.
For instance, at a minimum unit price of 65p, 93% of Scottish produced top selling products (i.e. 14 of the 15 top selling Scottish produced products), and 97% of the volume of sales, were sold for less than 65p on average in 2022. Comparatively, only 67% of products produced in the rest of the UK, and 64% of the volume of sales were sold below 65ppu on average in 2022.
At the overall level, the price distribution of the top selling products suggests that increasing the level of MUP to 65p per unit would impact a smaller proportion of products from the rest of the UK than of those produced in Scotland, all else equal.
Business location of top selling brands in Scotland
In addition to the location of production, the Scottish Ministers have considered the impact of minimum unit pricing on goods with reference to the location of the producer’s business.
Using the same sales data as for production location above, an assessment has been made of the location of the UK registered address of the companies producing the top selling products in Scotland. This assessment is based on searching publicly available resources, and for the purposes of this consultation is based on the UK registered address of the owner or subsidiary company. For a number of imported products, primarily wines, the UK address of the bottling company or distributor identified has been used.
This assessment sees products by brands such as Heineken and Strongbow, both Heineken brands, which are assessed to be produced in the rest of the UK assigned to Scotland as the parent company’s UK registered office address is in Edinburgh. Likewise, products by Diageo owned brands such as Smirnoff vodka and Bells whisky are assigned to the rest of the UK as Diageo’s UK registered office address is in London.
When just considering the location of the registered office of a business in the UK, the share of top selling off-trade brands from a business with a Scottish address is considerably smaller than those with an address in the rest of the UK (Table 59).
| Products | Volume (units) | % of Volume | Value (£) | % of Value | |
|---|---|---|---|---|---|
| Scotland | 9 | 394,240,731 | 27% | 230,111,283 | 26% |
| rUK | 41 | 1,055,681,439 | 73% | 644,888,341 | 74% |
| Total | 50 | 1,449,922,170 | 100% | 874,999,624 | 100% |
As with the location of production, the average price per unit of off-trade brands from businesses with a registered office in Scotland is lower than those from the rest of the UK (58ppu compared to 61ppu in 2022) (Table 60).
| Business location | Average Unit Price 2022 (by volume) |
|---|---|
| Scotland | 0.58 |
| rUK | 0.61 |
| Total | 0.60 |
The average price masks the variation in the prices of specific products from businesses located in Scotland and the rest of the UK. This price distribution of the top selling off-trade products helps identify the share of products (in both absolute number and by volume of sales) which could potentially be impacted by a different level of MUP. The share of products priced below a section of unit prices is presented in Table 61 across brands from different business locations.
| Scotland | rUK | Total | ||
|---|---|---|---|---|
| Share sold below £0.55 per unit | By number of products | 22% | 24% | 24% |
| By volume of sales | 24% | 19% | 20% | |
| Share sold below £0.60 per unit | By number of products | 56% | 49% | 50% |
| By volume of sales | 79% | 61% | 66% | |
| Share sold below £0.65 per unit | By number of products | 67% | 63% | 64% |
| By volume of sales | 82% | 70% | 73% |
The price distribution for brands whose producer’s business address is located in Scotland is more skewed towards a lower price per unit than brands from producers whose business is located in the rest of the UK for both the share of number of products and also when considering the volume of alcohol in the sales.
For instance, , 67% of the brands with a Scottish registered business address, and 82% of the volume of sales, were sold for less than 65p per unit on average in 2022. Comparatively, only 63% of brands with a registered business address in the rest of the UK, and 70% of the volume of sales, were sold below 65ppu on average in 2022.
At the overall level, the price distribution of the top selling products suggests that increasing the level of MUP to 65p per unit would impact a smaller proportion of products produced by business with a registered address in the rest of the UK than of those produced by businesses with a registered address in Scotland, all else equal.
Product (brand) level impacts
While at the overall level, (based on analysis of the Top 50 selling brands) there is no indication that brands produced outwith or by a business located outwith Scotland are disadvantaged by a minimum unit price of 65p in comparison to brands produced in or by a business located in Scotland , this does not mean that individual products with a connection to the rest of the UK will not be impacted by a change in the minimum unit price to 65p per unit.
For the Top-50 off-sales brands, Table 62 groups the brands by their production location and highlights which brand sold for an average unit price of below 65p in 2022.
| Sales Rank (Volume) | Brand | Average Unit Price (2022) | Type | Production location | UK business address* |
|---|---|---|---|---|---|
| 1 | Smirnoff | 0.55 | Spirit | Scotland | rUK |
| 2 | Tennents | 0.56 | Beer | Scotland | Scotland |
| 4 | Stella Artois | 0.59 | Beer | Scotland | rUK |
| 6 | Glens | 0.54 | Spirit | Scotland | rUK |
| 7 | The Famous Grouse | 0.54 | Spirit | Scotland | Scotland |
| 9 | Gordons | 0.56 | Spirit | Scotland | rUK |
| 10 | Whyte & Mackay | 0.52 | Spirit | Scotland | Scotland |
| 17 | Smirnoff Red Label | 0.56 | Spirit | Scotland | rUK |
| 18 | Grants Vodka | 0.55 | Spirit | Scotland | Scotland |
| 22 | Brewdog | 0.74 | Beer | Scotland | Scotland |
| 25 | Glen Catrine | 0.52 | Spirit | Scotland | rUK |
| 29 | Gordons Premium Pink | 0.58 | Spirit | Scotland | rUK |
| 35 | McEwans | 0.54 | Beer | Scotland | rUK |
| 43 | Bells Scotch Whisky | 0.52 | Spirit | Scotland | rUK |
| 49 | Innis & Gunn | 0.60 | Beer | Scotland | Scotland |
| 3 | Budweiser | 0.55 | Beer | rUK | rUK |
| 5 | Strongbow | 0.57 | Cider | rUK | Scotland |
| 8 | Buckfast Tonic Wine | 0.76 | FW | rUK | rUK |
| 11 | Corona Extra | 0.67 | Beer | rUK | rUK |
| 13 | Captain Morgan Original | 0.51 | Spirit | rUK | rUK |
| 16 | Birra Moretti | 0.74 | Beer | rUK | Scotland |
| 19 | Heineken | 0.65 | Beer | rUK | Scotland |
| 20 | Fosters | 0.60 | Beer | rUK | rUK |
| 23 | San Miguel | 0.59 | Beer | rUK | rUK |
| 30 | Dragon Soop | 0.75 | RTD | rUK | rUK |
| 41 | Bombay Sapphire | 0.60 | Spirit | rUK | rUK |
| 39 | Kronenbourg 1664 | 0.52 | Beer | rUK | rUK |
| 42 | Coors Light | 0.54 | Beer | rUK | rUK |
| 50 | Thatchers | 0.61 | Cider | rUK | rUK |
| 46 | Carling | 0.52 | Beer | rUK | rUK |
| 12 | Barefoot | 0.73 | Wine | International | rUK |
| 14 | Yellow Tail | 0.71 | Wine | International | rUK |
| 15 | Casillero Del Diablo | 0.70 | Wine | International | rUK |
| 21 | Bacardi | 0.54 | Spirit | International | rUK |
| 24 | Kopparberg | 0.92 | Cider | International | rUK |
| 26 | I Heart | 0.73 | Wine | International | rUK |
| 28 | Peroni Nastro Azzurro | 0.78 | Beer | International | rUK |
| 31 | Absolut Vodka Blue Label | 0.58 | Spirit | International | rUK |
| 32 | Trivento | 0.66 | Wine | International | rUK |
| 33 | Mcguigan Black Label | 0.61 | Wine | International | rUK |
| 27 | Guinness | 0.66 | Beer | International | rUK |
| 34 | 19 Crimes | 0.70 | Wine | International | rUK |
| 36 | Magners | 0.54 | Cider | International | rUK |
| 37 | Isla Negra Seashore | 0.58 | Wine | International | rUK |
| 38 | Jam Shed | 0.64 | Wine | International | rUK |
| 40 | Blossom Hill | 0.69 | Wine | International | rUK |
| 44 | Hardys Varietal Range | 0.61 | Wine | International | rUK |
| 45 | Hardys Stamp | 0.56 | Wine | International | rUK |
| 47 | Echo Falls | 0.70 | Wine | International | rUK |
| 48 | Jack Daniels Tennessee | 0.65 | Spirit | International | rUK |
Source: Scottish Government analysis of Circana Ltd market sales data
Beyond manually researching location information for top selling brands there is limited information or data on the movement of alcoholic products between different parts of the UK. Large corporations will often operate across all parts of the UK and there is no recent published information on the flow of final or intermediate products by different drink type within the UK internal market. There is particularly limited information about the origin or movement of the components or ingredients of alcoholic products.
Certain categories of alcoholic drink are, however, known to be more commonly produced in the rest of the UK than in Scotland. For instance, cider in particular is more likely to be produced in the rest of the UK than Scotland where there are only a small number of independent cideries. Vodka and whisky on the other hand are more likely to be produced domestically in Scotland.
Figure 11 shows the share of different products (by volume) sold below a minimum unit price of 65p (in 2022). The top of the dark shaded blue bar represents the share of the volume of each drink type sold below 65ppu and therefore likely to be directly impacted by the increase in the level of minimum price.
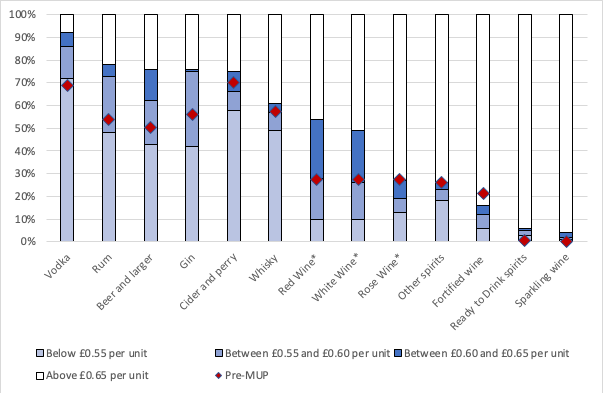
It should be noted that the share of products sold below the minimum unit price level of 65p is based on the volume of sales (by unit of alcohol) and therefore is weighted by consumers purchasing the relatively cheaper products in higher volume. It does not mean that this is the percentage of all individual products which were priced below this price.
The minimum unit price of 65p would have the largest direct impact on vodka based on the most recent sales data, with 92% of vodka sales in the off-trade being under 65ppu in 2022. Vodka was the second most impacted category with the introduction of MUP when 69% of sales had been below 50ppu in 2017.
Three quarters of gin and rum off-sales (76% and 78% respectively) were sold under 65ppu on average in 2022 and would be impacted by the price floor, both above their share of sales under 50ppu ahead of MUPs introduction, when it was 56% and 54% respectively. 76% of beer and lager was sold under 65ppu in the off-trade in 2022. This compares to 51% in 2017 below 50ppu.
A MUP at 65ppu would impact a slightly larger share of cider and perry sales compared to when MUP was first introduced at 50ppu. In 2022 75% of off-trade cider and perry sales were under 65ppu compared to 70% of sales below 50ppu in 2017.
Whisky would see a similar share of products impacted at a 65ppu as was the case when MUP was introduced at 50ppu, at 61% in 2022 and 58% in 2017. However, this combines blended and malt whisky and may mask price changes at the lower end of the category.
Fortified Wines and Ready-To-Drink spirits would see little direct impact from a 65ppu MUP.
Those categories of drinks products which will have the greatest increase in price when the minimum unit price increases are likely to see the greatest reduction in sales. Within each category, individual products may be impacted to a greater or lesser degree. Consumers may response to price rises in a number of different ways, including ceasing to purchase a product altogether, reducing the overall volume of a product purchased, switching to purchase a different product within the same category or switching to products within a different category.
The potential for a minimum unit price increase to result in “switching” behaviour depends on a number of factors. Cross-price elasticities[115] show the potential substitutability of drink types as prices change, but these are only available at the high level drink category (e.g. spirits, wines) and are at an aggregated population level. Ultimately, at an individual consumer level, the substitutability of drinks to other brands within the same drink type, or to a product within the wider product category (i.e. a different type of spirit), a different product category (i.e. a spirit to a beer), or changing container size, or abstaining altogether, comes down to individual preferences, brand loyalties, and incomes.
If considering the potential for switching in the context of vodka (the greatest impacted product category based on the most recent sales data), the most likely switching would be from one vodka to another vodka product (for example, from a previously lower cost vodka brand to a premium vodka brand). Some consumers may switch from vodka to another product type. It is likely that spirits, such as whisky, gin or rum, would be considered more natural substitutes to vodka than a product such as wine or beer. Those categories of products are also impacted by the minimum unit price increase to a lesser extent than vodka, and some products within those categories could experience an increase in sales.
Top selling products at category level analysis
Beer and Cider
The top 20 selling off-trade beers and ciders make up one-third (33%) of the volume of total off-trade beer and cider sales in Scotland in 2022, and 29% of the value.
Beer dominates the top selling off-trade beer and cider products, with 18 of the top selling products in 2022 being beer, and two cider.
Six of the top 20 selling off-trade beers and ciders have been identified as being produced in Scotland by a business with a registered address in Scotland. These are all Tennents Lager products of varying sizes, and make up the top three highest selling beer and cider products. These six products make up 46% of the volume, and 42% of the value, of the top 20 beer and cider off-trade sales in Scotland in 2022.
18 of the top selling off-trade beer and cider products were sold below 65ppu on average in Scotland in 2022, with the two being sold above 65ppu both produced in the rest of the UK.
While both cider products in the list have a registered address in Scotland, by virtue of their parent companies address, neither are thought to be produced in Scotland. Cider is primarily produced in England and we are not aware of any products produced at scale in Scotland.
The average price of the products produced in Scotland from a company with a registered business address in Scotland was 55ppu in 2022. This is lower than the average price of the products either produced in rUK or with their registered business address in rUK, which was 58ppu in 2022.
| Product | Size | ABV | Price per unit (pence) | Production Location | UK Business Address |
|---|---|---|---|---|---|
| TENNENTS LAGER | 15 CT X 440 ML | 4 | <55 | Scotland | Scotland |
| TENNENTS LAGER | 4 CT X 568 ML | 4 | 55-59 | Scotland | Scotland |
| TENNENTS LAGER | 10 CT X 440 ML | 4 | <55 | Scotland | Scotland |
| STELLA ARTOIS PREMIUM LAGER | 4 CT X 568 ML | 4.8 | <55 | Scotland | rUK |
| STELLA ARTOIS PREMIUM LAGER | 10 CT X 440 ML | 4.6 | <55 | Scotland | rUK |
| TENNENTS LAGER | 12 CT X 440 ML | 4 | 55-59 | Scotland | Scotland |
| CORONA EXTRA REGULAR | 12 CT X 330 ML | 4.5 | 60-64 | rUK | rUK |
| BUDWEISER REGULAR | 10 CT X 440 ML | 5 | <55 | rUK | rUK |
| STRONGBOW DARK FRUIT CIDER | 10 CT X 440 ML | 4 | 60-64 | rUK | Scotland |
| CORONA EXTRA REGULAR | 18 CT X 330 ML | 4.5 | <55 | rUK | rUK |
| BUDWEISER BEER | 12 CT X 300 ML | 5 | <55 | rUK | rUK |
| BUDWEISER REGULAR | 4 CT X 568 ML | 5 | <55 | rUK | rUK |
| FOSTERS REGULAR | 10 CT X 440 ML | 3.7 | 55-59 | rUK | rUK |
| BIRRA MORETTI LAUTENTICA | 12 CT X 330 ML | 4.6 | >65 | rUK | Scotland |
| BUDWEISER BEER | 15 CT X 300 ML | 4.5 | 55-59 | rUK | rUK |
| TENNENTS LAGER | 4 CT X 500 ML | 4 | 60-64 | Scotland | Scotland |
| MCEWANS EXPORT | 4 CT X 500 ML | 4.5 | 55-59 | Scotland | rUK |
| STRONGBOW ORIGINAL | 10 CT X 440 ML | 5 | <55 | rUK | Scotland |
| CORONA EXTRA REGULAR | 4 CT X 330 ML | 4.6 | >65 | rUK | rUK |
| TENNENTS LAGER 8 PRE-PRICED | 8 CT X 440 ML | 4 | 55-59 | Scotland | Scotland |
Spirits
The top 20 off-trade spirits make up 45% of the volume of all spirit sales in Scotland in 2022. The average price of the top 20 off-trade spirit products in Scotland was 54 ppu in 2022. 10 of the products were vodka, four were whisky, three gin, two rum, and one cream liqueur.
Five of the top 20 off-trade spirit products have been identified as being both produced in Scotland and from a company with a registered business address in Scotland. Three of these are whisky, and the other two vodka products. They make up 24% of the volume of alcohol of the top 20 sales, and 25% of the value, in 2022.
The average price of the spirits identified as being produced in Scotland and produced by a company registered in Scotland, was 52ppu in 2022. This is lower than the average price of 55ppu for the remainder of the off-trade spirit products.
| Product | Size | ABV | Price per unit (pence) | Production Location | UK Business Address |
|---|---|---|---|---|---|
| SMIRNOFF VODKA | 1000 ML | 37.5 | <55 | Scotland | rUK |
| THE FAMOUS GROUSE BLENDED WHISKY | 1000 ML | 40 | <55 | Scotland | Scotland |
| GORDONS GIN | 1000 ML | 37.5 | <55 | Scotland | rUK |
| SMIRNOFF VODKA | 700 ML | 37.5 | <55 | Scotland | rUK |
| WHYTE & MACKAY BLENDED WHISKY | 1000 ML | 40 | <55 | Scotland | Scotland |
| BAILEYS ORIGINAL CREAM LIQUEURS | 1000 ML | 17 | >65 | rUK | Scotland |
| CAPTAIN MORGAN ORIGINAL SPICED GOLDEN RUM | 1000 ML | 35 | 55-59 | rUK | rUK |
| GLEN CATRINE VODKA | 700 ML | 37.5 | <55 | Scotland | rUK |
| BACARDI RUM | 1000 ML | 37.5 | <55 | International | rUK |
| GRANTS VODKA VODKA | 1000 ML | 37.5 | <55 | Scotland | Scotland |
| GORDONS GIN | 700 ML | 37.5 | 55-59 | Scotland | rUK |
| THE FAMOUS GROUSE BLENDED WHISKY | 700 ML | 40 | <55 | Scotland | Scotland |
| GRANTS VODKA VODKA | 350 ML | 37.5 | 55-59 | Scotland | Scotland |
| GLENS VODKA 18.75 PRE-PRICED | 1000 ML | 37.5 | <55 | Scotland | rUK |
| GLENS VODKA 13.49 PRE-PRICED | 700 ML | 37.5 | <55 | Scotland | rUK |
| BOMBAY SAPPHIRE GIN | 1000 ML | 40 | <55 | rUK | rUK |
| GLENS VODKA 18.99 PRE-PRICED | 1000 ML | 37.5 | <55 | Scotland | rUK |
| ABSOLUT VODKA BLUE LABEL VODKA | 1000 ML | 40 | <55 | International | rUK |
| SMIRNOFF RED LABEL VODKA | 1000 ML | 37.5 | <55 | Scotland | rUK |
| JACK DANIELS TENNESSEE IMPORTED WHISKY | 1000 ML | 40 | 55-59 | International | rUK |
Wine
The off-trade wine market is less concentrated than the other major categories, with the top 20 products only making up 13% of the volume of off-trade wine sales in 2022. All of the top 20 selling wines are imported into the UK. While we cannot identify the exact location of import, we were unable to identify any distributors of these products having a business address registered in Scotland.
The average price per unit of the top 20 selling off-trade wines in 2022 was 73 ppu. Only six of the products sold below 65ppu on average in 2022.
| Product | Size | ABV | Price per unit (pence) | Production Location | UK Business Address |
|---|---|---|---|---|---|
| TRIVENTO MALBEC | 750 ML | 14 | 60-64 | International | rUK |
| BAREFOOT PINOT GRIGIO | 750 ML | 12 | >65 | International | rUK |
| CASILLERO DEL DIABLO SAUVIGNON BLANC | 750 ML | 13.5 | >65 | International | rUK |
| ISLA NEGRA SEASHORE SAUVIGNON BLANC | 750 ML | 12.5 | 55-59 | International | rUK |
| CAMPO VIEJO CRIANZA TEMPRANILLO | 750 ML | 13 | >65 | International | rUK |
| 19 CRIMES RED GRAPE BLEND | 750 ML | 13.5 | >65 | International | rUK |
| CASILLERO DEL DIABLO CABERNET SAUVIGNON | 750 ML | 13.5 | >65 | International | rUK |
| YELLO LABEL PROSECCO SPUMANTE | 750 ML | 10.5 | >65 | International | rUK |
| YELLOW TAIL SHIRAZ | 750 ML | 13 | >65 | International | rUK |
| JAM SHED SHIRAZ | 750 ML | 13.5 | 60-64 | International | rUK |
| ECHO FALLS ROSE GRAPE BLEND | 750 ML | 9 | >65 | International | rUK |
| BAREFOOT MERLOT | 750 ML | 13.5 | 60-64 | International | rUK |
| YELLOW TAIL CHARDONNAY | 750 ML | 11 | >65 | International | rUK |
| I HEART PINOT GRIGIO | 750 ML | 12 | 60-64 | International | rUK |
| YELLOW TAIL PINOT GRIGIO 100 CENTS OFF | 750 ML | 12.5 | >65 | International | rUK |
| OYSTER BAY SAUVIGNON BLANC | 750 ML | 13 | >65 | International | rUK |
| VILLA MARIA SAUVIGNON BLANC | 750 ML | 13.5 | >65 | International | rUK |
| HARDYS VARIETAL RANGE CHARDONNAY | 750 ML | 12.5 | 60-64 | International | rUK |
| BAREFOOT WHITE ZINFANDEL | 750 ML | 8.5 | >65 | International | rUK |
| WAIRAU COVE SAUVIGNON BLANC | 750 ML | 12.5 | >65 | International | rUK |
Fortified Wines and Ready-To-Drinks
Of the top 20 selling Fortified Wines and Ready-To-Drinks in the Scottish off-trade in 2022, the two top selling were Fortified Wines and the remainder were Ready-To-Drinks. All products apart from one sold for an average price higher than 65ppu in 2022. The average price of the top 20 off-trade products overall was 83 ppu in 2022.
Two of the products have been identified as being produced in Scotland. All of the products are from businesses or distributors whose registered address in the rest of the UK. There is therefore no product both produced in Scotland from a business with a registered address in Scotland.
| Product | Size | ABV | Price per unit (pence) | Production Location | UK Business Address |
|---|---|---|---|---|---|
| BUCKFAST TONIC WINE | 750 ML | 15 | >65 | rUK | rUK |
| BUCKFAST TONIC WINE | 350 ML | 15 | >65 | rUK | rUK |
| JACK DANIELS COLA | 330 ML | 6 | >65 | rUK | rUK |
| WKD VODKA BLUE BLUE | 700 ML | 4 | >65 | rUK | rUK |
| DRAGON SOOP DARK FRUIT PUNCH 2.99 PRE-PRICED | 500 ML | 8 | >65 | rUK | rUK |
| VENOM DRAGON SOOP PEACH & RASPBERRY 2.99 PRE-PRICED | 500 ML | 8 | >65 | rUK | rUK |
| SMIRNOFF ICE LEMON | 700 ML | 5.5 | >65 | Scotland | rUK |
| WKD VODKA BLUE VODKA | 10 CT X 275 ML | 4 | >65 | rUK | rUK |
| VK MIXED FRUIT | 10 CT X 275 ML | 4 | >65 | rUK | rUK |
| DRAGON SOOP STRAWBERRY & LIME 2.99 PRE-PRICED | 500 ML | 8 | >65 | rUK | rUK |
| DRAGON SOOP BLUE RASPBERRY 2.99 PRE-PRICED | 500 ML | 8 | >65 | rUK | rUK |
| WKD BLUE BLUE 3.39 PRE-PRICED | 700 ML | 4 | >65 | rUK | rUK |
| DRAGON SOOP APPLE & BLACKCURRA#1 2.99 PRE-PRICED | 500 ML | 7.5 | >65 | rUK | rUK |
| DRAGON SOOP RED KOLA 2.99 PRE-PRICED | 500 ML | 8 | >65 | rUK | rUK |
| SMIRNOFF ICE ICE 3.29 PRE-PRICED | 700 ML | 5.5 | >65 | Scotland | rUK |
| WKD BLUE BLUE | 12 CT X 275 ML | 4 | >65 | rUK | rUK |
| FOUR LOKO STRAWBERRY | 695 ML | 12 | 55-59 | International | rUK |
| DRAGON SOOP PINEAPPLE & KIWI 2.99 PRE-PRICED | 500 ML | 7.5 | >65 | rUK | rUK |
| DRAGON SOOP VENOM 2.99 PRE-PRICED | 500 ML | 8 | >65 | rUK | rUK |
| DRAGON SOOP MANGO PINK LEMONADE 2.99 PRE-PRICED | 500 ML | 7.5 | >65 | rUK | rUK |
Imports to Scotland via the rest of the UK
Product level information is not available for the location at which imported products sold in Scotland entered into the UK. Data is however available on the port of entry of all imports into the UK since the start of 2022, although not its final destination. This can provide an illustration of the potential scale of imports which might pass through other parts of the UK before being sold in Scotland.
Table 66 shows that in the year to September 2022 there was over £100 million worth of alcoholic beverages imported into the UK through Scottish ports, the majority of which was from EU countries. For context, the total sales value of alcoholic drinks in Scotland in 2021 was estimated at £4.3 billion[116].
| EU Imports | Non-EU imports | Total imports | |
|---|---|---|---|
| Scottish ports | 69,617,612 | 38,792,031 | 108,409,643 |
| UK total* | 2,319,829,488 | 730,798,464 | 3,050,627,952 |
| Scottish ports % of total | 3% | 5% | 4% |
*UK total excludes inland clearance, not collected, PoC unknown
Imports through Scottish ports make up 4% of the total imports of alcoholic beverages into the UK over the period. With Scotland’s population share of the UK around 8.5%, this suggests a large share of imported products consumed in Scotland may have been imported via ports in the rest of the UK.
| Year | SIC | Industry or product group | Total output of products at basic prices (£m) | Rest of UK imports (£m) | Rest of world imports (£m) |
|---|---|---|---|---|---|
| 2019 | 11.01-04 | Spirits & wines | 4,054.0 | 932.7 | 648.7 |
| 2019 | 11.05-06 | Beer & malt | 427.2 | 331.5 | 137.8 |
Table 67 provides estimates of the level of imports from the rest of the UK and rest of the world used in the production of the two primary alcohol product groups. This is a balanced estimate derived from the Supply and Use Tables[118] and it should be noted that imports data, especially within the UK, are difficult to estimate.
It should also be noted that the majority of domestically produced alcoholic beverages overall, are exported and not consumed domestically.
IMPACT OF MINIMUM UNIT PRICE IN SCOTLAND ON UK OFF-TRADE ALCOHOL MARKET
Market under consideration
For the UK market impact assessment we restrict the scope of our assessment to the UK off-trade alcoholic beverages market only (i.e. exclude the on-trade). We consider this the most appropriate definition of where the potential impacts of MUP will be felt.
The average price of alcohol in the on-trade is significantly higher than a proposed minimum unit price of 65ppu. In 2021, the average price per unit of alcohol in Scotland was 64p in the off-trade and £2.04 in the on-trade. For England and Wales the average price per unit in 2021 was 60p in the off-trade and £2.05 in the on-trade.
The PHS MUP evaluation found no evidence that the on-trade in Scotland had experienced any noticeable change in sales or negative impacts as a result of the introduction of MUP in Scotland in 2018.
Given the potential impacts on the on-trade would likely follow from second round impacts from MUP’s direct impact on off-sales (i.e. through changes in the price differential between the two channels and income impacts) it is reasonable to assume that the wider UK on-trade market would not have experienced impacts from MUPs introduction in Scotland while there were no noticeable impacts in Scotland’s on-trade itself.
Impact of MUPs introduction in Scotland in 2018 on UK market
The PHS evaluation found strong evidence the introduction of MUP at 50ppu was associated with an increase in the average price of off-trade alcohol in Scotland. Ferguson et al (2022)[119] found that the price of off-trade alcohol increased from 60ppu to 66ppu between 2017-18 and 2018-19 following the introduction of MUP, an increase of 10.0%. The research noted this increase appeared to depart from the previous trend, for instance the average price had only increased by 3.4% the previous year.
At the wider UK level, there is no evidence that the introduction of MUP in Scotland resulted in changes to prices in England and Wales. Between 2017-18 and 2018-19 following the introduction of MUP in Scotland, the average off-trade price in England and Wales only increased by 1.7%, from 60ppu to 61ppu. This was noted as not deviating from the established trend in England and Wales, which had shown a similar increase in prices to Scotland in the year priors to MUPs introduction.
There was no strong evidence that products not directly impacted by the introduction of MUP (i.e. previously sold below 50ppu) increased in price in Scotland. The proportion of alcohol sold at 65ppu and above in Scotland post-MUP was similar to that in England & Wales, and did not change substantially in Scotland with the introduction of MUP. This indicates limited evidence of products not directly impacted by MUP increasing prices to maintain a price differential with products which had previously been priced below MUP.
In terms of consumption, after one year of implementation there was strong evidence that MUP was associated with a 2.0% reduction in the total volume of pure alcohol sold per adult through the off-trade in Scotland. There was strong evidence that England & Wales saw a 2.4% increase over the same period. This would suggest that MUP in Scotland did not have a significant impact on the off-trade in the rest of the UK compared to the impact in Scotland.
While there is no consistent evidence of any overall positive or negative impact on the alcoholic industry in Scotland following the introduction of MUP, there is evidence that some parts of the sector were adversely impacted. For instance a decrease in producers’ revenues was observed, although this was considered in qualitative interviews to be minor. The greatest reductions in sales were seen for cider and spirits with mixed evidence of the impact on beer and wine. Similarly some individual retailers reported they had been affected adversely in the MUP evaluation[120], with at least some of the variation likely to be due to the extent to which the products sold were affected by MUP. Taken together with the lack of evidence that MUP lead to direct impacts on the prices of off-trade sales in the rest of the UK, we can assume there were unlikely to have been industry level impacts across the rest of the UK (which had not been seen in Scotland).
Increase in minimum unit price to 65ppu in Scotland
Given increasing the price to 65ppu represents a relatively small real terms increase in the minimum unit price relative to when it was introduced, we would expect that the impacts on the industry remain broadly similar, with no overall positive or negative impact to the industry but the potential for individual producers and retailers to experience impacts differently. We would expect this to hold both in Scotland and across the UK.
Products which currently sell below the minimum unit price of 65p and therefore have to increase in price will be most likely to see a fall in sales volume, with consumers potentially switching to more premium products, either in the same drink category or substituting to another drink type. We would expect the impacts to be primarily distributional, with some products gaining at the expense of others, rather than any materially negative overall impact to the industry. Modelling from SARG estimates that increasing the MUP level would result in a further increase in revenues to the industry compared to when MUP was first introduced of £4.4 million a year.
Given the small scale of Scotland within the wider UK off-trade market, we would expect that there would be no significant overall market impact on the UK market, and distributional impacts would be smaller when considered in the context of the larger overall market.
Table 68 presents modelling results for estimated changes in Scottish off-sale alcohol consumption and spending of different drink types of increasing MUP to 65ppu compared to 50ppu MUP in 2019 (i.e. impacts when MUP was first introduced) and compared to removing MUP.
| 65ppu (2023 prices) compared to 50ppu (2019 prices) | 65ppu (2023 prices) compared to removing MUP | |||
|---|---|---|---|---|
| Type | Consumption | Spending | Consumption | Spending |
| Beer | -6.3% | -2.4% | -17.5% | -3.7% |
| Cider | -6.6% | -1.6% | -28.8% | 0.5% |
| Wine | -2.0% | -0.3% | -5.9% | -1.3% |
| Spirits | -3.2% | 1.5% | -7.8% | 3.2% |
| RTDs | -0.6% | -0.6% | -1.5% | -3.6% |
Source: Sheffield University analysis for Scottish Government (provided in 2019 prices) uprated into 2023 prices using CPIH.
Taking beer as an example, with a 65ppu MUP, it is estimated that consumption of beer is 17.5% lower than it would be compared to if there was no MUP in place, and 6.3% lower than a MUP of 50ppu in 2019. Spending on the other hand would only be 3.7% lower than if there was no MUP in place, or 2.4% lower than a MUP of 50ppu in 2019.
To consider the impacts of these changes at the level of the UK market we need to put Scottish off-trade sales of each drink type into the context of their consumption in UK. Data from PHS’s latest MESAS publication (only available at the level of Great Britain) on Scottish off-trade purchases (of pure alcohol) as a share of the total in Great Britain in 2021 is shown in Table 69.
| 2017 | 2018 | 2019 | 2020 | 2021 | |
|---|---|---|---|---|---|
| Total | 9.9% | 9.6% | 9.4% | 9.2% | 9.2% |
| Spirits | 12.4% | 11.6% | 11.3% | 11.0% | 10.8% |
| RTDs | 13.0% | 13.3% | 13.0% | 14.3% | 14.0% |
| Fortified Wines | 18.8% | 22.0% | 23.1% | 21.6% | 20.7% |
| Wine | 8.9% | 8.9% | 8.9% | 8.8% | 8.8% |
| Other | 4.8% | 4.9% | 5.1% | 4.9% | 4.4% |
| Cider | 9.6% | 8.2% | 7.4% | 7.3% | 7.2% |
| Perry | 8.1% | 5.6% | 4.3% | 4.3% | 4.5% |
| Beer | 8.5% | 8.2% | 8.0% | 7.7% | 7.8% |
(Source: Scottish Government analysis of PHS MESAS tables)
Market research data purchased by the Scottish Government (from Circana Ltd[121]) allows us to consider the share of off-sales currently priced below 65ppu in Scotland in the context of the wider UK off-trade market. Scotland’s share of the UK off-trade market reported in 2022 is similar to those reported by PHS (based on a different underlying data source), with Scottish sales making up 9.6% of UK sales by alcohol volume (and 9.9% by value).
Taking the UK off-trade market as a whole, only 6% of the volume of off-trade alcohol in the full UK market was sold in Scotland below 65ppu in 2022 – see Figure 12. This gives an indication of the potential scale of the impact of MUP in Scotland on the UK market as a whole. The impact again varies by category, with only 0.4% of UK off-trade sparkling wine sales affected (primarily reflecting that sparkling wine is sold significantly above 65ppu), compared to 15.5% of vodka sales by volume (reflecting that over 90% of off-trade sales of vodka in Scotland were below 65ppu in Scotland and sales of spirits are higher per capita in Scotland).
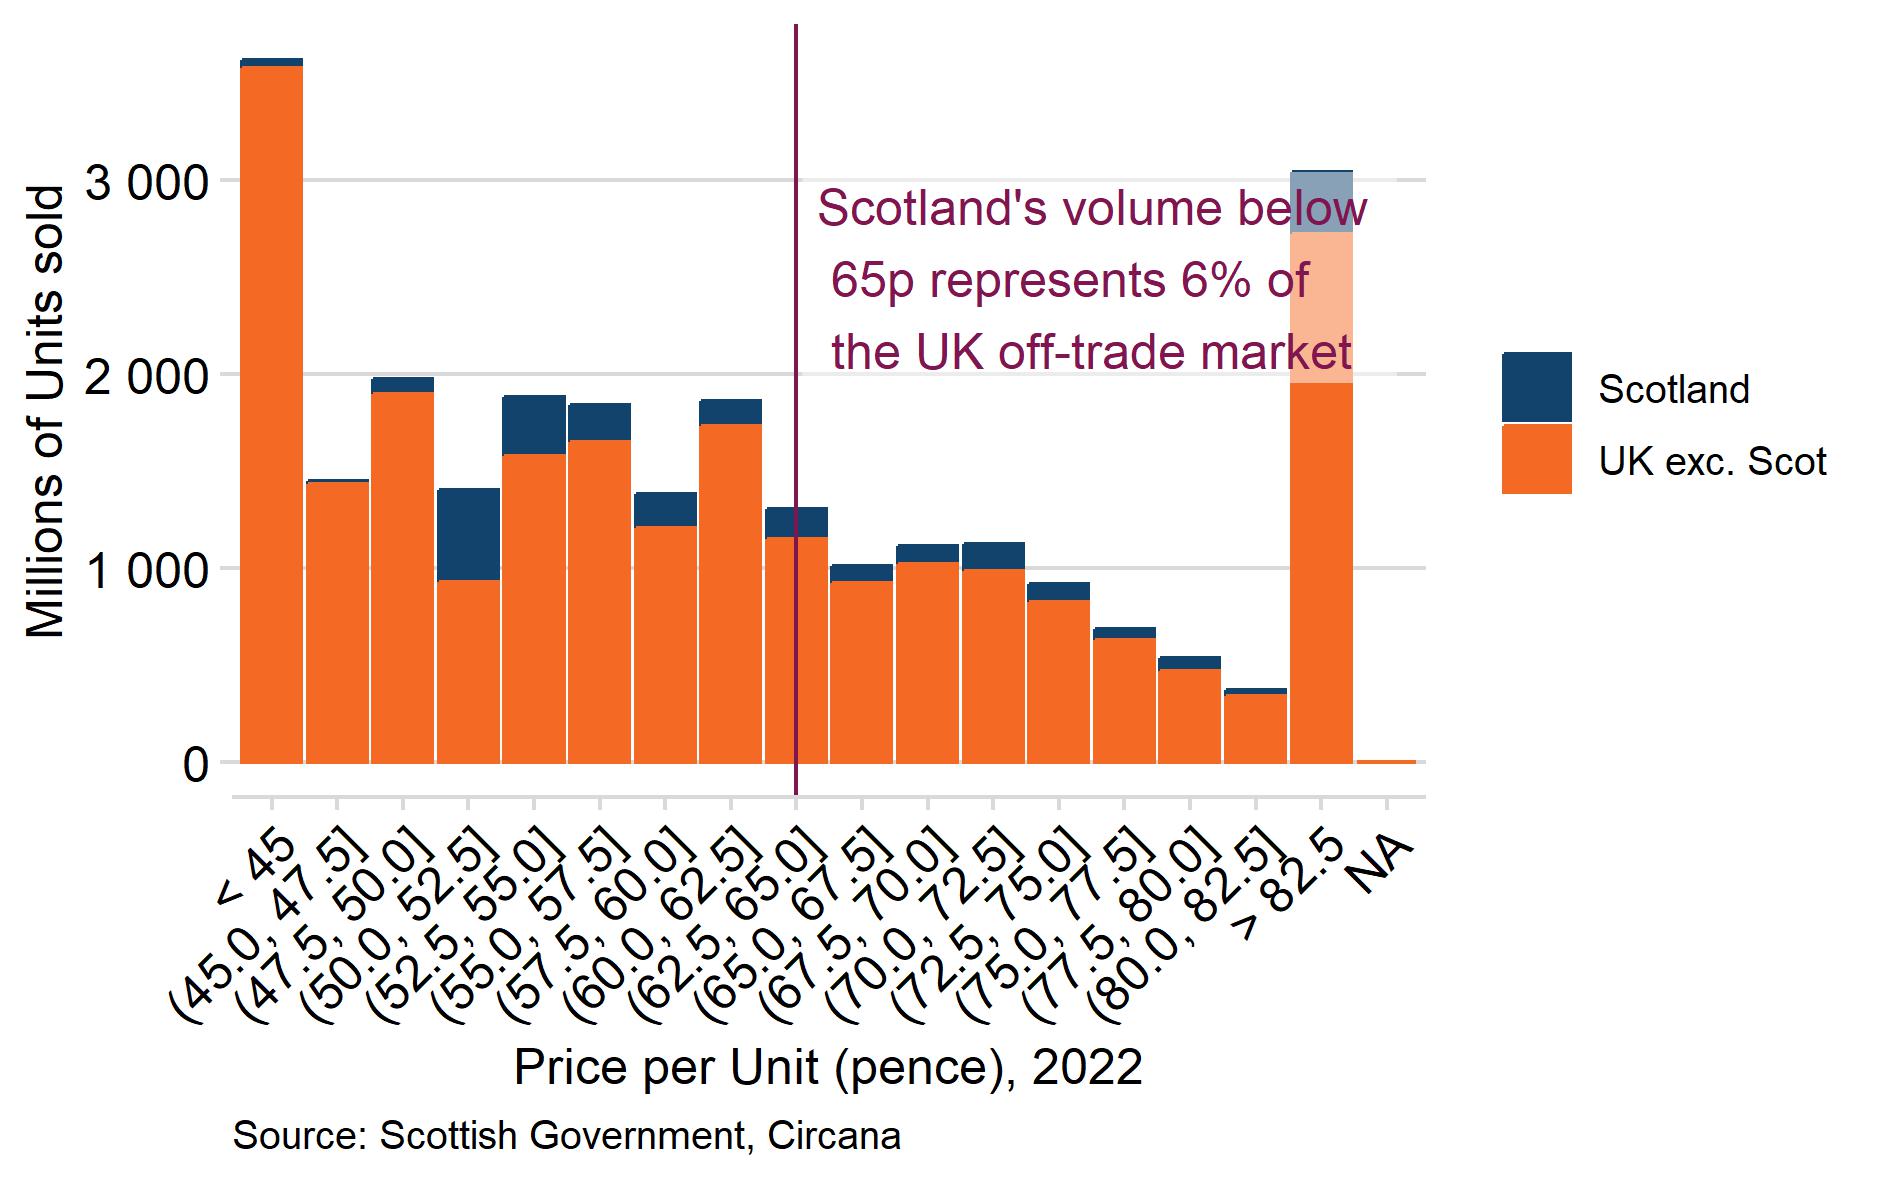
Fortified wines, and to a lesser extent Ready-To-Drinks, have a disproportionately high share of their off-trade sales in Scotland, at 20.7% and 14% respectively in 2021 (from PHS data). These would therefore be the drink types for which any impact of MUP on Scottish sales has the most potential to result in a material impact at the UK market level. However, these are also the drink types with some of the highest average prices per unit and therefore unlikely to be directly impacted by a MUP of 65ppu in Scotland alone, let alone the rest of the UK. In 2022, only 4% of Fortified Wines and 1.5% of RTDs in the UK market were sold below 65ppu in Scotland.
Mechanisms of potential market impact of MUP
There are various mechanisms by which the UK market for goods could potentially be impacted by MUP.
A company wishing to introduce a new product to the UK off-trade alcoholic beverages market may want to use an introductory price as a marketing technique to build up a market share. They would be restricted from pricing below 65ppu in Scotland and 50ppu in Wales, while they could retail at any price in the rest of the UK. In the case of introducing many types of product to Scotland, this means that this marketing technique would not be available.
For illustration, say this product was a vodka. Given that Scottish off-trade spirits sales only made up 10.8% of the Great British market in 2021, or that 15.5% of vodka sales in the UK were sold below 65ppu in Scotland in 2022, it seems unlikely that a new product would not launch in the UK due to the revised MUP in Scotland.
Indeed, evidence from the PHS evaluation highlights research which show following the introduction of MUP at 50ppu in 2018 there was “Limited evidence that MUP has had an effect on the introduction or discontinuation of products, or on the alcohol by volume content of products (Ferguson et al (2022))”
The small scale of Scottish market in the wider UK market and wider UK trends in demand were also highlighted as limiting the impacts of MUP. For instance, while there was evidence of “some producers and retailers reported changing their strategies and product lines in response to MUP, including de-listing and reformulating small number of product lines, and introducing new formats and packaging sizes. These changes were limited due to the Scottish market being a small portion of many firms’ overall turnover.” and “MUP was understood to have accelerated the UK-wide trend towards premiumisation (consumer demand for higher-value products).” (Frontier Economics (2019))[122]
There are also alternative marketing methods available, and the evidence highlights such change in approaches may have already been utilised. Frontier Economics (2023)[123] reported that “Interviewees noted the constraints that MUP places on promotions and one large retailer has responded to this by attempting to be more creative and imaginative with how they market products”
Similar arguments can be made for an existing product which would sell for below the MUP level in its absence, and therefore has to either increase in price, reformulate/resize or withdraw from the market. It is uncertain how consumers would respond to a specific product increasing in price in Scotland to comply with the MUP requirements, with the response depending on brand loyalty, the price differential to products of the same drink type or drinks considered substitutes. Cross-price elasticities estimates[124] illustrate how the demand for a drink types changes, and the demand for other drink types change, when it experiences a change in price. While these are limited to broad drink categories, they do illustrate that on the whole the increase in the price of each category of alcohol is associated with not only a decrease in its own demand, but also increased/decreased demand for other off-trade categories. The evidence presented in Pryce et al. (2023) presents estimated cross-price elasticities within the broader categories of on/off trade alcohol and cigarettes. Cross-price elasticities are empirically estimated, and in other work could be estimated across ‘alcoholic beverages’ and other food and drink categories.
The evidence from the PHS evaluation[125] highlights “Products that saw larger price increases (e.g. ciders, perries and supermarket own-brand spirits) tended to see larger reductions in sales. The cider category reduced 17.5% in natural volume sales per adult overall; some strong ciders saw reductions of over 90% in convenience stores. The perry category reduced by 40.0% overall. There were also large reductions in natural volume sales for supermarket own-brand blended whisky (-31.6%), gin (-22.7%), and vodka (-40.1%).” (Ferguson et al (2022))”. There was also some evidence that “MUP led to switching from larger to smaller product sizes, limited by brand loyalty and occasion-based purchases.” (Frontier Economics (2019)).
Again, in the context of the overall market these potential impacts represent a small share of overall sales. Only 5.8% of the UK off-trade cider and perry sales were sold in Scotland below 65ppu in 2022, and only 6.8% of the UK off-trade whisky sales were sold in Scotland below 65ppu in 2022.
Conclusion
Scotland represents a small share of the UK off-trade alcohol market, with under 10% of off-trade alcohol sales by volume of alcohol occurring in Scotland. There is no evidence that the introduction of MUP in Scotland resulted in any significant adverse impacts to the UK alcohol market, and no noticeable impacts on consumption or prices of off-trade alcohol in England and Wales following MUPs introduction in Scotland.
While MUP will likely continue to result in distributional impacts, with relatively low cost high strength products potentially losing sales, the evidence does not suggest that increasing the minimum unit price to 65ppu in Scotland would result in a significant adverse impact to the UK off-trade market overall. In 2022, it is estimated that only 6% of UK off-trade alcohol market was Scottish sales below the proposed MUP of 65ppu. This figure will likely have fallen by the time a MUP of 65ppu is introduced following a period of high inflation and alcohol duty increases in 2023.
Common Frameworks
The Scottish Ministers are not aware of MUP as a policy being covered in any common framework under the UK Common Frameworks [126].
International trade and investment
Considerations for assessing impacts on international trade
A: Does this measure have the potential to affect imports or exports of a specific good or service, or groups of goods or services?
Yes/No
B: Does this measure have the potential to affect trade flows with one or more countries?
Yes/No
C: Does this measure include different requirements for domestic and foreign businesses?
- i.e. are imported and locally produced goods/services treated equally?
- i.e. are any particular countries disadvantaged compared to others?
Yes/No
D: If the answer to C is Yes, is the basis for different treatment anything other than it enables foreign businesses to operate on a level playing field in Scotland?
Yes/No
The Scottish Ministers must ensure that any new policy or legislation complies with the UK’s international obligations, including World Trade Organization (WTO) agreements and free trade agreements.
Minimum unit pricing legislation will continue to apply equally to international producers, wholesalers[127] and retailers selling products in Scotland. Any firms wanting to import alcoholic beverages would have to ensure their retail prices comply with the MUP legislation.
A change in the minimum price level could impact on a foreign company’s ability to compete for Scottish consumption if the company was currently benefitting from low costs of production and selling at low margins relative to other imports or domestic products.
However, analysis of the top selling products purchased in the Scottish supermarket and convenience sector demonstrates that the largest share of the impact would likely be on domestically produced products (i.e. from within Scotland or the rest of the UK).
As shown in Table 56, 23% of the volume of the top selling alcohol purchased in the off-trade in Scotland is thought to be produced out with the UK.
The premium nature of imported products in the top selling list is reflected in the average price of international products in the top selling list: 67ppu compared to 56ppu for Scottish products and 62ppu for products from the rest of the UK (Table 57).
Only around 40% of the top selling international products were sold 65ppu on average in 2022 (Table 58).Table 59
The categories of product most likely to be affected by the increased minimum unit price, as shown in Figure 11, are spirits, beer, perry and cider. Scotch whisky would, in accordance with its registered geographical indication, be produced in Scotland; the most popular white spirits (by volume) (Smirnoff vodka, Glen’s Vodka and Gordon’s gin) are produced in the UK and the majority of beer and cider affected is also likely to be domestic production (Table 62).
The Scottish Government recognises that there are certain categories of imported products which may be disproportionally affected, although they make up a very small part of the overall Scottish market. In 2021, although brandy constitutes only 1% of off-sales, 92 per cent of it was sold under 65p per unit. Conversely, no champagne would be directly impacted by any level of MUP below 85p per unit.
International standards and WTO notification requirements
The legal obligation to notify technical regulations under the WTO Technical Barriers to Trade Agreement[128] is not considered to apply to the proposals to continue the effect of the MUP provisions or to amend the minimum price per unit.
The proposals do not amount to technical regulations within the definition of Annex 1.1 of the TBT agreement, as they would not lay down product characteristics or their related processes and production methods.
The Scottish Ministers do not consider MUP is covered by an International Standard.
EU Alignment
The continuation of the MUP provisions and the increase in minimum unit price to 65ppu are not considered likely to impact on the Scottish Government’s policy to maintain alignment with the EU. MUP was introduced when the UK was still an EU Member State.
Contact
Email: MUP@gov.scot
There is a problem
Thanks for your feedback