Long term survey strategy: mixed mode research report
Findings from research exploring mixed mode survey designs in the context of the Scottish Government’s general population surveys. The report details information on key issues, potential mitigations and remaining trade-offs, and includes 21 case studies on relevant surveys.
Appendix A – Survey case studies
Coverage of case studies
The table below summarises key information about the surveys included in this case study annex, to assist with navigating to case studies likely to be of interest to particular readers.
| Survey name | UK or inter-national? | Cross-sectional (CS) or longitudinal (L)? | Current mode and/or mode(s) being considered? | Core topic focus (and relevance to SHS/SHeS/ SCJS) |
|---|---|---|---|---|
| Active Lives | UK | CS | Push-to-web with paper follow-up | Physical activity (SHeS) |
| British Election Study | UK | CS | Face-to-face (CAPI), but push-to-web used during pandemic | Political attitudes and behaviours |
| British Social Attitudes | UK | CS | Push-to-web with telephone option | Social and political attitudes |
| Childcare and Early Years survey of parents | UK | CS | Concurrent mixed-mode design using face-to-face, telephone, and video interviewing modes | Parents’ use and views of childcare and early years provision |
| Crime Survey for England and Wales | UK | Was CS, but has moved to partially longitudinal design | Mixed mode panel design (face-to-face then telephone), considering move to web. | Crime and victimisation (SCJS) |
| Current Population Survey (USA) | Inter-national | Longitudinal (panel design) | Panel design – face-to-face and then telephone. Exploring adding web mode. | Multiple topics in addition to core employment questions |
| Dutch Crime and Victimisation Survey | Inter-national | CS | Push-to-web with telephone knock-to-nudge | Crime and victimisation (SCJS) |
| English Housing Survey | UK | CS | Face-to-face, but testing push-to-web with face-to-face follow-up | Housing (SHS/SHCS) |
| European Health Interviews Survey | Inter-national | CS | Varies by country, but in UK telephone | Sexual health (but has also included wider health measures – e.g. height & weight) (SHeS) |
| European Social Survey | Inter-national | CS | Face-to-face, but most recent UK wave included parallel run with push-to-web (with paper follow-up) | Social and political attitudes |
| Food and You 2 | UK | CS | Push-to-web with paper follow-up | Food safety and food-related behaviours |
| GP Patient Survey | UK | CS | Push-to-web with paper follow-up | Experiences of GP services (SHeS) |
| Health Survey for England | UK | CS | Face-to-face, but has consulted on options to move to online / online + telephone design | Health (SHeS) |
| National Survey for Wales | UK | CS | Push-to-telephone, online self-complete, face-to-face follow-up | Multiple, including: culture, childcare, volunteering, environment and internet use (SHS) and health (SHeS) |
| National Survey of Sexual Attitudes and Lifestyles | UK | CS | NatSal 4 had a 3 strand approach – face-to-face survey, telephone + web follow-up survey, and web survey using an opt-in online panel. | Sexual health, attitudes and lifestyles. Includes biosamples (SHeS) |
| National Travel Survey | UK | CS | Face-to-face with self-complete diary (diary moving from paper to digital) | Travel (SHS) |
| Next Steps | UK | Longitudinal | Most recent wave was push-to-web with priority face-to-face follow-up, with video and telephone as secondary options. | Multiple topics (cohort study – similarities to GUS) |
| Northern Ireland House Condition Survey | UK | CS | Face-to-face | House conditions and characteristics of householders (SHS/SHCS) |
| Participation Survey | UK | CS | Push-to-web with targeted paper follow-up | Cultural, digital and sporting engagement (SHS) |
| Transformed Labour Force Survey | UK | CS | Push-to-web with telephone matching and knock-to-nudge follow-up | Labour market participation |
| Understanding Society | UK | Longitudinal | Push-to-web with face-to-face and telephone follow-up. Latest fresh sample recruited using Push-to-web with face-to-face follow-up. | Multiple. Includes some bio-markers (SHeS) |
Active Lives Adult Survey (Formerly Active People Survey)
Commissioner: Sport England
Overview: The Active Lives Adult Survey collects data on the engagement in, and attitudes to, sport and physical activity. It is a repeated cross-sectional survey in England that uses a push-to-web approach.
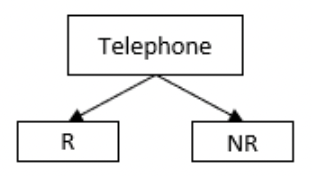
Methodology: The Active People Survey began in 2005 as a repeated cross-sectional single mode telephone survey. It ran roughly every year, for a total of seven waves, ending in 2013. It used a continuous fieldwork design with sample issued monthly, although reporting was annual.
The survey population comprised all adults aged 16+ in England. Random Digit Dialling (RDD) was used for sample selection using numbers linked to local authorities. Those in mobile-only households, estimated by Ofcom to be around 15% in 2011, were not covered. One adult was randomly selected from eligible household members using the Rizzo selection method.
Approximately 160,000 interviews were achieved per year, with a response rate of 27.3% (AAPOR3) for Wave 6 (2011/12). The questionnaire took on average 15 minutes. No incentive was offered.
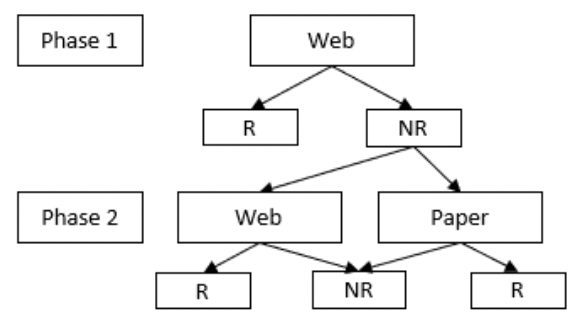
The Active Lives Adult Survey is the successor survey to the Active People Survey, established in 2015 and still ongoing. It is a repeated cross-sectional survey push-to-web survey, using a delayed concurrent mixed-mode design, with web in phase 1, and web and paper in phase 2. As with the Active People Survey, it uses a continuous fieldwork design with sample issued monthly, although reporting is annual.
The survey population comprises all adults aged 16+ in England. The sample is drawn from PAF using a systematic random sample of addresses. Up to two adults per household (any two) can take part.
Approximately 175,000 adults are interviewed each year, with the sample designed to deliver a pre-determined number of responses per local authority (500 for most local authorities). The household-level response rate (AAPOR1) was 21.2% in 2021/22, which equates to 23.1% (AAPOR3) when assumed ineligibles are excluded. The questionnaire takes on average 12 minutes to complete. A conditional £5 voucher is provided to each adult that completes the survey. Most responses (71%) are by web, with the remaining 29% by paper.
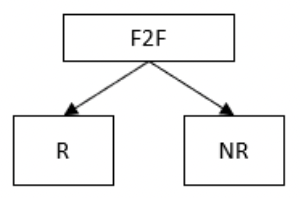
Visual summary of current and previous design
Key points of relevance:
- Overall similarity to SHS, SHeS or SCJS: As a push-to-web survey the Active Lives Adult survey differs in terms of mode design from the three SG surveys. It is also far shorter and does not include any additional elements. There are however some commonalities with the SHeS in terms of the topics covered, specifically those relating to physical activity.
- Decision to transition: The rise of mobile-only households – resulting in undercoverage for the Active People Survey - was a key determinant of the decision to move from a telephone to a push-to-web administration. The proportion of mobile-only households was estimated by Ofcom to be 15% in 2011 and rising at around 1% per year. Sport England commissioned a face-to-face survey to compare activity levels between adults with and without landlines, finding that activity levels were lower among those who only had a mobile, with differences persisting after controlling for demographic differences.
- Time series: The Active Lives Adult survey differed from the Active People Survey in the scope of activities that were measured, for instance including walking, cycling and dance. It also examined activity levels over a twelve-month period, rather than just four weeks. Because of such changes to the questionnaire, as well as the change in mode, no attempt was made to continue the time series from the Active People Survey.
British Election Study (BES)
Commissioner: Funded by the Economic and Social Research Council and conducted by the Universities of Manchester, Nuffield College (Oxford), Royal Holloway.
Summary: The British Election Study (BES) is the longest running social science survey in the UK and one of the longest running election studies worldwide. It has taken place after each general election since 1964. The aim is to understand people’s reasons for turning out to vote, or not, as well as attitudes towards parties, society and democracy and how these change in time.
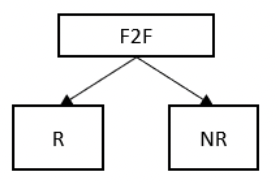
Methodology: For the last couple of decades, the main survey has been a post-election cross-sectional study with members of the general public in Great Britain who are eligible to vote. The fieldwork normally takes place for around 4 months following a General Election. In early waves of the study, a pre-election sweep was also undertaken. The survey is normally conducted face-to-face in home by an interviewer using Computer Assisted Personal Interviewing (CAPI). It uses random pre-selected sampling with addresses clustered using Lower Super Output Areas. At addresses where there is more than one eligible adult, a person selection is made.
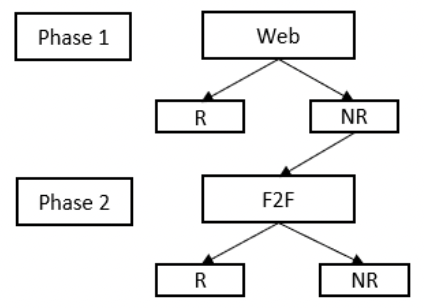
In line with previous waves, the 2019 study was designed as a face-to-face in-home survey administered by an interviewer. Fieldwork commenced under this design but was halted in mid-March 2020, as a result of the coronavirus pandemic. A second phase of research was implemented, following a push-to-web with a postal follow-up approach, with the questionnaire self-administered by respondents, either online via Computer Assisted Web Interviewing (CAWI) or on paper (PAPI).
Respondents were incentivised to take part. In 2019, for the face-to-face fieldwork, the incentive ranged from £10 to £25 depending on age and area. For the push-to-web fieldwork, £5 vouchers were offered unconditionally with the first mailing and £25 conditional vouchers were offered upon completion of the survey. After the final reminder, respondents were given a £50 voucher upon completion of the survey
For the forthcoming (2024) election, the study has returned to a face-to-face design.
Key points of relevance:
- Overall similarity to SHCS, SHeS or SCJS: In its normal approach, BES is similar in approach to SCJS in that it uses random pre-selected sampling to get a representative sample of adults. However, the topics are exclusively focused on political attitudes and behaviours. There is one core follow-up task and the survey asks respondents for their permission to match their data to the voter register to validate whether they voted.
- Decision to transition: The decision to transition for the 2019 wave was made in response to the coronavirus pandemic rather than because of any other considerations. The redesign process included: identifying addresses to be reissued; designing new survey materials (invitation letter, reminder letters and postcard); and redesigning the questionnaire to be appropriate for self-completion by CAWI and PAPI.
- Response rates: The unadjusted response rate was 43.9% in 2019, 40.4% in 2017, and 49.2% in 2015[62]. (Unadjusted response rate trend quoted, since for the push-to-web element, it is not possible to account for ineligible addresses. In 2015 and 2017, the difference between the adjusted and unadjusted response rate was around 6 percentage points). It is unusual for push-to-web/mixed mode approaches to outperform face-to-face approaches. The 2019 election response rate was higher than the 2017 election because: the surprise election in 2017 led to practical issue with fieldwork management including limited reissuing; and the push-to-web element of BES 2019 was undertaking in the summer of 2020 where people were more likely to be at home (response rates to push-to-web did generally increase during Covid-19 lock down periods).
- Representativeness: Generally, the composition of the achieved sample was similar between the different modes in 2019. People who completed the survey online were more likely to be younger, hold a degree, be mortage owners, have no religion and work full-time. Those who completed by post were more likely to be older, non-graduates, home owners, and women. However, the change in approach led to considerably higher levels of question (item) non-response in the self-completion modes.
- Follow-up tasks: BES asks for permission to link data to the voter register to validate whether they voted. There were lower levels of consent to data linkage in the self-completion modes than for the face-to-face sample (81% agreement in face-to-face, compared with 59% among online respondents and 63% among postal respondents). A similar pattern by mode was seen in agreement to be recontacted. This is relevant to the SHS, SCJS and SHeS, all of which collect permission to recontact for future research.
British Social Attitudes survey (BSA)
Commissioner: Omnibus (multiple funders), run by National Centre for Social Research.
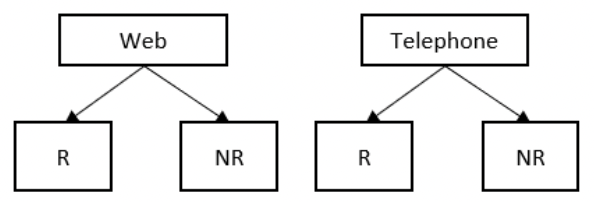
Overview: BSA was established in 1983 as an annual random probability cross-sectional survey tracking changing social, political and moral attitudes. Having been conducted face-to-face with a pen and paper self-completion section since 1983, from 2020, it has been run as a mixed mode push-to-web survey with telephone (CATI) option.
Methodology: From 1983, BSA has been carried out annually, as a cross-sectional survey of adults aged 18+. From 1993 onwards, the sample frame has been the Postcode Address File (PAF).
Prior to 2020, postcode sectors were randomly selected from a stratified list of all postal sectors in Britain (excluding those North of the Caledonian Canal), addresses were randomly selected from within those sectors, and a single adult per address was then randomly selected on the doorstep by an interviewer using a computer-generated random selection procedure. In addition to the main face-to-face interview (conducted using CAPI since 1994), a pen and paper self-completion questionnaire was completed after the main interview.[63]
In 2020, BSA moved to a push-to-web design, with option for telephone completion. An unclustered sample of addresses is drawn from the PAF and invited by letter to participate online. Where the sampled household contains more than one person aged 18 or over, up to two adults are invited to log in and complete the questionnaire online (with two unique access codes included in the invite letter). Up to three reminder letters are sent. Respondents are encouraged to complete the survey online but are given the option of taking part by telephone (this is made more explicit in the second reminder – it is only mentioned in the FAQs in the invite and first reminder).[64]
The survey is modularised – in 2022, each address was allocated to one of 12 versions of the questionnaire, reflecting different module combinations. The median interview length in 2022 was 28 minutes (compared with 55-59 minutes in 2019, the last year of face-to-face fieldwork). In 2019, the sample size was 3,224 from 7,956 issued addresses, an AAPOR1 response rate of 44.3%. In 2022, the sample size was bigger – 6,638 adults from 36,900 issued addresses – but with a lower household level response rate of 14.2% (AAPOR3, assuming 9% ineligible addresses, as in BSA F2F). The 2022 response rate was almost identical to the 2020 response rate, when the survey was first conducted by push to web with CATI option.
Key points of relevance:
- Overall similarity to SHS, SHeS or SCJS: While the modular, omnibus structure of BSA has some similarities with SHS, the topics are exclusively focused on attitudes rather than measuring prevalence of behaviours or experiences. There are no additional data collection elements (as with the surveyor visits on SHS/SHCS or biomeasures on SHeS).
- Decision to transition: The decision to change the BSA methodology was made following application of NatCen’s REMODEL approach.[65] Other options that were considered but rejected were:
- Push-to-web with face-to-face follow-up (P2W+F2F) – originally this was identified as the approach most likely to maximise data quality. However, the current P2W + CATI model was selected for further development during 2020, as face-to-face fieldwork was not possible as a result of the Covid-19 pandemic.
- Push-to-web with no alternative mode – rejected on grounds of scope for coverage error
- Push-to-web with paper follow-up – rejected as impractical with multi-funder and modular/streamed design. Producing a paper version of the three SG surveys would also likely be difficult based on the current level of streaming / modularisation, particularly for the SHS which also includes 12 different streams.
- Response rates: Response rates on BSA are lower compared with some other surveys that have transitioned to P2W as the primary mode, including Food and You 2 and the Participation survey (31.6% / 32% vs. 14.2% for BSA), highlighting the variability in response rates even when transitioning to the same primary mode. Reasons for this could include the relatively longer questionnaire length of BSA and the lack of a paper questionnaire option, for the reasons outlined (36.2% of Food and You 2 responses are by paper). It is not clear from the technical reports what proportion of BSA responses are by telephone, but this is likely to be low given that people are encouraged to complete it online and the telephone option is only mentioned in the FAQs until the second reminder letter.
- Impact on sample profile: analysis of the P2W + optional CATI design indicates that, compared with the previous face-to-face design, it under-represents people from Black ethnic backgrounds and over-represents owner occupiers vs. social renters, those with a degree, and the politically interested (those with ‘a great deal of interest’ in politics). However, P2W was slightly less likely to overrepresent those in employment compared with the F2F survey. The finding on over-representing the politically interested highlights a core challenge that needs to be considered with P2W designs – that is, the risk that those more engaged in the topic are more likely to respond (something that was also apparent when the SCJS moved to at CATI design in 2006/7, when it was assessed that those more likely to have experienced crime were more likely to take part compared with the face-to-face survey – see Hope, 2005). Political engagement is also likely to be relevant to views of, for example, local public services and volunteering, both of which are key topics on SHS. If the Scottish Government decides to test alternative mode designs, it may be worth including questions on political interest / engagement as part of these tests.
Visual summary of current and previous design:
Childcare and Early Years survey of parents
Commissioner: Department for Education (DfE)
Overview: The Department for Education’s flagship survey of parents, which measures parents’ use of childcare and early years provision, as well as their views and experiences. A repeated cross-sectional survey in England that uses a concurrent face-to-face, telephone and video mixed-mode design. A push-to-web ‘mode trial’ has been conducted to explore the opportunities for the survey to transition to a push-to-web design, but the survey has not made the transition.
Methodology: The Childcare and Early Years survey of parents (CEYSP) began in 2004 and has since been conducted every year or every other year for a total of 16 waves, the latest being the 2024 wave. It is a repeated cross-sectional survey which, for most of its history, has used a single mode face-to-face design. The COVID-19 pandemic, however, resulted in the design changing in 2021 to a concurrent mixed-mode design using face-to-face, telephone, and video interviewing modes, and this design is still in use.
The survey population comprises children aged 0 to 14 in England. Data are collected from parents of these children (no children are interviewed). The sample is drawn from the Child Benefit Register held by HM Revenue & Customs[66]. No random selection of the parent is carried out, but the responding parent or guardian must have main or shared responsibility for making childcare decisions. In the great majority of cases the respondent is the mother.
Approximately 6,000 interviews are achieved per wave. The response rate (AAPOR3) was 48% in 2022 (AAPOR3), lower than the 62% achieved in 2019 under the pre-COVID design. The questionnaire takes on average 45 minutes to complete. No incentive is offered. In 2023 the split between the modes was 70% face-to-face, 29% telephone, and just 1% video.
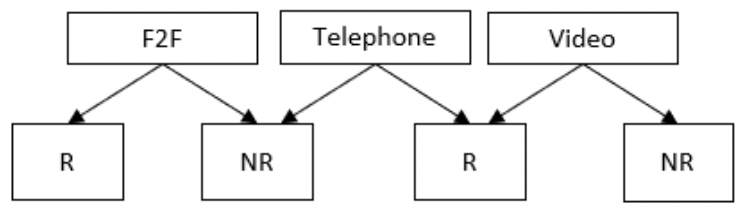
Visual summary of current and previous design
The Childcare and Early Years survey of parents push-to-web Mode Trial (CEYSP) was conducted in 2019, to test the optimal design of a push-to-web survey intended to produce survey estimates to complement, or even replace, those produced by the face-to-face CEYSP (Huskinson et al, 2019). A further mode trial was carried out in 2023 (Huskinson et al, 2024, in press).
Both mode trials used a single-mode web design. No paper questionnaires were used due to the relatively young age of respondents (median age of 39), and also the extent of routing in the questionnaire.
The 2019 survey resulted in 2,704 achieved interviews. An experiment on incentivisation found that the response rate was 12% (AAPOR1) when no incentive was used, rising to 21% with a conditional £5 voucher incentive. Other experiments found that including (versus excluding) an information leaflet had no impact on response, nor did varying the length of the survey between 15 and 20 minutes.
The profile of the achieved push-to-web sample contained certain biases when compared to the 2018 face-to-face CEYSP, being more highly educated, having higher incomes employment levels, comprising more couple (vs lone parent) families, and living in less deprived areas of the country. The offer of a £5 incentive reduced these biases slightly but did not eliminate them.
Analyses of key survey estimates found that the push-to-web survey produced similar estimates to the 2018 face-to-face CEYSP for simple, factual questions. These included estimates of children’s use of formal childcare and parents’ awareness of certain policies. However, greater differences were apparent with respect to questions relating to attitudes and intentions. These differences could be due to mode-specific selection effects, mode-specific measurement effects, or both.
Key points of relevance:
- Overall similarity to SHS, SHeS or SCJS - The CEYSP shares similarities with the three SG surveys in that it uses a face-to-face design, is similar in terms of length, includes complex routing (loops and nested loops), and enjoys a relatively high response rate. However it differs in terms of topic, the lack of any random selection of an adult, and does not include any additional data collection elements like SHS or SHeS.
- Decision not to transition - The CEYSP has continued as a face-to-face survey, albeit allowing (since 2021) the option for telephone and video interviews in response to COVID-19. While the CEYSP mode trial provides evidence that valuable data can be obtained via a push-to-web survey of parents, no decision to transition has been made given the sacrifices that would be required, chiefly the loss of time series data, the need for a streamlined and far simpler questionnaire, and the risk of introducing bias into some survey estimates.
Crime Survey for England and Wales (CSEW)
Survey name: Crime Survey for England and Wales (CSEW)
Commissioner: Office for National Statistics (ONS)
Overview: CSEW has been carried out since 1982 to measure the crime experienced by households in England and Wales in the 12 months prior to interview, including unreported and unrecorded crime. In 2021, the survey transitioned to a longitudinal panel design, with an initial face-to-face interview followed by telephone interviews at 12-month intervals. CSEW was traditionally a repeated cross-sectional, single-mode face-to-face survey.
Methodology : The survey has been running on a continuous basis since 2001. The sample is issued monthly, with interviewers covering all allocated addresses by the end of each calendar month.
The survey population is households in England and Wales, and people living within those households. The sample frame used is PAF. An adult aged 16+ within the household is randomly selected to be interviewed. Where applicable, a child aged 10-15 is also selected randomly to take part in responding households. In 2022/23, the sample was designed to achieve 625 interviews with adults in each of the 42 Police Force Areas, aside from City of London, and a total of 31,183 interviews with adults were achieved, and 1,309 with children aged 10-15.
The questionnaire includes core modules asked of all respondents, alongside modules to be asked of random subsamples only, and self-completion modules asked of all aged 16-74. Open-ended questions about offences are designed to mirror how crimes are recorded by police. Topics include experiences of victimisation and the criminal justice system, perceptions of crime and attitudes towards crime-related issues. In 2019/20, the survey took a mean of 48 minutes to complete. The survey is longer for victims of crime (65 minutes for victims, 43 minutes for non-victims).
Response rates before COVID were high (AAPOR1 response rates of 70%+), but there has been a drop in response in more recent years (44% in 2021/2022 and 42% interim response rate in 2022/23). In 2015, analysis carried out on the reduced response rate found that the impact on the key CSEW estimates was minimal (Williams & Holcekova, 2015). However, at the time, the response rates had dropped from approximately 75% to 70%. The subsequent decline in response rates led to a suspension of the survey’s national statistic status in July 2022.
During COVID (May 2020 – March 2022), the design was transformed to a rotating panel telephone survey.[67] Due to the sensitive nature of the topic, respondents were advised to take part in the survey in a private environment. The sample frame comprised CSEW respondents who had agreed to recontact between May 2018 and February 2020. Respondents were interviewed at approximately three-month intervals, up to a maximum of seven interviews. A shorter version of the questionnaire was used, removing the self-completion element and modules asked of random subsamples. In 2021/22, the survey took a mean of 23 minutes to complete. The response rate remained stable across waves: in 2021/22, the achieved response rate was 83.1% at wave 1, and 80.2% at wave 7 (AAPOR1). While the estimates are not directly comparable with the face-to-face CSEW due to the change in design (from cross-sectional to longitudinal), the achieved sample profiles were similar.[68]
Face-to-face interviewing resumed in October 2021. Driven by a requirement to double the sample size (from 30,000 to 60,000) for more detailed analyses, a mixed mode panel design was introduced. Face-to-face interviews are conducted at wave 1 and respondents are recontacted for a telephone interview 12 months later, forming wave 2. The number of subsequent follow up waves is yet to be determined, but there is potential for five waves.
The wave 1 face-to-face design enables a more accurate selection of one person in the household and collects highly sensitive data which may not be ethical or appropriate to ask about in a telephone or web survey. The wave 2 telephone interview is designed to collect the main estimates of crime and does not include the most sensitive questions on domestic abuse or sexual assault. The telephone survey is thus a cut down version, 30 minutes long, compared with the 50-minute face-to-face interview.
The vast majority of the questions included in the wave 2 telephone interview are exactly the same as in the wave 1 face-to-face interview, although some questions underwent minor editing to make them appropriate for the mode (for example ‘this area’ became ‘your local area’). CSEW was able to transition to this panel design at pace because the wave 1 face-to-face estimates are protected and not impacted by a mode change at wave 2. Learnings from the COVID telephone survey design were also applied to enable the transformation. One benefit of a panel design is that it provides the opportunity to analyse data on repeat victims. Wave 2 interviews started in October 2022, so the first set of data became available in October 2023. Work is ongoing to investigate the mode effects, including the panel design effects, and attrition.
Research has also been conducted to explore the feasibility of redesigning the survey as a web survey, though this will require a more radical transformation of the instrument with a significant impact on the time-series.[69] It was suggested from this discovery research that this transformation could provide an opportunity to improve the content to reflect the changes in perceptions of crime and policy focus since the survey was originally developed 40 years ago. In 2017/18, a self-completion web instrument was developed,[70] which was found to be suitable for respondents who had experienced no crime, a single incident, or clearly separated incidents, but was less suitable for more complex experiences. The complexity of the screener questions and victimisation modules led to a risk of crimes being double counted without an interviewer present.
In 2021/22, Kantar Public conducted a scoping review, further developed the online survey, and conducted a mode experiment with follow-up qualitative work to test the online instrument against the telephone survey[71]. The experiment found that a greater proportion of web respondents reported being a victim of crime compared with telephone respondents. Questions to check for double counting of incidents were included, and web respondents were more likely than telephone respondents to change their answers in response to these checks. Follow up qualitative work found the measures implemented to correct for double counting produced inaccurate results. Those taking part in the web survey were also more likely to find the survey ‘difficult’ compared with those taking part via telephone.
Three key options for the future design of CSEW have been determined:
1. Further develop the face-to-face and telephone questionnaires, drop the development of a web survey.
2. Develop a web survey that effectively collects data on complex crime experiences.
3. Develop a web survey that identifies respondents with complex crime experiences, who would be invited to a follow up survey with an interviewer.
The aim is to have some form of web instrument developed by late 2024 or early 2025, for further testing and piloting.
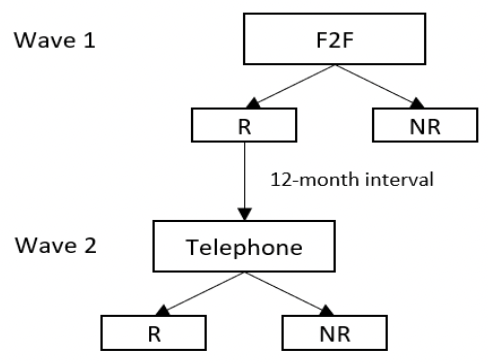
Visual summary of current and previous design
Key points of relevance
- Overall similarity to SHS, SHeS or SCJS: CSEW has obvious similarities to SCJS in terms of the topic area and aims of the research. Both CSEW and SCJS must navigate sensitive questions relating to crime and use complex questionnaire formats.
- Decision to transition: CSEW has recently transitioned to a panel design, maintaining the initial face-to-face interview at wave 1 and adding a telephone follow-up at wave 2. This means the wave 1 face-to-face estimates are protected and the time series is preserved. The panel design allows a larger sample size to be achieved for more precise estimates in a cost-effective way and enables analysis of repeat victimisation. Work is ongoing to develop an effective web instrument, but there remain challenges, as discussed.
- Stakeholder engagement: Consultation with stakeholders found strong support to move to a longitudinal panel design, but concerns were raised around comparability of data and attrition[72].
Current Population Survey (USA)
Commissioner: US Census Bureau and the U.S. Bureau of Labor Statistics (BLS).
Summary: The Current Population Survey (CPS) is the primary source of labour force statistics in the United States. It has been running since 1948. In addition to labour force questions, it often includes supplemental questions on various subjects: annual work activity and income, veteran status, school enrolment, contingent employment, worker displacement, and job tenure, among other topics. A wide range of sponsors also use the survey to collect data on a variety of topics as diverse as expectation of family size, tobacco use, computer use, and voting patterns.
Methodology[73]
Since the early 1990s (when it moved from paper data collection to computer assisted interviewing) until recently, the CPS methodology has been very stable over time.
It uses a probability selected sample of about 60,000 occupied households. Individuals aged 15 years of age or over are eligible. Those in the Armed Forces and people in institutions, such as prisons, long-term care hospitals, and nursing homes are ineligible.
One person generally responds for all eligible members of the household. If the reference person is not knowledgeable about the employment status of the others in the household, attempts are made to contact them directly.
The fieldwork is conducted during one week per month (that includes the 19th). The questions refer to activities during the prior week. Households are in the survey for 4 consecutive months, out for 8, and then return for another 4 months before leaving the sample permanently.
All first month-in-sample households receive a personal visit interview, and the first and fifth months’ interviews are typically done in person while the remaining interviews may be done over the telephone either by the field interviewer or an interviewer from a centralised telephone facility. Although the first and fifth interviews are supposed to be done in person, the entire interview may not be completed in person, and the field interviewer may call the respondent back to obtain missing information. The CPS CAPI instrument records whether the last contact with the household was by telephone or personal visit. Overall, about 66% of cases are interviewed by telephone, with almost 85% of the cases in-months 2-4 and 6-8 (after they return to the ‘live’ sample) done by telephone. Furthermore, a substantial percentage of cases in months 1 (initial month) and 5 (first wave after the break in interviewing) are obtained by telephone, despite standing instructions to the field interviewers to conduct personal visit interviews.
Some telephone interviewing is undertaken remotely using centralised facilities. The facilities complete all but 20 percent of the cases sent to them. These uncompleted cases are recycled back to the field for follow-up allowing enough time so that interviewers have 3 to 4 days to check on the cases and complete any required interviewing or classify the cases as noninterviews.
- Overall similarity to SHCS, SHeS or SCJS: The CPS follows a panel design with respondents first interviewed face-to-face and then interviewed by telephone at subsequent waves. This is different from the current designs of the three main surveys in Scotland but is similar to the design being considered for the Crime Survey of England and Wales (though with different fieldwork intervals).
- Decision to transition mode: The CPS is currently exploring the option of modernising the approach by adding a new internet self-completion mode. It is anticipated that this will help increase (or at least stabilise) the response rate. The CPS is currently undertaking a five-year project to develop and test this option. An outline of this five-year project is shown below[74]. The first year will include: an Expert Review and Content Review; Crowd Source Testing; Cognitive testing; Development of survey systems; and implementing lessons from the introduction of an internet self-response model.
- Stages in five year development project include:
- Year 1: Development/testing
- Develop new software for online and staff administered survey;
- Conduct first round of cognitive testing;
- Survey experts review content and provide feedback
- Year 2: Development/testing
- Continue development of software for online and staff administered survey;
- Second round of cognitive testing;
- Conduct usability testing;
- Finish programming new online and staff administered survey
- Year 3: Experiments
- Conduct experiments with new options for collecting survey responses;
- Conduct analysis of data to identify impacts on surveys from new software;
- Implement software improvement from analysis.
- Year 4: Field Test
- Conduct full end-to-end data collection testing;
- Identify recommendations and incorporate final changes to software;
- Year 3: Production
- Deploy new online and staff administered software to collect CPS data.
- Year 1: Development/testing
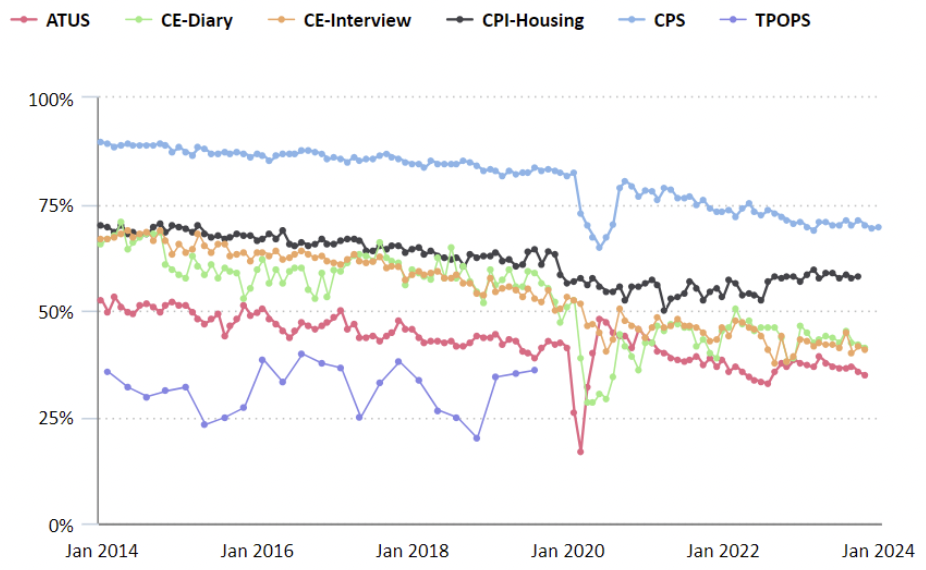
- Response rates: The CPS has followed trends in seeing its response rate reduce over time from 89.5% in 2014 to 69.5 in 2024[74].
- Representativeness: There are a variety of sources of nonresponse in the CPS: household nonresponse, panel nonresponse, and item nonresponse. “Nonresponse is a growing concern for the CPS…”[73] Weighting corrects for non-response in relation to age, race, sex and Hispanic ethnicity.
Dutch Crime Victimisation Survey (CVS)
Survey name: Veiligheidsmonitor (Dutch Crime Victimisation Survey (CVS), sometimes also known in English as the Netherlands Safety Monitor)
Commissioner: Dutch Ministry of Justice and Security, and the Central Bureau of Statistics
Overview: The Dutch Crime Victimisation survey (CVS) is a long-standing, cross-sectional survey conducted by Statistics Netherlands. It started in the early 1970s and has adjusted its methodology and modes several times due to changing policy needs, stakeholders and available options (Smit and Van Dijk, 2018). Currently, it uses a push-to-web design. Its purpose is to publish figures about crime rates, perceptions of safety, and satisfaction with police performance in the Netherlands. The survey is continuous, with samples issued monthly, and statistics published annually.
Methodology: The CVS uses a stratified simple random sampling design, for those aged 16 or older and registered as living in the Netherlands, with regions as strata. The sampling frame is based on the Municipal Basis Administration – the Dutch Government’s register of all residents in the Netherlands.
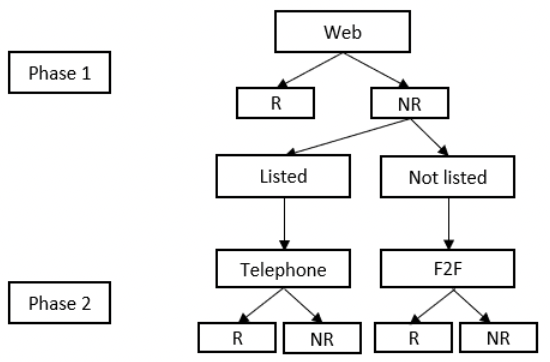
2006 – 2011: The survey used a hybrid mixed-mode design with two data collection phases. In the first phase, web was the only mode used (participants were also given the option of applying for a paper questionnaire, but uptake was low). Targeted at those who did not respond online, the second phase followed people up either by telephone or face-to-face, depending on whether it had been possible to match a telephone number to their address. Those in the sample who were listed with a telephone number were contacted by telephone, and if they were unlisted (or could not be contacted by phone), an interviewer attempted to conduct the interview face to face.
2011-present: In 2011, a large-scale, two wave experiment was conducted to estimate mode effects arising from undercoverage, nonresponse and measurement (see Buelens et al, 2012). In the first wave, a sample was drawn and distributed equally across four modes: web, paper, telephone and face to face. In the second wave, the full sample (both respondents and nonrespondents) was issued to interviewers (70% to face-to-face, 30% to CATI). This allowed for analysis to determine which changes in response were due to selection effects, and which were due to mode-related measurement effects. In the crime survey, there were found to be significant differences in responses (measurement error) between modes.
The survey was subsequently redesigned as a push-to-web survey, using a delayed concurrent mixed mode design with web in phase 1, and web and paper in phase 2. The paper component has since been gradually phased out.
The survey incorporates a telephone-to-nudge contact approach, whereby interviewers telephone nonrespondents to remind them to complete the survey, but do not complete the interview by telephone so as to avoid mode effects.
Visual summary of current and previous design
Key points of relevance:
- Overall similarity to SHS, SHeS or SCJS: Very similar topic areas as the SCJS, which is a key source of evidence on crime victimisation in Scotland.
- Admin data: Statistics Netherlands is required to use admin data wherever possible (since the implementation of the Statistics Netherlands Act of 1996, surveys must not be used to gather information that would be available as administrative data elsewhere). This influences what questions are asked and how samples are designed.
- Sample design: Samples are always stratified and are based on the Government’s register of all residents (an equivalent sample frame is not available for Scotland). The crime survey uses sample boosts which some municipalities pay for – mostly those that coincide with police regions. Within these, they may oversample certain areas. This can involve increasing the sample by several tens of thousands in one particular region.
- Time series: The CVS website states that: “The data are comparable over the years since 2012. Comparable figures have been obtained for several indicators between 2005 and 2012 by applying corrections. These corrections have been calculated to adjust for differences in methodology and questioning[75].” The CVS is therefore an example of a study that has applied statistical modelling to facilitate retention of time series, albeit only for limited indicators (see van den Brakel and Boonstra, 2021).
- Response patterns and accuracy: Experimentation which sought to estimate relative mode effects across different modes in the initial hybrid design, showed that mode effects were significant between those completing by web, and those completing face-to-face or by telephone. Different kinds of answers were being given, due to many of the questions being sensitive, perception-based, or requiring a level of recall. This led to the conclusion that mixed mode was not appropriate for this survey.
English Housing Survey (EHS)
Commissioner: Department for Levelling Up, Housing and Communities (DLUHC)
Summary: The English Housing Survey is a continuous repeat cross-sectional national survey of around 13,000 households annually, with around 6,000 physical inspections of properties. It collects information about people’s housing circumstances and the condition and energy efficiency of housing in England.
Methodology:[76] From 1967 to 2019/20, the EHS was conducted face-to-face. Addresses were sampled from PAF, using two-stage random probability sampling of PSUs (from a list stratified by region, % owner-occupiers, % of household reference persons in non-manual occupations), followed by addresses (with a boost of renters using ‘predicted tenure’ from Experian’s residata classifications). Either a Household Reference Person or their partner is interviewed. Interviews included rotating question sets for questions not required every year. The mean length of interview was 41 minutes.
In 2019/20, 13,332 interviews were achieved from an issued sample of 28,238 addresses issued, a response rate of 51% (AAPOR1). From 2018/19, all invited addresses received an unconditional £5 Post Office voucher and interviewers had up to 2 x £25 gift cards to use at their discretion to encourage reluctant householders. Addresses were not reissued, but interviewers had a high minimum call regime (9 calls minimum). Advance letters were tailored to different tenures.
Of households eligible for physical surveys in 2019/20, 63% agreed to have a physical survey, of which 86% went on to have a physical survey conducted (54% of occupied eligible households).
In response to the Covid-19 pandemic, the EHS initially moved to a push-to-telephone survey, with no interviewer visits (2020-21). It then moved to knock-to-nudge, again using telephone interviews in 2021-22. In both years, physical inspections were of the exterior of the property only, supplemented with some questions asked of the resident. The response rate to the push-to-telephone survey was 8% and for the knock-to-nudge telephone 33% (AAPOR1), compared with around 50% for the pre-Covid face-to-face approach. The questionnaire had to be adapted for telephone administration, including interviewers reading out showcard options and some wording changes (documented in the 2021-22 questionnaire), plus a slightly shortened questionnaire (c. 35 minutes) in 2020-21 only.
From 2022-23, the EHS returned to a primarily face-to-face approach, with an option for telephone interview if needed (used primarily if people were still shielding or nervous about a face-to-face interview, but accounting for very small numbers of total interviews).
At the time this research was conducted, the EHS was in the process of experimenting with alternative potential modes for the future, focusing on a mixed-mode push-to-web with face-to-face follow-up approach. As of spring 2024, this was in the testing phase, with three tests planned with increasing sample sizes (a small initial test with c.250 households, a bigger test with c.1,000 and a scaled-up test with c.20,000 households). These tests are being conducted in parallel with the main EHS, which remains face-to-face. Surveyor visits remain face-to-face, with the survey currently piloting use of tablets to replace e-pens for surveyor visits.
Key points of relevance:
- Overall similarity to SHS, SHeS or SCJS: The EHS has obvious similarities in aims, structure and additional elements (i.e. surveyor visit) to the SHS and SHCS (although unlike the SHS it does not include additional selection of a random adult to interview).
- Decision to transition: In common with other surveys, the decision to move to push-to-telephone and then knock-to-nudge was primarily determined by Covid-19 restrictions and the need to move quickly to alternative modes without interviewer contact. However, the current testing of web+F2F reflects an intention to explore alternatives in a more structured way, to future proof the survey. Telephone was not being tested as it was considered (by an expert interviewee) to be in some sense “the worst of both worlds” in that it was deemed labour intensive and expensive, but with additional limitations compared with face-to-face (e.g. limitations of use of showcards).
- Response rates: as described above, the response rate fell to 8% in 2020-21 when a wholly push-to-telephone approach was used, but was higher (33%) when combined with a knock-to-nudge approach. The technical report for 2022-23 had not yet been published at the time of writing.
- Representativeness: the Headline report for 2021-22 notes that the 2020-21 move to push-to-telephone interviewing “resulted in our sample having significantly more outright owners and fewer renters than in 2019-20 … There was also a skew toward older respondents (aged 65 or over), and fewer households with children than in 2019-20.” Similar patterns were observed in the SHS data for 2020-22, when that survey also moved to push-to-telephone/video interview.
- The 2022-23 survey (which had returned to face-to-face) was assessed as being closer to the 2019-20 sample profile than were the previous two years. However, while there were more renters in 21-22 than in 20-21, this was still not at pre-pandemic level, particularly for PRS. It is noted that it is unclear whether this reflects differential achieved sample or whether there has been real change in the profile of households over the pandemic period.[77]
- In terms of the current testing, it was suggested that the commissioners will be particularly keen to understand any impacts of web+F2F on household size, type, ethnicity, and on the representation of groups more likely to be in vulnerable positions (e.g. people who have experienced homelessness), as well as impacts on physical survey agreement to ensure that the dwelling sample remains representative. Web testing will also include assessment of any differences in drop-out points.
- Mode effects: The 2021-22 headline report notes that there were some “somewhat unexpected changes” in financial variables over the Covid period, which were attributed, in part, to respondents being less likely to give certain personal details over the phone. It was also noted that early testing of web+F2F has highlighted that whenever there is a Likert scale with a neutral middle, people online are more likely to respond neutrally, whereas in person respondents were more likely to give a substantive response. This is likely to be particularly relevant to attitudinal quesitons in each of the three Scottish Government surveys.
- Surveyor visits: The EHS has tested alternatives to this – including getting a householder to walk surveyors through their home with a phone or to film inside their home, but the consistency of the data has been problematic. At this stage, it was expected this element would need to remain fully face-to-face because “you really need an expert to go in and understand what they’re looking at because (the alternatives) just didn’t get good data” (Expert interviewee).
- Cost: it was observed that short-term, the costs associated with experimenting with new designs meant the costs had increased, but the hope is that in the longer-term efficiency savings will outweigh this.
- Admin data: alongside testing new designs, DLUHC are also testing moving to an ‘assumed consent’ model to support data matching in order to reduce the length of the survey and to improve the quality of data. The ‘assumed consent’ model involves sending out additional information with the introductory letters to explain how respondents’ data will be used, so that people can weigh this when deciding whether or not to participate in the survey. The impact of this approach on response rates and sample profile is a key issue to be tested. The scope for matching to Energy Performance Certificates, Land Registry data on leaseholder/freeholder status, and DWP data on benefits are all being explored.
Visual summary of current and previous design:
European Health Interviews Survey
Commissioner: Coordinated by the Eurostat, and delivered in each member state (Office for National Statistics (ONS) delivered the survey for all four UK health partner organisations).
Overview: EHIS is a repeated cross-sectional survey that measures sexual attitudes and lifestyles. Different countries have flexibility on the methodology, including rolling into other existing health surveys. The UK arms have historically run using telephone interviews with participants who had agreed to recontact following participation in the Labour Force Survey.
Methodology (central design): Countries participating in EHIS can decide on the data collection methodology, including face-to-face, telephone, or self-complete questionnaires, or any combination, and it can be a standalone survey, or combined with other existing surveys. The data to be collected is agreed centrally, and model questions in English designed for a face-to-face survey are provided to support data collection.
Countries are encouraged to use face-to-face modes if possible. Details of the mode used are included in the survey metadata for each case, which can be considered in analysis. However, no specific approaches to adjusting results based on mode of data collection are used as standard or recommended.
Countries are encouraged to select a sample frame that represents the population, and to use probability sampling and stratification where possible, but no specific restrictions on sampling are provided.
Methodology (UK waves): For the UK waves, households who participated in the ONS Labour Force Survey and agreed to be recontacted were sampled for the ONS’s Health and Lifestyle Survey which, in the relevant periods, included the agreed EHIS questions. Every member of the household aged 15+ was eligible to participate. Households were invited by telephone, using numbers collected during the Labour Force Survey interview, with EHIS interviews taking past via telephone. Data collection is spread over the year.
Scotland north of the Caledonian Canal and the Scilly Islands are excluded from the United Kingdom data, which represents about 5% of the population of Scotland. This reflects issues with face-to-face data collection coverage on the Labour Force Survey (for more details, see the Labour Force Survey case study).
Visual summary of current design
Key points of relevance:
- Biomeasures: EHIS has historically collected height and weight measures based on self-reported height and weight, which has been used to compare determinants of health between countries. This has included calculation of BMI. Instructions are provided for participants to describe their height without shoes, and their weight without clothes or shoes (and, for pregnant participants, prior to their current pregnancy). Participants are able to provide an estimate where they are not able to provide exact figures. Interviewers are not asked to measure participants, even where face-to-face modes are used.
- Use of follow-up surveys: In the UK, EHIS has been conducted as a follow-up to the Labour Force Survey. This allowed for a cost-effective approach to data collection, by following up a robust face-to-face survey for initial recruitment, and then the cheaper telephone mode for an additional survey.
European Social Survey
Survey name: European Social Survey (ESS)
Commissioner: Funded by participating countries in the ESS. All participating countries are required to contribute to the central coordination costs, composed of a basic membership fee and an additional amount, calculated according to the GDP of each country. In addition, each country covers the cost of fieldwork and national coordination. The UK’s participation in the ESS is funded by the ESRC. The ESS is governed by a General Assembly which appoints the Director, Professor Rory Fitzgerald. The Director leads the team at ESS ERIC Headquarters, which is based at City, University of London.
Overview: Cross-national cross-sectional survey, carried out across Europe every two years since 2002. Traditionally a single-mode face-to-face survey. Topics include social trust, politics, values and wellbeing.
Methodology
The European Social Survey is a repeated cross-sectional academically-driven survey, conducted every two years across 30+ European countries.
In the UK, the survey population is individuals aged 15+ and the sample frame is PAF. The sample is drawn using a multi-stage random probability method, clustering within postcode sectors. A household member is selected at random on the doorstep, using the contact form for face-to-face interviews. For self-completion, an instruction on the letter requests that the person with the next birthday aged 15+ in the household completes the survey. This approach for within-household selection is under review. There is initial evidence of only minor impact on sample composition and data quality metrics from incorrect selections following the instruction on the letter.
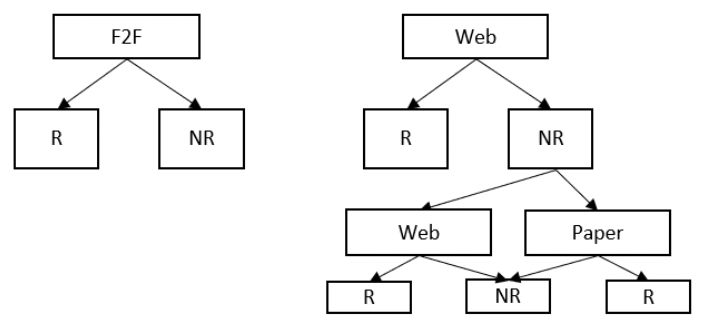
ESS was a face-to-face survey until round 10 in 2020, when a mode switch in response to the pandemic was carried out to incorporate web, paper and video interviewing. In the UK, a mixed mode design was implemented, using a combination of face-to-face interviewing and video interviewing via MS Teams. Of the 1,094 UK interviews achieved in round 10 (20.9% AAPOR1 response rate), 55 were conducted via video interview. A self-completion approach was carried out by nine countries at round 10. Of the countries implementing a self-completion approach, most used a sequential push-to-web design, typically including the paper questionnaire in the second mailing.
In round 11, the vast majority of countries returned to face-to-face interviewing. The next round, round 12, will start in late 2025, and will comprise a parallel run, whereby half the interviews in each country will take place face-to-face and half will take place via self-completion (web or paper). Approximately 1,500 UK interviews are achieved per round, so the target for round 12 is 800 face-to-face interviews and 800 self-completion. The mode will be randomly allocated at the sampling stage, either within or between probability sampling units. For countries using address-based samples, including the UK, fieldworkers will carry out knock-to-nudge for nonresponders following the postal mailing phase. The parallel run will allow direct mode comparisons to be made. From Round 13 (2027) ESS will take an entirely self-completion (web and paper) approach across all participating countries.
The survey is around 55 minutes long, comprising core questions asked every round, and rotating modules. The questionnaire has relatively straightforward routing, which enables the switch in mode to a paper questionnaire. An experiment was conducted in Austria to compare self-completion response rates using a 35-minute version of the survey, removing the rotating modules, and a 50-minute version, almost the full ESS questionnaire (Hanson and Fitzgerald, 2022). The resulting response rates and sample compositions were comparable between survey lengths, and thus the decision was made to proceed with the full questionnaire when using self-completion modes.
Significant methodological work has been conducted on ESS (Villar & Fitzgerald, 2017). Of particular relevance to mixed mode in UK, a push-to-web experiment in 2012 found the response rate when using a web then face-to-face design was significantly lower than the response rate when using the face-to-face only design (39% vs 53% respectively). The mixed mode sample also showed greater bias, underrepresenting respondents from the youngest and oldest age groups and overrepresenting people looking after the home or family. Drawing on the findings from six ESS methodological studies, Villar and Fitzgerald (2017) concluded that when compared with face-to-face designs, mixed mode is unlikely to increase response rates or decrease nonresponse bias in estimates.
However, since 2017, a shift to a self-completion design has been recommended. This reflects encouraging evidence from ESS and other surveys on the effectiveness of a self-completion approach. For example, most ESS countries that have used the self-completion approach so far have achieved response rates between 30% and 40%. A push-to-web self-completion parallel run was carried out in the UK at the time of Round 10 in 2021. The self-completion version of the survey achieved a 43% response rate, compared to 21% for the face-to-face survey, with a long survey (median = 47 minutes). Other features of the design that may have helped improve the web response rate included:
- £5 cash as an unconditional incentive in the invitation letter
- a £10 cash conditional incentive (in addition to the unconditional cash incentive
- A survey ‘re-launch’ phase, whereby another invitation letter was sent which included an unconditional £5 gift card
- A relatively long fieldwork period at around 15 weeks
- The survey was a general attitudes survey branded as “Living in Britain” and university-sponsored (City, University of London) so of relatively high interest/legitimacy.
Further work is ongoing to assess sample composition, the impact of each mailing on response, the impact of conditional incentives on sample composition and data quality, comparison of self-completion and face-to-face datasets, accuracy of person selection, measurement differences between face-to-face and self-completion, and differences in break-off rates and data quality by device used to complete the survey (see Hanson, undated).
The parallel run in other countries at round 12 is designed to further understand the mode differences.
Visual summary of previous and current mode
Key points of relevance:
- Overall similarity to SHS, SHeS or SCJS: Similar to the Scottish Government surveys, European Social Survey is a cross-sectional general population survey, which uses PAF as a sample frame in UK and has traditionally been carried out face-to-face. Like SHS and SCJS, ESS has the challenge of within-household selection without a named sample. While the survey is long (approx. 55 minutes) and covers a wide range of topics, it is less complex in terms of routing than the Scottish Government surveys, and there are no additional data collection elements, as in SHS or SHeS.
- Decision to transition: From 2027, ESS will be a self-completion (web and paper) survey. Significant methodological work has been carried out to enable this transition, testing survey lengths, sample profiles and response rates. At the next round in 2025, the parallel run to carry out face-to-face alongside self-completion modes will enable the testing of mode effects before the survey transitions to self-completion only.
Food and You 2 (formerly Food and You)
Commissioner: Food Standards Agency (FSA)
Overview: The Food Standard Agency's flagship survey that measures people’s self-reported knowledge, attitudes and behaviour relating to food safety and other food-related behaviours. A repeated cross-sectional survey in England, Wales and Northern Ireland that uses a push-to-web (web + paper) approach.
Methodology: Food and You began in 2010 as a repeated cross-sectional single mode face-to-face survey. It was carried out every other year, until its fifth and final wave in 2018.
The survey population comprised all adults aged 16+ in England, Wales, and Northern Ireland. The sample was drawn from PAF using a multi-stage random probability design, with one adult per household selected for interview via a Kish grid.
Approximately 3,000 interviews were achieved per wave, with a response rate of 48.2% (AAPOR1) achieved in Wave 5 (2018). The questionnaire took on average 40 minutes (in England and Wales) or 55 minutes (in Northern Ireland) to complete. An unconditional £10 Post Office Payout was included in the advance letter as an incentive.
Food and You 2 is the successor survey to Food and You. It began in 2020 and is ongoing. It is a repeated cross-sectional push-to-web survey, using a delayed concurrent mixed-mode design, with web in phase 1, and web and paper in phase 2. It is carried out twice a year.
As with Food and You, the survey population comprises all adults aged 16+ in England, Wales, and Northern Ireland. The sample is drawn from PAF using a systematic random sample of addresses. Up to two adults per household (any two) can take part.
Approximately 4,000 interviews are achieved per wave, with a household-level response rate of 29.1% (AAPOR1) achieved in Wave 6 (2022/23), which equates to 31.6% (AAPOR3) when assumed ineligibles are excluded. The questionnaire takes on average 26 minutes to complete. A conditional £10 shopping voucher is provided to all individuals completing the interview. Most responses (64%) are by web, with the remaining 36% by paper.
Visual summary of previous and current mode
Key points of relevance:
- Overall similarity to SHS, SHeS or SCJS: The previous design of Food and You was broadly similar to the three SG surveys (PAF sample, CAPI survey). Selection of a single random adult per household is similar to the SCJS. However, the survey differs substantially in topic from any of the three SG surveys (though there is likely to be some overlap with/relevance to SHeS) and does not have any additional data collection elements, like SHS or SHeS.
- Decision to transition: The recommendation to transition the survey from face-to-face (Food and You) to push-to-web (Food and You 2) was made by a Working Group established by the FSA’s Advisory Committee for Social Science[78]. The Working Group drew on a range of evidence sources in making their recommendations, including consultation with FSA staff and external stakeholders, and a review of the methodological literature. The Working Group recommended the mode change in line with the Government’s Data Collection Transformation Programme, which states that ‘non-online methods [should] only be used where there is an exceptional reason to do so’[79]. The Working Group further made the points that i) a push-to-web approach could be expected to reduce the per-interview cost from around £130 to around £30, providing the opportunity to increase the sample size[80], and ii) a push-to-web approach could be expected to reduce the potential for social desirability bias to skew survey estimates. The Working Group acknowledged that the change in survey mode i) could jeopardise the continuation of the existing time series, ii) would necessitate a shorter questionnaire, and iii) would lower the response rate and increase the possibility of non-response bias.
- Time series: After Food and You 2 was established, researchers at the FSA published a blog about the new methodology in the Social Research Association Blog[48]. With respect to the time series, they wrote that “The change in methodology has allowed us to future proof the Food and You survey, but has also meant that there is a break in the data time-series, and findings between Food and You 2 and Food and You 1 are not directly comparable. Whilst we could have investigated the impact of changing mode, for instance by doing a parallel run of face-to-face and online fieldwork, we decided not to go down that route due to the associated cost of this additional fieldwork and the limited existing time series”.
- Paper questionnaire: Due to the length and complexity of the Food and You 2 survey, the paper questionnaire includes only key questionnaire items, and comprises two versions with some modularisation of content between them. This has implications both for the amount of data gathered by paper, and for the calculation of survey weights.
GP Patient Survey
Survey name: GP Patient Survey
Commissioner: NHS England (NHSE)
Overview: Large sequential push-to-web survey, with paper follow-up mode, of experience of English primary care. The survey measures experience per GP practice, sampling from registration records.
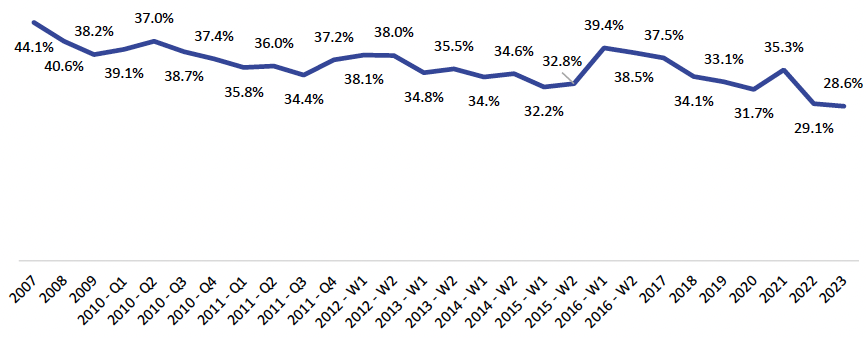
Methodology: The GP Patient Survey (GPPS) has been running since 2007. The survey is currently delivered annually, but was delivered four times a year in 2010 and 2011, and twice a year between 2012 and 2016. Over time, response rates have generally decreased, with specific exceptions – for example, response increased following the introduction of an additional postcard reminder in 2016, and during lockdown during the COVID-19 pandemic in 2021. The length of the survey has also increased over time. It was originally 13 questions over a two-sided questionnaire, but by the 2023 survey, comprised 63 questions over eight pages.
The survey is very large scale, to allow analysis of experience for every GP Practice in England, meaning around 750,000 responses are collected per wave. The sample is selected using GP registration records, as provided by NHS England, to identify patients who are aged 16+ and have been registered with their English GP practice for more than six months (the eligible population). To ensure a set sample size per GP practice and Primary Care Network (selection of practices), the number needed per practice is selected, based on previous response rate. For example, a practice with a high response rate would have fewer patients selected than a practice with a lower response rate, regardless of practice list size. The sample is stratified by age, gender, and local area, within practices, before the sample is selected. The final results then receive a selection weight, as well as non-response and calibration weights, to ensure they are representative of all patients registered with GP practices.
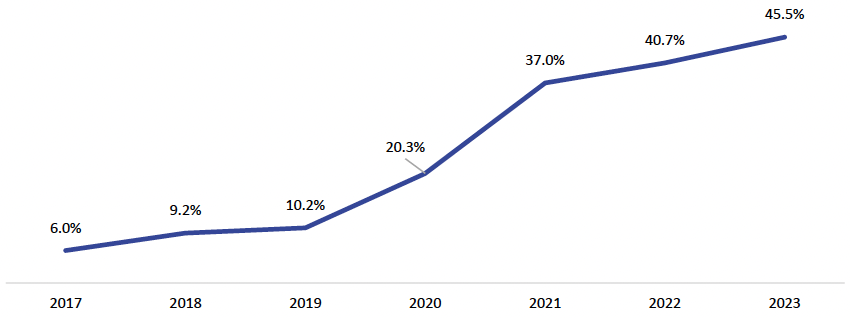
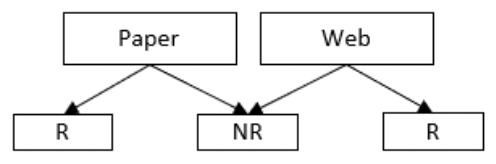
GPPS started as a simultaneous push-to-web survey, also known as concurrent mixed mode. Participants were sent a paper questionnaire in the post, with log-in details that could be used to complete the survey online, along with up to two letter reminders which also included paper questionnaires. An additional postcard mailing one week after the first letter was introduced in 2016, after experimentation alongside the 2015 waves of the survey showed it boosted response rates and improved unweighted non-response bias, without impacting weighted results. However, up to 2017, uptake of the online survey was low, with only 6% responding to the online survey. Changes to materials, emphasising the benefits of going online and making the log-in details clearer, increased the online uptake to 20.3% in 2020. The replacement of the postcard with SMS reminders after each mailing in 2021 increased the proportion of responses received online further, to 37.0%. This has continued to increase year-on-year, partly reflecting social comfort taking part in surveys online, and partly an increase in the proportion of patients in the sample with a mobile number, meaning a larger proportion of the sample is receiving an SMS reminder.
For the 2024 survey, based on experimentation, the survey has moved to a sequential push-to-web, or delayed mixed mode approach, where the paper questionnaire has been removed from the first two mailings. The first reminder letter has also been replaced with an e-letter, sent via a link in an SMS, for those with a usable mobile number. Those without a usable mobile number receive a letter, as in previous waves. Experiments on the 2023 survey showed this resulted in a comparable response rate, and similar demographic profile, while drastically reducing outward postage costs, and increasing the proportion responding online to around 80%, improving data completeness and reducing scanning and return postage costs. However, question responses were different. In particular, responses to experience questions were more negative, and there was an increase in the proportion reporting use of online services, suggesting mode effects. As a result, the decision was made to break with trends for the 2024 survey, and the questionnaire was redesigned to more accurately reflect changes in the way primary care is delivered, since the last questionnaire redesign in 2017.
Visual summary of current and previous design
Key points of relevance:
- Use of administrative records as sample frame: By using administrative records, it is possible to identify eligible patients, match them to age, gender, and GP practice, improving sampling design and analytical possibilities. Selection can also take place at an individual level, reducing the need for complex within household selection, which is more challenging in a push-to-web design. The sample frame also includes both postal addresses and mobile phone numbers, allowing for multiple contact methods, and the possibility to include names in contact messages, which can help legitimise the survey.
- Scale: By using a push-to-web approach, it is possible to conduct a very large survey of around 750,000 people per wave, over a three-month fieldwork window. This allows for greater granularity of analysis by local area and GP Practice, as well as detailed demographic analysis for small incidence populations and intersectional sub-groups.
- Mode effects and trends: Although the change from concurrent to delayed concurrent mixed mode, using the same modes, is relatively small, the impact it had on responses, even when observed demographic profiles did not change, is worth noting. Although the changes were relatively small, due to the scale of the survey, they were statistically significant, and led to a decision to break trends.
Health Survey for England (HSE)
Commissioner: NHS England (formerly NHS Digital)
Overview: The Health Survey for England is a repeated cross-sectional survey of households in England, covering all ages, monitoring health. Until 2019, the HSE was a single mode, face-to-face design. In 2021, the survey had to change design due to the Covid-19 pandemic, to a concurrent mixed-mode design using telephone and video modes. In 2022, the study returned to face-to-face (with a telephone option). Other design options are currently being considered. The Health and Social Care Statistics Leadership Forum commissioned a joint public consultation[81] (open for responses between 12th December 2023 and 5th March 2024) on health and social care statistical outputs produced by organisations including NHS England. The consultation states that NHS England is considering options for the future of the Health Survey for England, including changing the survey mode from face to face, to either online or a combination of online and telephone (with nurse visits still carried out face to face). NHS England is also proposing changing the frequency of the survey, from running annually, to bi-annually.
Methodology: The HSE uses a multi-stage stratified probability sampling design. The sampling frame is the PAF. All adults per household are interviewed (up to 10), plus up to two children aged 0-12 and up to two aged 13-15. Some survey years include boosts of certain population subgroups (e.g. ethnic minorities, older people, or children).
1994 - March 2020: The Health Survey for England began in 1994. The survey was carried out face-to-face until the end of March 2020. Younger respondents answered a self-complete section: 8–15-year-olds answered it by paper and CASI was used for 16-17 year olds. Proxy parent or carer responses were used for children aged 0-12. In terms of bio-measures, blood pressure, height and weight were measured by interviewers and blood and saliva samples were also collected through a nurse visit.
Feasibility study, 2020:[82] A feasibility study was carried out, examining the suitability of transferring key HSE content from face-to-face interviewing to self-completion modes. The content mirrored that in the HSE for the purposes of making comparisons between the modes. It used a delayed concurrent mixed mode design, with web in Phase 1 and paper in Phase 2.
2021: Due to the Covid-19 pandemic and associated restrictions on face-to-face contact, the HSE transitioned to a concurrent mixed-mode design, using telephone and video modes. An opt-in only approach was used for the first quarter of fieldwork (January – March 2021) with residents asked to make contact with the contractor for a telephone interview[83]. From April 2021, interviewers made doorstep visits using knock-to-nudge to obtain telephone interviews. Video interviewing was trialled from January – April 2021, but was discontinued due to low uptake. All respondents aged 8+ were also sent an additional self-complete paper questionnaire with further questions to complete and return by post.
In terms of bio-measures, respondents provided their own height and weight measurements in the first part of 2021, when face-to-face contact was not possible. In addition, 89% of responding households were randomly invited to have a nurse visit, with nurse visits resuming in October 2021. These visits included further questions, measurements, collection of blood samples from adults aged 16 and over, urine samples from those aged 35 and over, and saliva samples from adults and children aged 4 and over[83].
2022: The survey mostly returned to pre-pandemic methods. Interviews were carried out face-to-face, with an additional telephone option (19% of interviews were conducted by telephone)[84]. Paper self-completions were completed during the interview or returned via post. All households were eligible for a biomedical fieldworker visit, compared with previous years when only a subset of addresses were eligible. For face-to-face interviews, height and weight measurements were taken by interviewers or biomedical fieldworkers, and in telephone interviews the measurements were self-reported.
Response rates: In 2019 (pre-Covid), the household level response rate to the survey was 60% (AAPOR1)[85]. In 2021, with the revised design, the household level response rate dropped significantly to 32% (AAPOR1)[83]. The lower response rates in 2021 and the subsequent lower achieved sample size meant that the capacity for analytical breakdown of the data was limited. Response rates in 2021 particularly varied by region, type of dwelling (response rates were highest among households living in detached houses (53%) and lowest among households in converted flats or maisonettes (31%)); and sex (women were over-represented relative to men – 54% and 46% respectively, compared with a 50%-50% split in the mid-year population estimates,[85] although methods reports from previous years of the HSE also show similar trends in women being over-represented compared to men). Calibration weighting is used to mitigate the challenges related to representativeness.
In 2022, despite returning largely to pre-pandemic methods, the household response rate only increased from 32% to 36%. Women remained overrepresented compared to men (55% and 45% respectively, compared with 49% of men and 51% of women in the mid-year population estimates)[84]. Regarding age, men aged under 55 and women under 35 were under-represented, while both men and women aged 55 and over were over-represented.
Current design: The survey has returned to a face-to-face design (with a telephone option) since having to change during the Covid-19 pandemic. However other mode designs (specifically, online, or online and telephone) are under consideration, with results of a user consultation on changing the mode and/or frequency of the HSE being analysed at the time of writing (September 2024).
Key points of relevance:
- Overall similarity to SHS, SHeS or SCJS: HSE is of obvious direct relevance to SHeS in terms of topics, purpose and the data collected (survey + self-completion element + biomeasures).
- Decision to transition: Prior to the pandemic, NHS Digital were exploring the feasibility of altering the mode design. Data collection has currently reverted to face-to-face, but other mode options are being considered.
- Survey length: In terms of the decision to move to telephone rather than a push-to-web design during the pandemic, survey length was a contributing factor. With the HSE being a relatively long survey, it was felt that interviewer guidance and support was important for participants. The commissioner noted that a significant amount of time had to be invested in redesigning the survey, including adapting the questions given that showcards were not used in telephone interviews.
- Question response patterns and accuracy: There were differences in how people responded to some questions in 2021, with less detailed answers being provided. Weight and obesity measures were self-reported, and it is known from previous work that people are not as accurate when submitting these measures themselves. An adjustment method was used to mitigate this, however ultimately the data will be labelled as inconsistent with 2019. On some questions, it was difficult to disentangle whether changes in response were due to the pandemic changing people’s behaviour, or mode effects.
- Representativeness and non-response: The commissioner interviewed shared that one of the contributing factors in the decision not to move to a web survey in 2021 was the desire to maintain representation across ages, and concerns from other surveys that web completion among young people would be low. Additionally, it was considered important that older people, with particular health challenges, would be sufficiently represented and the concern was that response rates among this group may drop if the survey moved to a web-based design. Ultimately, in changing design in 2021, there was a significant drop in response rates to the survey, and also in agreement to a nurse’s visit. However, it is difficult to know how much the latter may have been connected to residual discomfort in having a home visitor, due to the pandemic. Despite returning to a face-to-face design in 2022, response rates only improved by a few percentage points.
- Trends and time series: The time series is highly important to HSE users and the survey’s core purpose, of measuring trends in health. Given the mode transition during 2021, users are cautioned (through a note on the dataset and in associated publications such as technical reports) that the data is not directly comparable to previous years.
- Admin data: The commissioner noted that a challenge associated with using the PAF as a sample frame is that the makeup of the household is unknown. The commissioner would like to explore using the NHS patient register as a sampling frame to facilitate a more targeted sampling approach, taking into account previous sub-group level response rates.
Visual summary of previous and current design
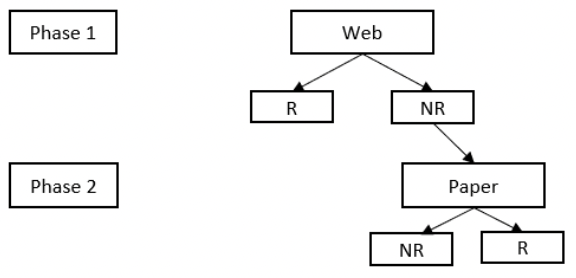
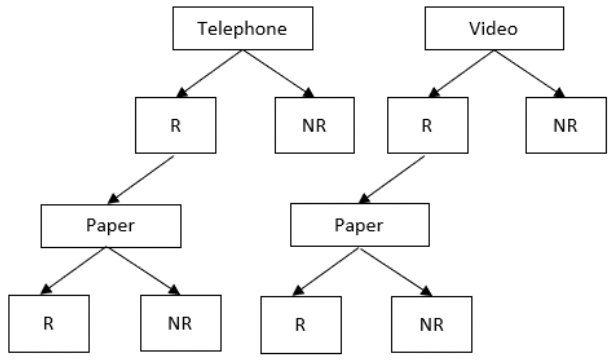
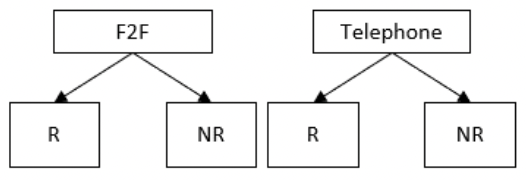
National Survey for Wales (NSW)
Commissioner: Welsh Government
Overview: The National Survey for Wales is a continuous, repeat cross-sectional survey of adults aged 16 and over in Wales, for the Welsh Government and its partner organisations. It runs year-round, and covers a variety of topics such as health, childcare, volunteering, sports, transport, and wellbeing. Having been a face-to-face survey prior to 2020, it now has a mixed mode design, combining a push to telephone main survey plus online self-completion element, with a face-to-face follow-up of non-responders.
Methodology:
2012 - March 2020: The National Survey for Wales began in 2012. In 2016 it was expanded, combining five large-scale Welsh social surveys into one including the Welsh Health Survey, Active Adults Survey, Arts in Wales Survey, Welsh Outdoor Recreation Survey, and the pre-existing National Survey. The survey was carried out face-to-face with a CAPI/CASI design until March 2020, when it was forced to transition due to the Covid-19 pandemic and associated restrictions on face-to-face contact.
March-Dec 2020: A telephone recontact survey (with people who had previously taking part in the face-to-face NSW) was carried out for the rest of 2020.
2021- March 2023: From the start of 2021, the survey moved to a push-to-telephone approach with fresh sample: invitations were sent by post, requesting a phone number be provided via an online portal, telephone enquiry line, or direct to the interviewers’ mobiles. A ‘knock to nudge’ element was also added, to follow-up non-responders and obtain a phone number to conduct the CATI survey.
From July 2021 – end of 2021, the survey tested adding an additional online section at the end of the survey (i.e. a web-based survey completed after the CATI interviews). This was successful, and subsequently the online section was expanded to the whole sample in 2022-23 (respondents without internet were offered the ‘online’ questions over the telephone). A conditional incentive was used, with respondents having to complete both sections in order to receive a £15 shopping voucher.
2023 - 24: The survey was re-tendered in March 2023. The new contract maintains a similar push-to-telephone + web-based self-completion interview design; however, the knock-to-nudge element has been replaced with interviewers carrying out CAPI/CASI interviews face-to-face with those who do not opt in to the telephone survey. Data and technical reports are yet to be published.
Visual summaries of the previous and current designs
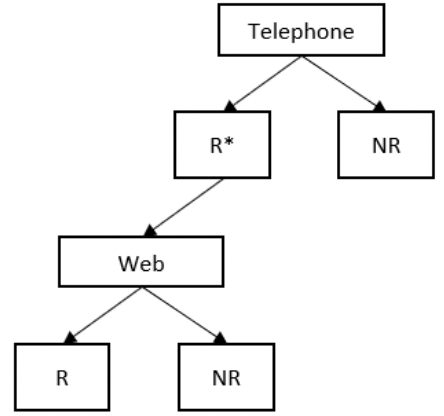
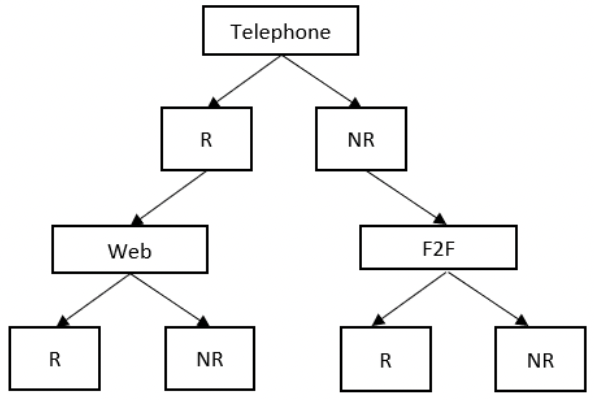
Since 2016, the NSW target achieved sample has been around 12,000 interviews annually; in 2022-23, 11,140 telephone (full and partial) interviews were completed[86]. The 2022-23 response rate was 38.3%[86] (AAPOR2). Refusals were 38.4% of eligible sample, and non-contacts 23.4% of eligible sample. The online self-complete section had a net response rate of 32.4% (84.6% of those doing the telephone questionnaire completed the online questionnaire). The commissioner reports that around 20-25% opted-in and shared a phone number without a visit. Other addresses did not opt-in until an interviewer had made a visit.
The survey follows a modular structure, with the main survey consisting of over 50 main modules - some of which are asked only of sub-samples. The online survey consists of 7 main modules. The median length of the full survey (including telephone interview and web section) in 2022-23 was 37 minutes.
Key points of relevance:
- Overall similarity to SHS, SHeS or SCJS: The topics in the NSW are similar to some of those included in the SHS, such as culture, childcare, volunteering, environment and internet use. NSW also includes questions about health and health-related behaviours, as in the SHeS. A Welsh Housing Condition survey has periodically been carried out, with NSW respondents being asked if they would like to participate in this (as a separate exercise). The Housing Condition survey was last conducted pre-pandemic, in 2017-18, and no decision has yet been taken on how this will be conducted in future.
- Decision to transition: prior to the pandemic, the Welsh Government were not particularly planning on changing the survey mode: “certainly not at the pace we did; it was driven by the pandemic.” However, having made the change, they commissioned a review of options which led to the decision to combine push-to-telephone with face-to-face follow-up of non-responders.[87] A key reason for choosing a push-to-telephone rather than a push-to-web approach was to minimise gaps in data collection and allow some comparability of results with the 2020-23 approach. There was also a focus on inclusiveness and a concern to ensure that people who are less literate can participate: “These are among the groups that we want our policies to be helping, so we need to have a survey design that makes sure they can take part as easily as possible.” Another factor was the desire to retain interviewer support for certain questions that benefit from having an interviewer to guide respondents through them. Random selection of a single respondent within each household was also seen as more difficult with a web-first approach.
- Cost: The commissioner indicated that while moving to a mixed mode design had enabled them to keep the costs within budget, it had not been radically cheaper because of the investment in face-to-face follow-up to ensure a good response. In terms of resources to manage the survey, it was noted that the mixed mode design was more work to implement the questionnaire and manage fieldwork, “because it’s running in different modes and there’s a lot more to keep an eye on.”
- Representativeness and non-response: The move to push-to-telephone lowered the overall response rate from 55.7% (pre-Covid), to 38.2% in 2022-23[87], which is mainly attributable to a large increase in non-contact rate. There are some differences in the sample profile with the new design compared to the previous face-to-face only design. In particular, those who have proved more difficult to include are people who are: younger; less qualified; ethnic minorities; those with poorer health, and renters. While using a Knock-to-Nudge approach helped reduce the differences in sample composition for 2021-22 and 2022-23 compared with pre-pandemic (2019-20), significant differences remain (e.g. there are still more owner-occupiers and fewer people with lower/no qualifications, compared with 2019-20).[88]
- Survey length: The survey was initially cut back quite radically in 2020, from 45 minutes to 25 minutes. However, the telephone element has increased since to around 30-35 minutes. The web section (an additional 10-15 minutes) also allowed inclusion of more questions overall than it was felt have been possible via CATI only.
- Question response patterns: A significant amount of work was done to adapt questions so that they could be more easily understood over the phone, particularly as this necessitated removing showcards. There was a belief that a number of questions may have been improved during the transition, given the lower reliance on showcards (which cause issues for respondents who are less literate, and respondents who are time-pressed and may skim them). In terms of sensitive topics, one of the drivers for adding an online module was to minimise social desirability effects for these questions.
- Trends and time series: Across the mode changes, the commissioners have done as much as possible to maintain comparability over time. However, they have taken the view that there will be some difficulties in comparing results due to the significant change in methods – this is highlighted in technical reports, which advise caution over time series comparisons. At the same time, results for a lot of measures have remained similar across the different mode changes, so there was a perception that the mode effects are not so great that all time series comparison should be ruled out. One of the reasons given for changing to CATI was that it is still interviewer-led and so there was a sense that measures wouldn’t necessarily change significantly compared with when they were asked by CAPI.
- Admin data: For a number of years, responses have been linked to other datasets, based on the powers of the Welsh Government to link data (though respondents can opt out). This is handled by SAIL Databank at Swansea University which contains a range of datasets, many health-related.
National Survey of Sexual Attitudes and Lifestyles (Natsal)
Commissioner: Natsal consortium (UCL, LSHTM, University of Glasgow, the National Centre for Social Research) funded by Wellcome Trust, with contributions from ESRC and NIHR
Overview: Natsal is a repeated cross-sectional survey that measures sexual attitudes and lifestyles. The survey moved from face-to-face to online-panel during the COVID-19 pandemic, and for the latest wave is running a combined approach, using three different recruitment channels, covering face-to-face, random probability panel (telephone with shorter online survey for non-responders), and opt-in online panel.
Methodolog y (Natsal-1 to Natsal-3): Historically, Natsal has been an exclusively face-to-face, random probability survey, with waves run in 1990-1991, 1999-2001, and 2020-2012. Probability sampling units were first selected, to cluster interviews and improve interviewer efficiency. Then within each probability sampling unit, addresses were randomly selected, and then an eligible adult living within each household was randomly selected. Although the methodologies were generally consistent between waves, some methodological changes were introduced.
Age requirements: Different waves of the survey had different age criteria, to meet changing data needs. Natsal-1 surveyed 18,876 people aged 16-59, Natsal-2 surveyed 12,110 people aged 16-44, and Natsal-3 surveyed 15,162 adults aged 16-74.
Mode of self-complete section: Due to the sensitivity of the topic, there was a requirement that some sections be completed by the participant without interviewer assistance. This was to reduce social desirability bias. In Natsal-1, this self-complete section was completed on pen and paper. From Natsal-2 onwards, this was done using a computer assisted self-interview (CASI) on the interviewer’s laptop.
Boosts: Natsal-2 boosted households in greater London, as it had been found in Natsal-1 that this population was more likely to describe behaviour that increased the risk of HIV (e.g. “risky” sexual behaviour, IV drug use). Natsal-2 also boosted by some ethnic minority groups. An additional sample was selected prioritising areas with larger populations of the target ethnic groups (Black African, Black Caribbean, Indian and Pakistani), and sampled addresses from these areas were then screened by interviewers to ensure participation from the target ethnic groups in this additional sample. Natsal-3 used the same approach to boost for young people (with half the boost group screening for 16-34 and the other half screening for 16-29).
Biosamples: Biosamples were requested by the interviewer during the face-to-face interview, to be used for laboratory testing. For Natsal-2, half of participants aged 18-44, except those without any sexual experience, were eligible to provide a urine sample, which was tested for Chlamydia. For Natsal-3, all 16 and 17 year olds (to avoid communicating their sexual history), all 18-24 year olds who had had at least one sexual partner, all men aged 25-44 who had had sex with a man in the last five years, and a randomly selected sample of the remaining participants aged 25-44 who had had at least one sexual partner were invited to provide a urine sample. Urine samples were tested for Chlamydia, Gonorrhoea, HPV, HIV antibody, and MG. Saliva samples were also requested of a random sample of participants, except those who regularly worked at night, with a skew towards participants over 35, to test for salivary testosterone. For Natsal-2, those with positive test results were contacted by a nurse, while for Natsal-3 biosampling results were not shared with participants.
Non-responder follow-up: For Natsal-3, non-responders who provided an email address were sent a shortened web version of the questionnaire. However, as very few were eligible (174 were invited using this approach), and even fewer completed (25), and there would be mode differences, including due to the shorter questionnaire, it was agreed not to include these responders within the results of the study.
Incentives: For Natsal-2, all general population participants received a £5 gift voucher, while those from the ethnic minority boost received £10. For Natsal-3, this was increased to a £15 gift voucher for all participants, along with an additional £5 each for those providing urine or saliva samples.
Response rates stayed high for the study, with part of the decrease in Natsal-3 associated with the inclusion of older people, who were less likely to participate in the study, due to the topic. Using the CASRO method, Natsal-1 achieved a response rate of 66.8%, Natsal-2 achieving 65.4% when weighted to adjust for the boost in London (with 70.1% of those invited providing a urine sample). The ethnic minority boost in Natsal 2 achieved a 62.9% using the CASRO method. Using the AAPOR’s formula for calculating RR3, Natsal-3 achieved an overall response rate of 57.7% (60.5% using the CASRO method). Of those invited to, 60.0% provided a urine sample, and 50.1% provided a saliva sample.
Methodology ( Natsal COVID): During the pandemic, where face-to-face fieldwork was not possible, two particular pandemic-focussed waves of the survey were conducted using an online opt-in panel. The questions were designed to measure the impact of the pandemic and lockdown on people’s sexual behaviour and sexual and romantic relationships.
Participants were recruited using a quota-based sampling approach from an online opt-in panel. The first wave, in July 2020, recruited 6,657 people aged 18-59, and the second wave, in March/April 2021, recruited 6,625 people aged 18-59. Wave 2 included around 2,000 participants who had taken part in wave 1, to allow for longitudinal analysis. Both waves included a boost sample of those aged 18-29. Quotas used ONS data on gender, age, region, and social grade. Those taking part in the longitudinal element were included regardless of whether the relevant quotas were met.
Methodology ( Natsal-4): Natsal-4 was originally intended to run using similar protocols to Natsal-3, covering the 16-59 age group but still including the young person boost. However, fieldwork was delayed due to the COVID-19 pandemic. While Natsal COVID continued, remote data options were considered, including remote self-administration (push-to-web), remote interviewer administration (push-to-telephone/video), and in-person with remote options (where face-to-face interviewers could offer telephone and/or video modes to those concerned about in-home interviewing). The in-person with remote options design was also piloted
Natsal-4 fieldwork began in September 2022, with the traditional face-to-face survey as the primary mode of data collection, and the interviewers having the option to offer a remote (telephone, with nested online self-completion) interview where participants preferred. However, challenges to face-to-face interviewing were seen across surveys post-pandemic, including fieldwork capacity, loss of experienced fieldworkers from the workforce, and a general decline in people’s willingness to take part in surveys. These challenges greatly impacted Natsal-4’s response rates. Therefore, a decision was made to move to a three-strand approach.
Alongside the initial face-to-face wave, the survey was also conducted using telephone interviewers via a random probability panel (i.e. a research panel of participants who were recruited using a random probability approach). For those who did not respond to the telephone survey, a shorter 25-minute version of the survey (compared with 60 minutes for the full survey) was sent via email. As the panel only recruited those aged 18 or over, the panel respondents were restricted to age 18-59, but with no additional boosts. Finally, a third wave was recruited using the same approach as the Natsal COVID studies, where a quota sample was recruited from an online opt-in panel. This included a boost for young people, and those from particular ethnic minority groups. This third wave used the same 25-minute shortened version of the questionnaire. All three strands included requests for data linkage, and for eligible respondents to provide either a vaginal swab (if identified as cis-female) or urine samples (if identified as cis-male, trans, or non-binary). For those participating remotely, those consenting were sent kits in the posts, for participants to collect the samples and return them. Additional gift vouchers were sent to those providing biosamples.
For additional data analysis, funding has been dedicated to triangulate the data, and understand where the modes differ in terms of demographics, question response, and administrative and biosample data. This work is ongoing.
Visual summary of previous and current mode designs
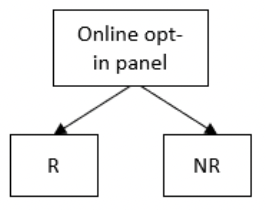
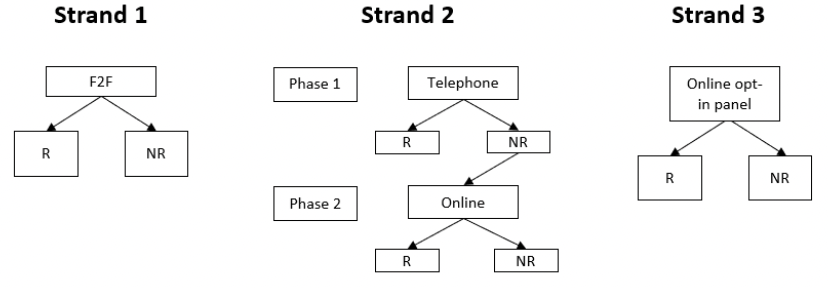
Key points of relevance:
- Biosamples: Natsal collects a variety of biosamples, both face-to-face and using the remote modes. The impact of the mode on the quality of the biosamples collected will be analysed as part of data releases for Natsal-4.
- Use of non-probability samples in combination with probability samples: There is increasing discussion about the use of non-probability samples in combination with probability samples – especially where this can be used to boost low-responding and low-incidence groups. The approach to this will be analysed as part of Natsal-4, and this will feed into a strand of work within the ESRC-funded Survey Futures project exploring approaches to combining probability and non-probability data.
National Travel Survey (NTS)
Commissioner: UK Government Department for Transport
Summary: The National Travel Survey (NTS) has been running since 1988 as a continuous survey (following ad hoc surveys from the 1960s onwards). It is a household survey, designed to monitor long-term trends in personal travel and inform policy development. It covers England only, and collects data on how, why, when and where people travel via a seven-day travel diary completed by households.
Methodology: Prior to 2020, the NTS involved an interviewer calling face-to-face at sampled households (based on a probability sample of addresses from PAF, conducting a face-to-face interview with every household member, and placing a seven-day pen and paper travel diary with each household member, which they then returned to collect at the end of the seven-day period. In 2019, a household-level response rate of 54% was achieved (AAPOR3)[89].
During the Covid-19 pandemic, the survey initially pivoted to a push-to-telephone design, with advance letters inviting households to opt in by calling a freephone number, emailing, or leaving contact details through an online portal. £20 conditional incentives were provided to households that completed the survey. Under this approach, the response rate fell to 21% in May 2020, and then further to 16% in June and 11% in July.[90]
In 2021, the survey moved to a knock-to-nudge approach, with interviewers calling at home addresses with social distancing, but then conducting the interview itself over the phone (including populating the travel diary via telephone). This achieved a 41% response rate[91], so was much closer to the pre-Covid response.
The NTS remained knock-to-nudge until April 2022, when face-to-face interviewing resumed. A number of ongoing challenges, including re-building field capacity post-Covid, meant interviewers were not able to cover all the selected sample points in 2022, so some points were worked using a push-to-telephone approach (as in 2020).
At the time of writing, NTS remained face-to-face and there were no plans to move away from this in the immediate term. However, the contractor is currently testing transitioning from a pen and paper travel diary to a digital diary (but with interviewers continuing to conduct the initial interview and ‘place’ the diary with households).
Key points of relevance:
- Overall similarity to SHS, SHeS or SCJS: The NTS is of most obvious relevance to the SHS, given the travel diary element. However, it collects travel diary data in a different way – the SHS includes a within interview, interviewer-administered 24-hour recall diary, while NTS involves a seven-day diary completed following the interview. Otherwise, its basic sample-design and approach (PAF sample, face-to-face, CAPI) is broadly similar to all three Scottish Government surveys.
- Decisions re. transitioning: At the time of writing, the main change planned to NTS was transitioning from a pen and paper to a digital diary. There were no plans to move away from an initial interviewer administered interview and placement of the diary. It was noted that the experience of 2020 “Taught us that you don’t get the response rate if you don’t have people knocking on the door … it’s a long survey, and capturing the trip data is quite complicated … and our interviewers are really important in helping us capture that data.”
- Response rates: The substantial fall in response rates observed in 2020, when the survey moved to push-to-telephone, led the researchers to conclude that “The lower response rate associated with this methodology ultimately impacted the statistical and analytical power of the data for the 2020 survey.”[92] The move to knock-to-nudge improved response rates considerably. However, when the survey returned to a predominantly face-to-face approach in 2022, the response rate was lower than both pre-pandemic and 2021 – 31%, compared with 48% pre-pandemic and 38% for 2021 as a whole (41% for the knock-to-nudge period)[92] This appeared to have been driven by an increase in ‘partially productive’ interviews (where only part of the survey is completed) and an increase in the refusal rate, from 27% in 2021 to 30% in 2022.
- Representativeness: Analysis of changes in the sample profile during the Covid period led the researchers to conclude that ““In summary, whilst some differential non-response (differences in response levels between groups within a population) is apparent in all surveys, the survey methodology that was used since the outbreak of COVID-19 has had a noticeable impact on the achieved samples. The move away from P2T methodology to a K2N approach in 2021 helped to move the profile closer to the pre-pandemic profile produced by traditional F2F methods. In 2022, with the transition back to F2F fieldwork (with a telephone back-up), this trend continued in some areas, but stagnated or regressed in others to some extent.”[92] In particular, they found that:
- The push-to-telephone approach used in 2020 over-represented home owners and under-represented renters. This remained an issue (though to a lesser extent) in the 2022 survey, even after it had returned predominantly to face-to-face (albeit with a sub-sample issued push-to-telephone).
- The push-to-telephone survey over-represented ‘affluent achievers’ (based on Acorn classification), and individual respondents were older, more educated, and less ethnically diverse than in 2019. Some of these impacts were reduced by the move to knock-to-nudge in 2021. However, achieved samples in all of 2020, 2021 and 2022 were more educated compared with the 2019 sample. Moreover, while the over-representation of older-people appeared to be partially corrected by the move to knock-to-nudge, the 2022 sample deviated further from 2019.
- Other options for collecting travel data: NTS plan to explore options for alternative ways of collecting travel data, such as adding map features to the digital platform to make it easier to add start and end points, as well as exploring options to reduce complexity in the travel diary, so that journeys are asked about in a more ‘natural’ manner (for example, it was noted that the concept of journey ‘stages’ could be difficult for respondents to follow). However, these were seen as topics for the future – the focus at this point was to ensure the smooth initial transition to the digital diary.
Next Steps
Survey name: Next Steps (formerly the Longitudinal Study of Young People in England (LSYPE))
Commissioner: Centre for Longitudinal Studies (CLS) at the University College London (UCL) Social Research Institute, funded by the Economic and Social Research Council (ESRC)
Overview: Next Steps is a longitudinal study, following the lives of a cohort of people born in 1989-90. Cohort members were interviewed annually between 2004 and 2010, with subsequent waves taking place in 2015 and 2022. The first four waves used a single mode, face-to-face design, and the parents of cohort members were also interviewed. In wave 5 in 2008, the mode transitioned to sequential mixed mode, using a web-first design.
Methodology
The study was set up by the Department of Education to study young people’s experiences of secondary school and their transitions from compulsory schooling to further education, training or the labour market. In 2013, the study was taken over by the Centre for Longitudinal Studies (CLS) at the UCL Social Research Institute. Since 2013, the focus of Next Steps has broadened to collect information on many different aspects of life, including physical and educational development, economic circumstances, employment, family life, health behaviour, wellbeing, social participation, and attitudes. By following study members over time, the study seeks to examine how early experiences can shape later life circumstances.
Schools were used as the primary sampling unit and deprived schools were oversampled. The sample at wave 1 (age 13-14) was made up of 16,000 young people born in 1989-90, who were in state or independent secondary schools across England in 2004. An ethnic minority boost of 352 cohort members was added at wave 4 in 2007. For the first seven waves, only those who had participated in the previous wave were invited to take part. While response rates of those issued remained high throughout waves 2-7 (response rates of 86-92%), by completion of wave 7 in 2010 (age 19-20), the sample size had decreased to 8,682.
In advance of wave 8 in 2015 (age 25-26), CLS attempted to trace and re-contact all cohort members who had ever taken part in the study, except a small number of withdrawals. A total of 15,531 cohort members were issued. Wave 8 was conducted using a delayed concurrent mixed mode design, with web offered first, followed by a telephone survey for those who had not yet responded, and face-to-face survey of those still not responding. The web survey remained open throughout fieldwork. The response rate at wave 8 dropped to 51%, in part due to the greater number of cases issued, and in part representing the difficulties of tracing cohort members of this age group, particularly as five years had passed since the previous wave. The response to the web survey was considered relatively strong, a response rate of 32%. Telephone proved to be challenging, with a telephone response rate of only 14% of those issued to telephone, or 4% response rate of all issued cases. Consequently, more cases than planned were issued for face-to-face fieldwork. Of cases issued to face-to-face, 22% responded, equivalent to 14% of all issued cases.
In wave 8, cohort members were asked for their consent to link data from their administrative records (for example health and education records) to their survey answers. The rate of consent to any record was higher for telephone (90%) and face-to-face (89%) than web (69%).
Wave 9 took place in 2022-23 (age 32) and used a delayed concurrent mixed mode design. Technical details are yet to be published at the time of writing. Cohort members were invited to complete a web survey, with nonresponders allocated for interviewer follow-up after three weeks of web fieldwork. Due to COVID, remote interviewer-administered modes were offered, but in-home face-to-face surveys were prioritised. The modes offered, in priority order, were: (1) a face-to-face in-home interview, (2) the interviewer providing a secondary device to temporarily leave with the cohort member to complete the survey, (3) a video interview via MS Teams, and (4) a telephone interview with e-showcards.
The Wave 9 survey was approximately 60-minutes long for web and 90-minutes long for face-to-face. Within the survey, there was a self-completion section for more sensitive questions, and cohort members were asked to do a cognitive test of working memory capacity. Cohort members were also asked to provide their consent to link data from their and (if applicable) their resident partner’s administrative records to their survey answers, and to provide a saliva sample from which DNA can be extracted for genetic research. A separate, shorter survey for nonresponders was also implemented. During the soft launch, an experiment was conducted to test whether the follow-up survey of nonresponders should be the full 60-minute survey or a cut down 20-minute version. The response rate to the 20-minute version (14%) was significantly higher than the response to the 60-minute version (11%). Therefore, the decision was made to proceed with the cut down version of the follow-up survey of nonresponders for mainstage.
Key points of relevance:
Overall similarity to SHS, SHeS or SCJS: Next Steps is a longitudinal cohort study, which has different challenges related to respondent engagement and attrition compared with cross-sectional general population surveys. Longitudinal studies are able to maintain higher response rates when transitioning mode due to having a previously engaged sample. Next Steps is more similar to Growing Up in Scotland. The most recent wave of Next Steps incorporated a saliva sample as an additional element, though the response rate data is yet to be published.
Consent to data linkage: Cohort members are asked for their consent to link data from administrative records to their survey answers. In wave 8, the consent rates were significantly higher for interviewer-administered modes (90% telephone and 89% face-to-face) than web (69%). The Scottish surveys use a different model for data linkage instead of consent, so this may be less of a concern.
Visual summary of design of Next Steps wave 9
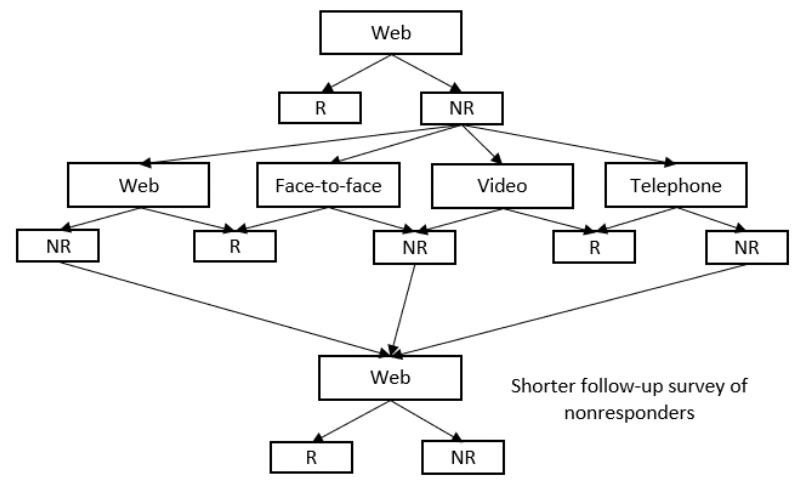
Northern Ireland House Condition survey
Commissioner: Norther Ireland Housing Executive
Summary: The NI House Condition Survey is a repeat cross-sectional national survey. This will be the 13th wave since it was first launched in 1974. It is usually conducted every five years, but the last one took place in 2016 (the 2021 wave was delayed to 2023 because of the pandemic). It collects information on the condition and energy efficiency of the domestic housing stock as well the characteristics of householders. In 2023, it had a target of 7,000 homes.
Methodology:[93] The NIHCS is conducted in-home face-to-face. In 2016, the sample comprised all dwellings included in the 2011 NIHCS and a fresh top-up random sample from the Pointer database held by NISRA. Pointer is the address database for Northern Ireland and is maintained by Land & Property Services (LPS) with input from local councils and Royal Mail. 2,023 surveys were conducted in 2016 using electronic tablet devices to collect the data. This was first used in 2009. In previous waves, paper forms were used. The fieldwork was undertaken by a team of professional surveyors. These were Environmental Health Officers, chartered surveyors or architects. Unlike the EHS and the SHCS, the surveyor team undertakes both the physical survey and collects information on the household.
Key points of relevance:
- Overall similarity to SHCS, SHeS or SCJS: The NIHCS has obvious similarities in aims to the SHS and SHCS.
- Decision to transition: The survey mode remains unchanged.
- Response rates: A response rate of 67% was achieved in 2016, slightly lower than previous waves. No information has been published on the response rate in 2023 at the time of writing.
- Representativeness: Very limited information is given on representativeness in the main report for 2016. “Survey weighting factors that were taken into account included non-response. Adjustments for non-response were based on the sample and achieved surveys and tenure”.[94]
- Surveyor visits : Unlike EHS and SHCS, the NIHCS uses the surveyor team to collect both social and physical data. Surveyors use electronic tablets to collect this data. The SHCS is currently transitioning to use a similar system.
Participation Survey (previously Taking Part)
Commissioner: Department for Digital, Culture, Media & Sport (DCMS)
Overview: The Participation Survey is the successor survey to Taking Part. It is a continuous, repeat cross-sectional, push to web survey of adults aged 16 and over in England, for DCMS. It provides a central, reliable evidence source that can be used to analyse cultural, digital, and sporting engagement, providing a clear picture of why people do or do not engage with these activities.
Methodology:
Taking Part (2005-2019) was a continuous face to face household survey of adults aged 16 and over, and children aged 5 to 15 years old in England. It involved a multi-stage stratified probability sample design. First, postcode sectors were selected from PAF (stratified by region, education, and population density). Next, addresses were randomly sampled from selected postcode sectors. Finally, one adult, one child of the responding adult (where applicable) aged 5-10, and one child aged 11-15 (where there were eligible children resident) were randomly selected in each participating household.
In its final year, the median interview length for an adult was c. 40 minutes, 22 minutes for a child aged 10-15 and 12 minutes for 5-10 year-olds. All interviews were conducted face-to-face, but respondents were asked to join a web-panel for follow-up research. From 2017/18 onwards, all sampled addresses were sent an unconditional £10 incentive. In 2019/20, the achieved adult sample size was 8,161 (the 2019/20 sample size was slightly reduced due to fieldwork finishing earlier because of the Covid-19 pandemic), with an adult response rate of 42.9% (AAPOR1).[95]
The Participation Survey (2021 onwards) is the successor survey to Taking Part, focusing on participation in cultural, digital and sporting activities among adults (16+) only. It is a push-to-web design, with targeted paper questionnaire follow-up to non-responders and those not digitally engaged. Sample is again PAF-based, and for each address CACI is added with the expected number of resident adults in 10-year age bands. The invitation letter includes a QR code and 2-4 log-ins (based on the expected number of adults at the address), with all residents 16+ invited to complete the survey. The survey has a modular structure – half the questionnaire is a core section, asked of the full sample, and the remaining questions are split into three modules, randomly allocated to sub-samples.
Up to three reminder mailings are sent, with a paper questionnaire included in the second reminder for around 35% of non-responding households, selected on the basis that a) the address is in a deprived area or b) based on CACI, it is expected that all household members may be 65+. The paper questionnaire, which is also available on request, is shorter than the online version – it includes only the core questions, with no additional modules. Around 85% of respondents complete the survey online, with the remainder completing it on paper. The median length of the survey in 2021/22 was 26 minutes. In 2021/22, the household level response rate was 33% (AAPOR1), with 33,589 interviews achieved from 22,955 households (from 69,117 issued addresses).[96]
Key points of relevance
- Overall similarity to SHS, SHeS or SCJS: The topics in the Participation Survey are similar to some of the questions on cultural participation included in the SHS. It also covers digital skills and internet use. There are no additional data collection elements (as with the surveyor visits on SHS/SHCS or biomeasures on SHeS).
- Decision to transition: Pre-pandemic, the DCMS had just launched a consultation as part of a strategic review of their surveys. adThe Participation Survey was therefore commissioned with the aim of increasing the sample size for the same cost. It was not possible, given the pandemic, to carry out parallel runs to test the impact of mode change on response in advance of launching the new survey (in October 2021).
- Trends and time series: While the Participation Survey asks similar questions to Taking Part, there was an acceptance by the commissioner that the change in design means the time series starts afresh in 2021 and it is not possible to make robust comparisons with Taking Part. They also noted the difficulty of disentangling any differences observed, in terms of which reflect real changes relating to the pandemic, which are a result of mode change, and which reflect changes to the questionnaire.[97]
- Data collection and quality: the importance of cognitive testing to developing the online survey was emphasised, as people read questions very differently to how they might understand them when interviewer administered. There were particular challenges around translating certain questions from interviewer administered to self-complete – for example, socio-economic classification questions where respondents might not provide sufficient detail for the kinds of coding interviewers were able to do. However, the move to online and the increase in sample size had enabled more coverage of more topics than before (through use of streaming/modular structure).
- Sample size and cost: The aim of increasing the sample size within budget was met – the survey has increased from c.10,000 adult respondents pre-pandemic to c. 33,000 in 2021/22. Incentive costs had increased (as there is a conditional incentive of £10, so the bigger sample size increases the cost of this). However, this was reported to be feasible within the budget.
Transformed Labour Force Survey
Survey name: Labour Force Survey / Transformed Labour Force Survey (LFS/TLFS)
Commissioner: Office for National Statistics (ONS)
Overview: The Labour Force Survey is a UK-wide household survey measuring employment statistics. Currently delivered face-to-face, the survey has been involved in an extensive redesign process to move to the web-first Transformed Labour Force Survey.
Methodology: Labour Force Survey
The Labour Force Survey (LFS) has been running since 1973 and was designed to provide data to Eurostat that could be compared with other EU countries, until the UK left the EU in 2020. Since 1992, the survey has been run quarterly, using a panel approach with participants staying in the sample for five waves. Therefore, a fifth of the sample is replaced each wave.
The sample is selected as an unclustered sample of rom the Postcode Address File. However, there are some limitations to coverage in Scotland north of the Caledonian Canal, with respondents there sampled by telephone using telematching. This area represents about 5% of the total population of Scotland. A boost of the sample is also selected to be interviewed annually for four years, with these cases being added to the Annual Population Survey. Due to the longitudinal design of the survey, those who agree to be followed up by telephone at wave 1 are contacted by phone in later waves. Around 58% of all interviews are completed via telephone. For subsequent interview waves, interviewers are also provided with previous responses, to support accuracy.
As a household survey, the aim is to include all members of the household. To facilitate this, proxy responses are allowed where a member of the household acts as translator, where the person has caring responsibilities, and if given personal permission of the head of household or spouse. About a third of responses are received by proxy.
Over the lockdown period, when face-to-face interviewing was suspended, telephone surveying was rolled out for the traditionally face-to-face waves, with tele-matching used to identify phone numbers for selected new wave 1 addresses. To adjust for the reduced response rate associated with the move from face-to-face to telephone interviewing, the sample size was initially doubled and then gradually reduced.
For each cohort, response rates decrease by wave, with a drop of around 15-20 percentage points between the response rates in wave 1 and the response rates in wave 5. Response rates had also been gradually decreasing over time, with wave 1 response rates dropping from 62.4% in October-December 2009 to 53.8% in October-December in 2019. However, this was greatly accelerated under the change in mode, with January-March 2020 seeing a response rate of 29.8%, a decrease of 24 percentage points within a single quarter.
From April 2021, knock-to-nudge was also introduced to encourage people to participate where no telephone number had been provided or could be matched. This improved response rates, particularly among those classified as ‘hard to reach’. However, demographics, such as tenure and proportion of respondents born outside the UK, continued to show additional non-response bias, and a new weighting scheme was introduced to adjust for these differences.
The reduced response rate meant sample sizes were still too small to be confident in the precision and accuracy of estimates, and data could not be published for October 2023. Instead, figures based on administrative data were published and classified as experimental statistics. Interventions have since been introduced to improve the number of responses received on the LFS. This included increasing the initial sample size, the reintroduction of in-home interviewing in October 2023, prioritising experienced fieldwork staff, increasing field hours and days of the week for telephone, knock-to-nudge, and face-to-face interviewers, and increasing participant incentives to £10 and £50. In the interests of speed, these changes were implemented without prior testing on this survey.
All these interventions have led to an increase in the number of responses received to the survey’s wave 1 – from 4,531 households between January-September 2023 to 7,550 households between January and March 2024. However, response rates have not seen the same level of increase, settling around 33.5% in January and February 2024. This is still below pre-pandemic levels, suggesting the sample boost has had the largest impact on numbers of responses.
Methodology (Labour Market Survey (LMS)): Work to move the LFS to an online-first approach began as a transformation programme around a prototype push-to-web survey known as the Labour Market Survey (LMS) in response to a quality review of the LFS in 2014. This review also recommended moving to the AddressBase sample frame, which was used for LMS trials. AddressBase Premium[98] (which is now used on the TLFS) is generally considered to be more comprehensive and accurate than PAF, as it is compiled from a variety of sources, including local authority address gazetteers, Ordnance Survey data, and Royal Mail data. PAF, on the other hand, is compiled solely from Royal Mail data. Because of this AddressBase Premium is more likely to include new build properties and to have more accurate address details, and with AddressBase Premium it is also easier to identify communal establishment for exclusion from the issued sample. It is, however, more expensive than PAF. The Strategy for UK Statistics from 2015-2020 also included an expectation that data would be collected “digital by default”.
This work used a Respondent Centred Design (RCD) approach to develop the questionnaire, focused on extensive testing and understanding of mental models among participants, to account for the lack of interviewer support available during a self-complete approach. This meant that, in order to collect the same data, it was often required to redesign the question approach, to ensure it was straightforward for participants to understand. Extensive testing of materials and contact strategies also took place. This including cognitive testing and piloting of mailing strategies, materials, day of week, envelope branding and colour, and incentive approaches. The development process involved qualitative research with over 1,000 participants before the survey went into field, organised using an agile methodology. An ‘optimode’ design was also used, meaning the same question may be asked in different ways via different modes to achieve the same outcome, depending on what was available within that mode, as the design is optimised for the specific mode it is asked in.
While initial piloting focused on the online approach, a statistical test was conducted between October 2018 and April 2019 using a delayed concurrent mode design. This test used a “Core” version of the questionnaire, which collected fewer variables than the LFS. Where households did not respond to the push-to-web letter encouraging them to respond online within the first two weeks, having previously received a pre-notification letter, addresses were released to a face-to-face field team, over a six-week fieldwork period. The test had a 54.5% response rate of fully completed households, with 49.2% of these responses received online. A further 2.0% of usable partial completes were collected, with 81.4% of these received online, and 4.1% of unusable partial completes, of which 63.7% were collected online.
Demographic comparisons were conducted which suggested that LMS was as representative as LFS by sex, age, country of birth, ethnicity, nationality, and household size, and more representative by Index of Multiple Deprivation (IMD). Data analysis using a subsample of the results suggested there were no significant differences in headline labour market estimates, although there were differences for some subgroups (e.g. educational status for people aged 16-24), and on some specific topics (e.g. self-employment and number of hours worked).
Methodology (Transformed Labour Force Survey (TLFS)): In response to the COVID-19 pandemic, the Transformed Labour Force Survey (TLFS) was launched in March 2020, drawing on learning from the LMS design programme. The survey continued to develop, based on experimentation and analysis of question responses. From April 2022, the survey has been delivered at target sample size, with results shared for external peer review in July and October 2023 and January and May 2024.
TLFS initially used an online-only push-to-web approach, before experimenting with telematching and knock-to-nudge in 2021. These were rolled out across the survey in 2022, in February and November respectively, to respond to the improvements in response rate seen in experimentation. In addition, as the knock-to-nudge approach was targeted at groups less likely to respond (by expected age profile and IMD of the address), this approach also improved representativity of respondents. The content of the survey was extended to include all key labour market content in September 2022. The expected final changes to the survey were made over the second half of 2023, covering sample design, questionnaire content, and statistical derivations. At the time, the expectation was that TLFS will have met all quality criteria to allow LFS will be decommissioned in 2024 and replaced with TLFS. However, in July 2024, it was announced that the dual run of the TLFS and LFS would be extended to the end of 2024, with potential changes to the TLFS methodology to follow in early 2025.[99]
The Office for Statistics Regulation has continued to review all published outputs, to assess the quality of the related statistics, including through published letters in November 2022 and July 2023. The main focus of recommendations supplied have been increased and clear communication, particularly on the approach to stakeholder and user engagement, data available, data discontinuities and impact on time series, and quality assurance processes.
Visual summary of previous and current designs
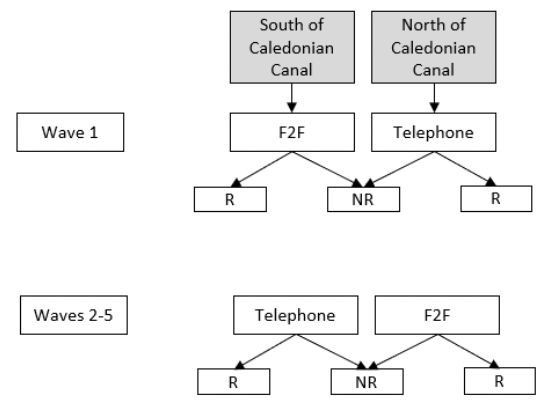
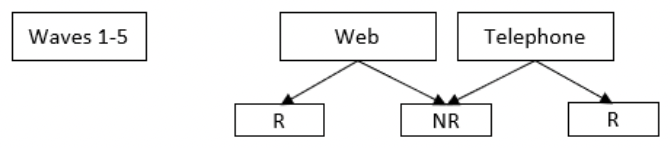
Key points of relevance:
- Relationship with Office for Statistics Regulation: TLFS has worked with the Office for Statistics Regulation, as it has considered making the move to a new mode, to ensure the process is clear and robust
- Nonresponse bias: The ONS have noted a bias in the TLFS towards older age groups.
- Partial response: The ONS have also observed an increased level of partial TLFS responses compared with the LFS. They attribute this to the online nature of the TLFS, which means that people may drop out before completion, and that it is more challenging to obtain completion from a full household.[99]
- Questionnaire redevelopment for changing mode: TLFS has done extensive work, using Respondent Centred Design and mode optimisation to redesign the questionnaire instrument to work most effectively for the new design
- Targeted follow-up: Rather than following up all sample points, TLFS has prioritised targeting knock-to-nudge reminders to groups identified from the local area statistics as being less likely to respond without a reminder
- Parallel run: TLFS has conducted an extensive, full-scale, parallel run, in order to truly pilot the methodology and continue to adapt it before roll-out, as well as to understand any potential discontinuities
- Stakeholder engagement: Throughout the LMS and TLFS development, extensive stakeholder engagement has been carried out. Alongside the parallel run, this has included parallel releases of the data, to allow data users to understand and provide feedback on TLFS data, prior to LFS decommission.
Understanding Society: the UK Household Longitudinal Study
Commissioner: The Economic and Social Research Council (ESRC)
Summary: Understanding Society[100] has been run by the Institute for Social and Economic Research (ISER) at the University of Essex since 2009, building on the British Household Panel Survey (BHPS) which ran from 1991-2009. It is a longitudinal household panel survey, aiming to interview everyone in participating households every year to explore how life in the UK is changing. The study covers all ages, all four countries of the UK, and multiple topics. It has collected biomarker and genetic data via nurse visits in specific waves.
Methodology:[101] Understanding Society was designed to include a high degree of methodological innovation and experimentation from the start. It includes an Innovation Panel (IP) of around 1600-1700 households, with whom they test new methods and processes before rolling out successful innovations to the main survey. Understanding Society began as a face-to-face survey, but the IP was used from Wave 2 onwards to test mixed mode approaches (note: initially these were tested with a sample that had been recruited face-to-face at Wave 1).
IP2 (i.e. Innovation Panel: Wave 2) tested a phone first approach. This had a significantly lower response rate than the face-to-face first sample, even after face-to-face follow-up. Moreover, at the next wave (IP3), when the whole IP was issued as face-to-face first again, the phone first sample from IP2 still had a lower response rate – so issuing the sample by phone had a “bruising” effect on longitudinal response rates.
At IP5, a web first approach was trialled. This proved more successful in obtaining a response from households that had not responded at the previous wave compared to the face-to-face first design, but less successful for households that had participated in IP4. However, following various experiments with incentives and other elements in subsequent waves, the response rate for web first increased to a comparable level to those issued face-to-face.
On the main-stage, the web-first design was used for previous-wave non-responding households only at wave 7. From wave 8 (2016-17), the study gradually increased the proportion of households invited to complete the survey online first, including previous-wave responding households (but retained face-to-face follow-up of non-responders). The decision as to whether to allocate households to face-to-face or web first was based on statistical modelling, to assess the propensity of each household to complete the survey online, with the least likely being allocated to face-to-face first.
The intention had been to increases the proportion issued web first up to 80%, but to retain 20% ring-fenced as face-to-face first. However, the Covid-19 pandemic and associated restrictions meant that the whole sample had to be issued web first, with a telephone follow-up. Post-Covid, this meant that there was no longer a 20% ‘ring-fenced’ sample that had not been issued web first. The approach since has therefore been web first as default, but to use modelling to identify those very unlikely to complete the survey online, who are issued face-to-face first. These account for around 10-13% of the sample. However, all non-responders are still followed up face-to-face. There is also a telephone mop-up for any respondents the team still have not been able to contact towards the end of fieldwork.
At Wave 14 of Understanding Society (2023-24, still in field at the time of writing), the study recruited new sample, using a push-to-web approach with face-to-face follow-up. The initial push-to-web response rate to this was lower than the survey team had hoped. However, various experiments with incentives and invite letters enabled them to boost the initial push-to-web response rate from around 10% to around 20%.[102]
Key points of relevance:
- Overall similarity to SHS, SHeS or SCJS: Understanding Society is longitudinal, while the three main general population surveys are all cross-sectional. This needs to be taken into account when interpreting the applicability of learning from Understanding Society – for example, it would not be possible to apply a modelling approach to identify those less likely to respond by different modes in the same way, as the modelling is based on data collected about households at previous waves of Understanding Society. Equivalent data is not available for fresh cross-sectional samples – using the current PAF-sample frame, the only data available is data it is possible to attach to the address, rather than specific information about the actual composition or behaviours of the household living there.
- Decision to transition: It was always anticipated that Understanding Society would used mixed modes. However, the process of transitioning away from a predominantly face-to-face approach took longer and involved more experimentation and testing than initially expected. The team also continue to use face-to-face follow-up and see this as crucial to reducing attrition (or maximising response for fresh sample) and including those less likely to take part online (including older people and those without internet access).
- Response rates: In terms of learning from experiments to improve online response rates, Understanding Society have found that a) adding government logos to envelopes for advance letters and b) adding QR codes to make it easier to go straight to the survey both helped, as did small (£5) unconditional incentives, in addition to the incentive offered on completion of the survey.
- Representativeness and non-response bias: As noted above, Understanding Society still employs face-to-face follow-up to maximise response, as well as targeted face-to-face interviews for those known (based on modelling of previous behaviours) to be less likely to take part online. Having a follow-up mode to online was seen as necessary as a “guarantee for high quality data”. It was also noted that they had found young people – a group some people expect to be more likely to take part online – are actually among the groups least likely to take part online.[103] As a longitudinal study, Understanding Society can use a more sophisticated weighting scheme to help correct for remaining non-response bias than would be possible on a cross-sectional survey, as responses from previous waves can be built into the model.
- Administrative data linkage: The Understanding Society team have found that consent to data linkage is around 20% lower when people take part online vs. face-to-face, even controlling for selection effects. They have experimented with various ways of trying to improve this (e.g. highlighting trusted organisations and including the ‘shield’ logo when asking for consent), but they have not found a sliver bullet to mitigate this difference as yet. As the three Scottish surveys currently rely on a different model for data linkage (rather than consent), this may be less of an issue for these surveys.
- Bio-measures and additional tasks: Understanding Society have also found that those who participate online are less likely than those who take part face-to-face to agree to and complete additional tasks, including biomarkers and app-based or diary elements. While a future option might be to use AI to help provide individually tailored responses to respondent questions on additional tasks or data linkage, there was a perception that at the moment there was a “strong benefit” to having interviewers there to help explain and encourage them to take part in these elements. Again, this is particularly relevant to SHeS, given the height, weight and biomeasure elements of that study. It is also likely to be relevant to the SHS/SHCS in relation to surveyor follow-up visits.
Contact
Email: sscq@gov.scot
There is a problem
Thanks for your feedback