Long term survey strategy: mixed mode research report
Findings from research exploring mixed mode survey designs in the context of the Scottish Government’s general population surveys. The report details information on key issues, potential mitigations and remaining trade-offs, and includes 21 case studies on relevant surveys.
5. Representation: Nonresponse
Introduction
Once the sample has been selected, the next key driver of representativeness is nonresponse. Nonresponse is normally discussed at survey-level – that is, the impact of households or individuals not taking part. Survey non-response tends to come from failure to make contact with potential respondents and people refusing to take part (Massey & Tourangeau, 2013).
However, non-response also occurs at the item or question level – that is, questions that respondents do not answer. It is particularly important to be aware that nonresponse bias is item-specific and will affect some survey estimates far more than others.
This chapter discusses the evidence on mode and response rates, the strength and nature of evidence for a link between response rates and nonresponse bias, and the implications of mode choice for nonresponse bias. It also discusses the impacts of mode for consent to data linkage and additional tasks specifically (including impacts on both level of agreement to these additional tasks and potential impacts in terms of bias in the profile of those agreeing to them), before ending with a discussion of what can be done to mitigate nonresponse bias.
Response rates
Response rates – the percentage of people or households who complete a survey out of the total number of eligible people or households asked to participate – are typically used as a proxy measure for the potential for surveys to be affected by nonresponse bias.
Response rates vary extensively depending on factors such as survey topic, length, contact strategy, incentives, and target population. Moreover, comparisons of response rates by mode are not completely straightforward. For example, with postal, telephone and push-to-web surveys, it is generally not possible to know which addresses are ineligible (e.g. because they are vacant), so methodologists have to make assumptions about the likely proportion of ineligible addresses, rather than basing calculations on interviewer-collected data, as with face-to-face surveys.[34] However, there are some general findings that can be drawn out of the literature on response by mode.
Overall, the literature indicates that face-to-face surveys have had higher response rates than telephone, web or paper surveys, at least for cross-sectional surveys or the first wave of longitudinal surveys. For example, the move to push-to-telephone on the National Survey for Wales was associated with a fall in the overall response rate from 55.7% to 38.2% (see case study in Appendix A). Similarly, the Labour Market Survey mode trial run by ONS in 2019 showed that 28.4% responded to the push-to-web letter before face-to-face fieldwork was introduced (which boosted the overall response rate to 56.6%). By contrast, that same year, the face-to-face only Labour Force Survey achieved a 54.6% response rate.[35]
Comparing response rates for telephone surveys with other modes is complicated by the fact that historically, most telephone surveys used a Random Digital Dial (RDD) sample frame. Active Lives used this approach, prior to transitioning to a push-to-web design in 2015. Its response rate by telephone was 27.3%, which is clearly substantially lower than would have been expected for an equivalent face-to-face survey at the time. This fell to 23.1% when it moved to push-to-web. As described in chapter 2, the declining number of households with a landline and difficulties generating accurate RDD mobile samples means that telephone surveys now tend to use a ‘push-to-telephone’ approach, similar to push-to-web. During the pandemic, SHS and SHeS both used this approach and both saw large drops in response rates compared with their 2019 face-to-face surveys - from 57.2% to 19.7% for the SHS and from 55.6% to 14% of eligible households on SHeS (see Martin et al, 2022, and Cook et al, 2021).
General population push-to-web surveys with paper follow-up have tended to get much lower response rates. For example, the push-to-web Food and You 2 got a response rate of 30.4% in its first wave in 2020 (Candy et al, 2021), compared with a response rate of 48.2% in the final wave of its face-to-face predecessor in 2018 (Fuller et al, 2019).Similarly, British Social Attitudes survey response rates fell from 44% in its last face-to-face wave (2019) to 14.2% in its 2022 push-to-web wave (see case studies in Appendix A). Push-to-web and paper surveys tend to have similar response rates, although push-to-web is often slightly lower, but this will depend on the audience. For example, when testing moving the CQC’s NHS Patient Survey Programme from paper-only to push-to-web, the Adult Inpatient Survey saw a fall in response rate, while the Maternity Survey saw a small increase.[36]
Meta-analytic research (e.g. Daikeler et al., 2020; Shih & Fan, 2008; Manfreda et al., 2008) has also found that response rates to web surveys were consistently lower than other modes, and in the UK averaged around 16 percentage points lower than other survey modes.
However, there is some evidence that the difference in response rates between web and face-to-face is beginning to change. In some countries, including Germany, Sweden and Estonia (all of which use population registers for sampling), response rates for general population web surveys have begun to exceed those for face-to-face surveys. It is difficult to tell whether patterns observed on surveys that sample from population registers are likely to be replicable on surveys in countries that are reliant on address-based sample frames. Population registers enable survey organisations to contact individuals directly and by name, which has generally resulted in higher response rates than surveys where the initial contact needs to be more impersonal (addressing invite letters to ‘the resident’, for example).
However, a higher response rate online compared to face-to-face was also observed for the UK on the 2021 round of the European Social Survey (ESS). A push-to-web self-completion parallel run was carried out in the UK at the time of ESS Round 10 in 2021. The self-completion version of the survey (which had a median completion time of 47 minutes) achieved a 43% response rate (compared to 21% for the face-to-face survey – see Hanson, no date). The design included a relatively generous incentive regime compared with many push-to-web surveys (£5 unconditional cash – not voucher – incentive in all advanced letters, £10 cash incentive on completion, and a further £5 gift card in later reminder letters) and a long fieldwork period, but demonstrates that it is possible to achieve higher response rates with push-to-web approaches.
Face-to-face contact has tended to lead to lower nonresponse for two reasons. The first is that interviewers are more likely to make successful contact with prospective respondents. Interviewers are typically required to work a prescribed call pattern for each sampled unit, persevering to attempt making contact across various times of day and days of the week. In contrast, as discussed above, for cross-sectional surveys of the general population, initial contact to invite people to take part in a web, paper or telephone survey is likely to be by post – and these invitations and reminders can go unread or be ignored. Another reason for the lower rates of non-response in face-to-face surveys is that the presence of an interviewer and their persuasion tactics can encourage the prospective respondents to take part in the survey. Interviewer administered surveys (both face-to-face and telephone) can also help reduce item nonresponse, by encouraging people to answer each item (and to give substantive responses, an issue discussed further in chapter 6).
However, while at present, all other things being equal, face-to-face surveys generally remain more likely to gain a higher response rate than other modes, it is worth noting that there is considerable variation in response rates between surveys conducted using the same modes or combinations of modes. There is also an ongoing debate about what can be deemed an acceptable level of response to a general population survey. Among Scottish Government survey stakeholders interviewed for this study, one view was that response rates below 50% can attract scepticism from stakeholders, and that falling response rates might lead to a ‘tipping point’ where surveys are both perceived to be biased and are actually unable to correct for non-response bias. On the other hand, expert interviews conducted for this survey highlighted the fact that response rates to face-to-face surveys have generally been in decline over recent decades, and that since the pandemic, some face-to-face surveys have seen significant further drops in response rates. One view was that it is not yet clear what constitutes an ‘expected’ level of response to a face-to-face survey in the ‘post-pandemic’ world, making it difficult to draw comparisons of response rates between face-to-face and other modes with any certainty.
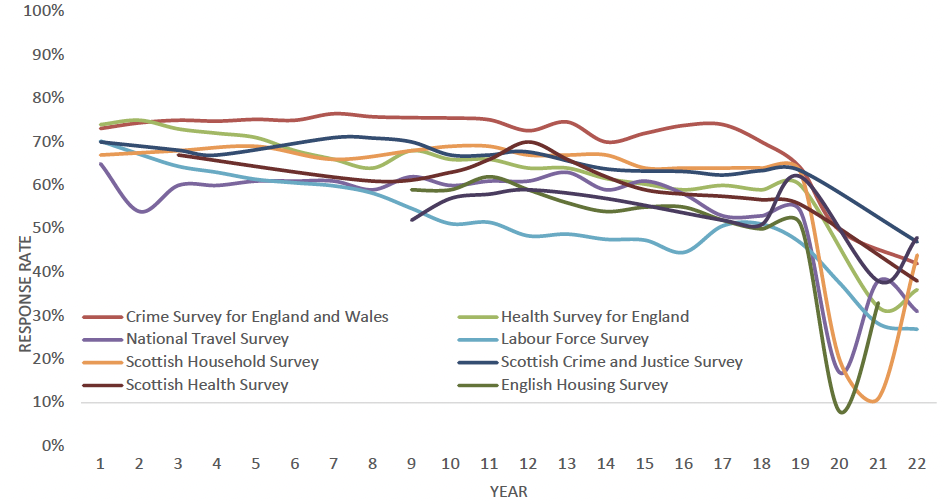
This view is supported by Figure 5.1, which shows trends in response rates up to 2022 across a number of largescale government surveys in Scotland and the rest of the UK. All of the surveys included were face-to-face prior to the pandemic but shifted to another mode or modes during 2020-2021. All saw large drop-offs in response rate in this period. Most had reverted back to face-to-face by 2022/23, but the 2022 response rates were generally still lower than pre-pandemic even for those that had returned to face-to-face. 2023 response rates had not yet been published for most of these surveys at the time of writing, making assessing what the ‘new normal’ might be in terms of face-to-face response rates very difficult.
There was an associated divergence of opinion across the survey experts interviewed for this study over whether face-to-face will continue to be required as an element of any future high quality survey design to maintain overall response rates and representation of key sub-groups, or whether face-to-face response rates might, in future, drop to a level where it arguably becomes no better than other modes in terms of response rates – and by extension nonresponse bias.
Item nonresponse by mode
Response rates at the item level also vary by mode. It is worth noting that levels of item nonresponse in part depend on how the survey is programmed. For example, computer-aided self-completion and interviewer-administered survey scripts can be programmed with validation checks and prompts, so that respondents cannot proceed without answering a question and thus item nonresponse is not possible without breaking off. Paper questionnaires typically have the highest rate of item nonresponse, as computer-aided checks cannot be implemented.
When considering interviewer-administered surveys (face-to-face or telephone) against self-administered surveys, interviewers are able to encourage a response to each question, and thus item nonresponse is typically lower (Bowling, 2005), particularly for complex or sensitive questions. An experiment by Heerwegh and Loosveldt (2008) investigated the data quality between web and face-to-face and found that while average rates of item nonresponse were low in both modes, rates were significantly higher for web. Other studies have also showed that web surveys have a higher item nonresponse rate compared to face-to-face and telephone surveys (Al Baghal & Lynn, 2015; Heerwegh & Loosveldt, 2008). However, the first meta-analysis looking at differences in item nonresponse by mode, specifically focusing on surveys with random assignment to mode, recently found no difference in the average rate of item nonresponse between web and other modes (Čehovin, Bosnjak, & Lozar Manfreda, 2022).
Comparisons between web and paper are less clear, however. Some studies have found item nonresponse to be lower in web surveys (Hsu & McFall, 2015; Kwak & Radler, 2002), but others have found that mail (paper) surveys outperformed the web survey mode in terms of item nonresponse for certain parts of the questionnaire (Börkan, 2010) and certain target populations (Wolfe et al, 2008). The British Election Survey found higher item nonresponse for both paper and web modes compared with face-to-face when it switched to self-completion design during the Covid-19 pandemic period (see case study in Appendix A).
Response rates and nonresponse bias
Nonresponse becomes a problem where those responding to a survey differ in survey-relevant ways from those who do not respond. This has important implications for consideration of survey modes.
It is important to note that a high response rate, and thus low rate of nonresponse, does not necessarily equate to low nonresponse bias; nor does a low response rate equate to high nonresponse bias. Rather, the lower the response rate, the greater the risk of non-response bias. Although higher response rates are often associated with increased representivity (e.g. Cornesse and Bosnjak (2018)), the relationship is not necessarily clear cut. The level of nonresponse bias depends on how the factors leading to nonresponse relate to the core variables (Bethlehem, Cobben & Schouten, 2011). High nonresponse bias occurs if the propensity to respond is related to the variable of interest. For example, including a question about internet usage in a general population web survey, would produce a biased estimate, as those who do not use the internet will, by definition, not respond to a web survey. A subset of the population, who differ systematically from those who respond, would not be represented. A higher response rate to this survey would not necessarily be more representative, as it would have the same underlying bias.
In general, however, there is mixed evidence of how response rates relate to nonresponse bias, with a meta-analysis finding a weak association (Groves & Peytcheva, 2008). This meta-analysis found high variability in bias within surveys and recommended that bias should be considered for individual estimates rather than at the survey level.
Evidence from the Scottish Government surveys also supports this finding of a weak association between response rates and nonresponse bias. Analyses on data from the 2014 and 2016 Scottish Household Survey (Hutcheson et al, 2020) found that the impact of including (versus excluding) reissued cases, in effect comparing a marginal difference of around a 7-8pp difference in the response rate, was small. It concluded that “In general reissuing does not have a meaningful impact on the survey estimates”. A similar effect was found on the Scottish Crime and Justice Survey (Martin, 2020), such that reissues increased the response rate by 8-9 percentage points, but the impact of reissues on national estimates was small, with the change in most estimates being less than half a standard error.
On the Scottish Crime and Justice Survey, comparisons of 2019 data (collected face-to-face) and 2021/22 data (collected using mixed modes, combining knock-to-nudge to telephone or video interviews in the early part of the period, and face-to-face fieldwork in the latter part, with video as an option) found the response rate fell from 63% to 48%. However, it was not clear that this resulted in greater nonresponse bias. For example, one indicator of nonresponse bias is variation in response rates across areas, but variation for deprivation was similar on the 2019 SCJS compared with 2021/22. Moreover, although there were some small demographic differences, survey estimates were similar (Martin, Bell & Napier, 2023).
As noted above in relation to the SHS and SCJS, reissues are used to increase response rates, but may not effectively reduce nonresponse bias. Sturgis et al. (2017) modelled the impact of including versus excluding harder to interview respondents (as defined by the number of call attempts made before an interview) on survey estimates across six UK face-to-face surveys. These authors found little difference in survey estimates, concluding that “Our findings add further weight to the body of evidence which questions the strength of the relationship between response rate and nonresponse bias…making large numbers of calls at sampled addresses and converting ‘soft’ refusals into interviews are not cost-effective means of minimizing survey error”.
In addition, some interventions may increase total response rates but increase non-response bias. When the Scottish Household Survey transitioned (temporarily) in 2020 to invite people by post to opt in to telephone or video interviews, there was a significant fall in response rate, from 63% in the 2019 face-to-face survey to 20% for the 2020 push-to-telephone/video survey. Telephone numbers were matched to PAF where possible to make telephone contact, which increased overall response rates (the telephone matched sample had a response rate of 37%, vs. 14% for the opt-in only sample) but made the sample less representative. The mode transition introduced greater variability in response across different areas, and overall resulted in an older sample, underrepresentation of those in deprived areas and over-representation of those in owner-occupation. Estimates for tenure, length of time at the property and educational qualifications were impacted, although in general most survey estimates were similar in 2020 and 2019.[37] Estimates tended to be further from the 2019 figures for the telephone-matched sample, in spite of its higher response rate.
Another example of interventions improving response rates but increasing nonresponse bias was the testing of non-monetary unconditional incentives on recruitment for the Smart Energy Research Lab. This found that while non-monetary incentives increased the response rate, they also increased the skew in respondents towards those from less deprived areas and higher household incomes (Webborn et al, 2022). By contrast, some interventions to reduce underrepresentation, such as boosting groups less likely to respond, may decrease overall response rates, while making the survey profile more representative, reducing non-response bias.
It is also important to bear in mind that nonresponse bias is item-specific and will affect some survey estimates far more than others. For example, variables associated with civic responsibility (such as volunteering or voting) have been shown to be significantly correlated with survey response rates. Those participating in surveys with lower response rates tend to report higher levels of volunteering. In taking account of the potential implications of changing mode for response rates and non-response bias, it is therefore important to consider not only the overall impact, but also potential impacts on individual measures.
Mode and nonresponse bias
As noted above, the impact of changing mode on nonresponse bias was a key concern for Scottish Government survey stakeholders interviewed for this study: they raised questions about who would be missing if you moved to using different modes, particularly in terms of those who are digitally excluded.
The groups who are hard to reach in surveys, such as young adults, full-time workers and non-Western immigrants (Haan, Ongena & Aarts, 2014), are typically consistent across modes. However, expert interviewees interviewed for this study emphasised that, leaving aside differences in overall response rates, any survey mode – including face-to-face – has biases in terms of who is more or less likely to respond via that mode. This, in itself, could be seen as an argument against relying on one mode only for data collection.
An over-arching pattern is that nonresponse among those with lower levels of literacy or education tends to be proportionally higher for self-completion modes, while urban-rural differences are usually greater with face-to-face. The literature and expert interviews identify various groups more or less likely to respond by particular modes.
Face-to-face
Face-to-face is generally more effective at reaching participants who are from more deprived areas and those who have lower literacy levels. Although these groups are still often underrepresented in face-to-face surveys, the extent of this is normally smaller than in other methods. For example, the Childcare and Early Years Survey of Parents (CEYSP) 2019 push-to-web mode trial found that the 2018 face-to-face mode was better at reaching those in the most deprived quintile of areas, compared with the push-to-web survey (Huskinson et al, 2019).
Households of more than one person working full-time were considered more difficult to contact face-to-face, though due to the impact of the pandemic and increased working from home this may have changed in recent years. Those living in flats with door entry systems can be more difficult to contact face-to-face than those in other types of property. This is a particular challenge in Scotland, with its relatively high prevalence of tenement accommodation.
Web
Older people, those without the internet, those from deprived areas, those with lower levels of formal education, people with low literacy, those with English as a second language, renters and larger households have all been identified as groups underrepresented in web surveys.
The British Social Attitudes survey found that black people and social renters were underrepresented, and those with a degree overrepresented, in the push-to-web mode compared with the pre-pandemic face-to-face approach. However, the push-to-web survey was slightly less likely to overrepresent those in employment compared with the face-to-face survey (see Christie and Cornick, 2022, and case study in Appendix A).
The Childcare and Early Years Survey of Parents (CEYSP) 2019 push-to-web mode trial found that the sample profile was biased compared with the 2018 face-to-face CEYSP such that respondents to the push-to-web mode were more likely to be in work, hold an honours degree or above, live in owner occupier accommodation, and are less likely to live in the most deprived quintile of areas (Huskinson et al, 2019).
Expert interviewees also challenged the assumption that younger people are more likely to respond online than by other modes, stating that they had found either that there was no pattern by age other than older people being less likely to take part. When using a push-to-web approach with paper follow-up, participants from younger age groups are more likely to use an online mode, but this does not necessarily correct for the decreased likelihood of this group to respond overall. For example, when testing a push-to-web approach with SMS reminders and paper follow-up, compared to a paper-only approach on the CQC’s Inpatient Survey, the response rate among the 16-35 age group was higher among the mixed-mode group than the paper only (21.5% compared with 15.3%). However, this was still substantially lower than the response rate for those in older age groups. Even in the push-to-web approach, the response rate for those over 80 was 40.1%. The response rate for young people was also substantially lower than the equivalent response rate expected were a face-to-face approach to be used (Ipsos MORI, 2020).
Analysis of the push-to-web (with optional CATI) data from the redesigned British Social Attitudes survey highlighted that, compared with the previous face-to-face design, it over-represented the politically interested (those with a ‘great deal’ of interest in politics). This highlights a key challenge that needs to be considered with push-to-web designs – that is, the risk that those more engaged in the topic may be more likely to respond.
Recent development work on the Crime Survey for England and Wales has suggested that online respondents were more likely to report being a victim of crime compared with telephone respondents (see case study in Appendix A). Similarly, Laaksonen and Heiskanen’s (2013) comparison of estimates for fear of crime and victimisation across different modes also found that web surveys suggested higher prevalence of victimisation and of fear of crime than other modes. This would require very careful consideration and testing if online was to form part of the future mode design for the SCJS.
Political engagement is also likely to be relevant to views of, for example, local public services and volunteering, both of which are key topics on SHS. If the Scottish Government decides to test alternative mode designs, it may be worth including questions on political interest / engagement as part of these tests.
Finally, recent analysis of the 2023 Scottish Social Attitudes survey, which was run for the first time as a push-to-web survey that year, highlighted concerns about potential underrepresentation of those with health conditions in the web survey compared with previous face-to-face waves. The unweighted figure for the proportion of the population with a long-term health condition or disability in 2023 was 30%, compared with between 44% and 46% in the most recent face-to-face waves of SSA, and a prevalence estimate of 48% from SHeS 2022. Weighting did not change this picture.
The authors of the technical report put forward various possible explanations for this shift, including barriers to accessing an online survey among disabled people and potential impacts of changes to question order. They note that the former explanation is not supported by data from British Social Attitudes, however, which has found similar levels of respondents saying they had a long-term condition or disability in recent push-to-web waves compared with earlier face-to-face waves. In terms of question ordering, they note that in earlier face-to-face waves of SSA, the question on long-term conditions was asked immediately after a question on general health (as is also the case on SHeS), which may prime people to be thinking about health conditions. In contrast, in 2023, the question was preceded by one on an unrelated topic, so it is possible (though not certain) that this is less a mode effect than an ordering effect (Scholes et al, 2024).
Telephone
Comparison of data from the SHS push-to-telephone approach during the pandemic and the pre-pandemic face-to-face data identified a number of specific groups that were over and underrepresented in the telephone sample compared with the face-to-face sample.[38] In particular, it found that owner occupiers were overrepresented in the telephone data (in both the opt-in and telephone matched sample, though more so in the latter), while renters were underrepresented (although when analysis was restricted to the opt-in telephone sample, this was most pronounced for social renters, rather than private renters). Those with no qualifications were also underrepresented in the telephone data (both opt-in and matched sample).
The English Housing Survey, which also used a push-to-telephone approach during the pandemic, reported fewer responses from people in vulnerable positions, such as those with experience of homelessness, in addition to owner occupiers being overrepresented, similar to the SHS. Older respondents were also overrepresented, while households with children were underrepresented (see case study in Annex A). Similarly, the National Survey for Wales has found that those who have been more difficult to include in the push-to-telephone compared with the face-to-face survey have been those who are: younger; less qualified; ethnic minorities; those with poorer health, and renters (see case study in Annex A – see also the National Travel Survey).
The 2004 Scottish Crime and Victimisation telephone survey also found substantial evidence of non-response bias compared with the face-to-face survey. Although in part this was assessed as relating to coverage errors (the telephone survey used RDD, and therefore excluded the estimated 9% of households that did not have a landline), there were also a number of differences in the profile of those that responded to the telephone survey compared with the face-to-face survey – the telephone survey included relatively fewer men and fewer social renters, for example. There were also some differences in responses to attitudinal variables – such as lower fear of crime – and higher victimisation rates in the telephone compared with the face-to-face survey.
The author of the report comparing the two modes noted the difficulties in disentangling selection effects (nonresponse bias) and mode effects (discussed in chapter 6) here, noting that: “The differences in the attitudinal variables are more complex and simply indicate that the two surveys have significantly different responses on these measures. We cannot say on the basis of this that one survey is more biased than the other in what they record.” (Hope, 2005). However, with respect to the higher levels of victimisation observed in the telephone survey, comparisons of those who initially refused to take part but were converted later, with those who took part in the initial fieldwork round indicated that initial ‘refusers’ had significantly lower rates of victimisation. The report therefore concluded there was evidence that “refusal from the telephone survey is biased and that non-victims are less likely to participate in the survey. This tends, overall, to inflate the survey’s measure of victimisation.”
Paper
Older people are slightly more likely to respond to paper surveys than web-based surveys. Paper surveys can receive lower response from those who may struggle to return post. For example, the CQC Maternity survey experiments saw new mothers responding in higher levels to their push-to-web design that incorporated additional online contacts, compared with designs including additional paper contacts (Ipsos MORI, 2020). In interviews, participants highlighted that getting to a post-box with a new baby could be a challenge, whereas filling out a survey on their phone was more straightforward.
In addition, as a self-completion mode, and without the options of accessibility features that may be available in an online survey, paper suffers from nonresponse bias in terms of lower response from those with low literacy and those with English as a second language, and those with visual impairments, all of whom will face additional barriers to participating via a mode reliant on written communication.
Consent to additional data collection and linkage
The discussion above focuses on differences in initial response rates and nonresponse bias to participate in a survey. However, it is also important to note that the lower response rates generally observed for non-face-to-face modes are replicated in consent rates to follow-on elements. This includes additional tasks (e.g. biosample collection, app download, multi-day diary tasks) and data sharing (e.g. recontact and data linkage consent). For example, Understanding Society observed substantially lower response to self-collected dry blood spots among respondents who had participated in the initial survey online compared with those who had taken part face-to-face, even among those who had agreed to take part in this element (in other words, those who agreed online were much less likely to actually return their dry blood spots than those who had told an interviewer they would do so). The researchers hypothesise that without an interviewer to persuade and explain, people are much less likely to follow through with additional tasks like this (see case study in Annex A). The Health Survey for England push-to-telephone survey during the pandemic also reported lower agreement to a follow-up face-to-face biomeasure visit.[39] This implies that even if physical measures remain face-to-face, response to these elements may be lower if the initial interview is by another mode.
Understanding Society have also found that consent to data linkage is around 20 percentage points lower for those who take part online compared with those who take part face-to-face (Jackle et al, 2022). At the time of writing, they were still exploring the reasons for this but had yet to find a way of adapting their approach (e.g. through changing incentive structures or amending the way in which consent is requested) that negated this difference. This finding has also been replicated on other studies, including Next Steps, which concluded that “higher consent rates in face to face (78%), followed by telephone (71%) and finally by web (61%) is consistent with the hypothesis of higher consent rates in modes that allow for an interviewer persuasion" (Peycheva et al, 2021). Similarly, the British Election Study found lower levels of consent to link survey data to the voter register among those who participated by web or paper compared with face-to-face, as well as lower consent to recontact (see case study in Appendix A).
These lower response rates also increase the risk of differential non-response for these elements. In terms of the Scottish Government surveys, these findings have particular implications for agreement to provide bio measures on SHeS and agreement to the surveyor-administered physical property inspection on SHS, as well as potentially agreement to health record linkage on SHeS. It is also worth noting evidence from the British Election Study (see case study in Appendix A) that consent to recontact was lower among those that participated by web or paper rather than face-to-face. Again, this is relevant to all three Scottish Government surveys, which collect consent to recontact and have used this to support various additional research studies over the years.
Methods of reducing nonresponse bias
There are many methods that can potentially reduce non-response bias in survey research, all of which should be considered when reviewing mixed-mode survey design. Indeed, mixed-mode approaches in and of themselves can reduce the risk of specific variables of interest being linked to the mode. For example, following up an online survey with a paper survey would reduce the risk of the overall survey overestimating internet use, or excluding some of the groups identified as less likely to respond online compared with by paper (although where surveys have a lot of routing, as with all three Scottish surveys, creating a workable paper questionnaire may be challenging). One view from an expert interviewed for this study was that the more modes that can be included, the greater the potential to reduce nonresponse bias:
“For your traditional government survey, whether it is TLFS or the FRS or the Scottish health survey, multi-mode is, you know, you've got to have everything in your toolkit to mitigate the risks to your data quality, and that is not just response, but it is bias.” (Expert interviewee 4)
Incentives
Incentives have been shown to increase response rates across all modes, though they are typically more effective in studies with lower baseline response rates without incentives (Singer & Ye, 2013). For paper and push-to-web surveys, as response rates are generally lower, and there is no option for an interviewer to persuade a participant, incentives can form a more important tool to consider. This is particularly the case when it is not possible to use a named sample, as an incentive can help legitimise the research.
Many different incentive strategies are possible: incentives can be conditional (i.e. provided on completion of the task), or unconditional (i.e. provided as part of the invitation), and monetary (e.g. money or gift vouchers) or non-monetary (e.g. tote bags or pens). Incentive strategies can provide the same incentive to everyone throughout the fieldwork period or vary by time of complete (e.g. an early-bird incentive to encourage early completion, or a late incentive to encourage non-responders) or respondent demographics (e.g. higher incentives for groups less likely to respond). The amount can also vary – Singer and Ye’s (2013) review found no reliable evidence to indicate the set value for an effective incentive.
Monetary incentives have generally been shown to be more effective in increasing response rates than non-monetary incentives (Singer & Ye, 2013; Church, 1993; Singer et al, 1999) and unconditional incentives to be more effective than conditional incentives (Singer, 2002, Ernst Stahli & Joye, 2016, Simmons & Wilmott, 2004).
Ryu, Couper and Marans (2006) found that monetary incentives were more effective than non-monetary incentives in a postal survey, but no difference in response rate between the two incentive conditions was found in the face-to-face survey as other doorstep persuasion techniques meant the type of incentive had less influence.
Simmons and Wilmott cite a 1993 meta-analysis of incentives on postal surveys which found that, compared with the no incentive group, response rates increased by an average of 19.1 percentage points when the incentives were unconditional compared with an average increase of 4.5 percentage points for conditional incentives. However, they also note that sending unconditional incentives to ineligible households or those that do not open the mailing may not be seen as a good use of the public purse. This is particularly relevant in the context of push-to-web surveys – the lower the baseline (unincentivised) response rate of a survey, the less cost-effective it will be to administer unconditional incentives, as so many of them will be “wasted”. This helps explain why in general, it remains more common for unconditional incentives to be used on f2f surveys (often in conjunction with a conditional incentive), but far less common for unconditional incentives to be used on push-to-web surveys. A notable exception is the recent European Social Survey experiment (see case study in Annex A), which sent £5 cash as an unconditional incentive (as well as £10 cash conditional), and achieved a much higher response rate than many push-to-web surveys in the UK (but presumably at a higher per-interview cost).
There are studies that indicate monetary incentives have a greater effect on groups less likely to take part in research more generally (e.g. younger people, those from deprived areas, and those from minority ethnic backgrounds), which suggests a likely impact in reducing bias (e.g. see Mack et al, 1998; Singer & Kulka, 2002; McGonagle and Freedman, 2017; and Laurie, 2007). Non-monetary incentives can be more effective among groups already more likely to respond, or to specific sub-populations interested in the gift, so may not be as useful in reducing nonresponse bias. As discussed above, Webborn et al (2022) found that while non-monetary incentives increased the response rate, they also increased the skew in respondents towards those from less deprived areas and higher household incomes.
Another issue to consider is the quality of response if those who would have otherwise refused are persuaded to respond for the incentive. Jäckle and Lynn (2008) found incentives increased item nonresponse in a panel survey but increased the total amount of data gained from incorporating the incentive through increased unit (household/individual) response rates.
Taken together, the evidence indicates that an effective incentive strategy will likely vary depending on the survey mode, topic, non-response bias concerns, budget constraints, and survey population. Surveys that are considering changing or mixing modes commonly test different incentive strategies alongside testing new mode designs (see examples in the case studies in Annex A).
Multiple and tailored contact strategies
Multiple contact strategies have been shown to increase overall response rates and reduce non-response bias. For instance, on postal surveys, those who respond to later reminders are more likely to be younger, from more deprived areas, and from ethnic minority backgrounds than earlier mailings, and all those groups are less likely to respond to surveys overall. Therefore, particularly with push to web and paper surveys, it is important to account for multiple contacts, and vary each contact by timings, motivation, and method as much as possible, to motivate different types of people (for more details see The Tailored Design Method by Dillman et al, 2014).
Where nonresponse bias rather than overall response rates is the focus, it may also be more effective to tailor contact strategies (Groves and Heeringa, 2006). For example, if certain populations are less likely to respond online, it may be more appropriate to invite them using an offline mode at an earlier stage. Additional contacts may also be targeted at groups where there is most concern (e.g. low-responding subgroups of particular interest), in order to prioritise budget and improve weighting efficiencies.
For cross-sectional general population surveys like SHS, SCJS and SHeS, targeting of contact strategies (or incentives) generally needs to be based on information available at the address level (since until the household or participant opts in to the survey, nothing is known about their individual characteristics).[40] Examples of surveys that have taken this approach include the TLFS, who are using a face-to-face knock-to-nudge approach to follow-up households only in geographic areas that tend to receive lower responses (e.g. more deprived and more urban areas). The Participation Survey and Community Life Survey have both attempted to combine address level data with data from other sources to estimate the likelihood of a household containing older respondents, in order to inform targeted distribution of paper copies of the survey (the survey takes a web first approach). However, it was also reported that using administrative data to try and estimate the age of households and number of adults was not always particularly successful. As reported in the Community Life Survey 2021/22 technical report, while there was a positive correlation between the number of adults in the household and that expected through administrative data: “Just over half (52%) of the CACI predictions were exactly right but a set of predictions based only on knowledge of the overall population distribution would be exactly right in 40% of instances” (Kantar Public, 2021).
Tailored design
In addition to offering multiple modes, incentives, and targeting contact strategies, more subtle design features, such as the particular content or look of invitation materials, can also be varied, although these tend to have less impact on the survey response. Moreover, again these approaches require being able to estimate which households would be more or less likely to respond to different design features before the interview – something that is more difficult with cross-sectional surveys, which are generally reliant on the data available about addresses.
Reducing item nonreponse
All methods that aim to reduce non-response bias, such as incentives, tend to act at the survey level. However, as noted previously, nonresponse bias is item-specific. Interventions are likely to be more successful in relation to some survey estimates than others and there may be a need to consider what estimates should drive any strategy to reduce non-response bias. This is a particular issue for surveys such as the SHS that cover a wide range of different topics.
Methods for minimising item non-response, as opposed to non-response at the survey level, tend to focus on ensuring good questionnaire design and minimising burden for respondents. Imputation can be used to compute missing values by modelling data with complete information. For example, this is currently used extensively in the SHS income data processing (Martin, 2009).
Adjusting for nonresponse bias
As discussed above, all modes are associated with some nonresponse bias, meaning that every survey will almost certainly need to consider how it adjusts for this in analysis. This is generally done via weighting the data to match the best available population estimates on key variables (usually geographic and demographic indicators, like gender, age and region). However, it is important to remember that, while weighting can reduce the extent of nonresponse bias, it cannot eliminate it, as nonresponse can be related to unobserved variables which cannot be included in a weighting scheme. Additionally, weighting tends to be undertaken at the survey level and may vary in its effectiveness across different estimates.
Weighting for mixed mode surveys usually ignores completion mode, seeking only to reduce the net non-response bias remaining after all modes have been offered. This approach also has the advantage of avoiding further complexity in weighting approaches, both in terms of delivery, but also in terms of communication of results (Maslovskaya et al, 2020). However, some researchers factor mode into the design of weighting models, to attempt to control for mode effects within the survey at the same time. For example, Pfefferman’s multi-level regression model to adjust for non-response takes into account mode of completion, while treating non-respondents as another mode, and adjusts for whether or not the complete was proxy or not (Pfeffermann and Preminger, 2021). An expert interviewed for this study noted that mixed mode designs can require more input from experienced statisticians in the data processing and weighting stages, which can increase timescales for data delivery and create practical challenges in terms of availability of people with the correct skills to conduct this work.
More fundamentally, it is also important to recognise that the weighting process cannot completely eliminate nonresponse bias. If those from deprived areas are underrepresented in a survey, for example, and are therefore given a higher weight to match the proportions in the sampling frame or target population, the implicit assumption is that the participants from deprived areas who responded to the survey are representative of those who did not respond. But this may not be the case. The same applies across other variables included in weighting.
Moreover, the variables it is possible to weight to are limited to those you can benchmark against other, independent sources, like the census or administrative data. For example, the potential impact of non-response bias on the SHS has been explored previously by including the survey in the Census-linked study of survey non-response carried out by ONS following the 2001 census. This compared the census characteristics of different categories of responding and non-responding households to identify variables that were independently associated with non-response, informing adjustments to the SHS weighting approach (Freeth and Sparks, 2004). However, there are also many factors that might impact on nonresponse bias that it is not possible to weight to. The 2004 Scottish Crime and Victimisation telephone survey experiment is particularly relevant in this regard. The author of the independent review of this experiment, which compared the telephone survey with data collected face-to-face, found both that it was impossible to develop a weighting strategy that adequately corrected all the demographic biases in the sample, but more fundamentally that the sample appeared to be biased towards people who had experienced crime. There was strong evidence that those who had been victims were simply more likely to agree to a telephone interview than they had been in the face-to-face survey. The report on the calibration exercise to compare the two thus concludes:
“We have been unable to devise a weighting approach that satisfactorily corrects the many demographic biases that are observable in the data but even if these biases could be corrected, our conclusion is that the telephone survey suffers a more fundamental and irresolvable bias resulting from what appears to be a tendency for non-victims to be more likely to refuse to participate.” (Hope, 2005)
The limits on what can be corrected by weighting was also discussed by expert interviewees as a limit on the ability to control nonresponse bias associated with changes in mode. For example, one interviewee highlighted the challenges of identifying factors that can be included in weighting that would adequately adjust for differences in propensity to respond to health surveys between those who may be more or less likely to experience poor health. In summary, the key point here is that whatever nonresponse issues are associated with the particular mode or combination of modes used on a survey, these are likely to remain, at least to an extent, even after post-survey adjustment and weighting. There is no guarantee that weighting would be either less able, or more able, to correct for nonresponse bias in a mixed mode context than in a single-mode context.
| Priority considerations / issues | Potential mitigations | Remaining issues and trade-offs | |
|---|---|---|---|
| Cross-cutting issues | Response rates While there is considerable variation in response rates between surveys conducted using the same mode or modes, in general, for cross-sectional surveys, F2F has been associated with higher response rates than telephone, web or paper surveys. However, there is some evidence that the difference in response rates between F2F and web surveys may be starting to change (see, for example, ESS Round 10 parallel testing). Response rates are also continuing to decrease over time across modes, and there is an ongoing debate about what constitutes an ‘acceptable’ response rate, or what the ‘norm’ might be in terms of response rates to F2F surveys post-Covid. Item nonresponse is higher in paper questionnaires (since computer-aided checks are not possible) and tends to be lower for interviewer administered questionnaires. There is evidence that web surveys have higher item nonresponse than telephone or F2F, particularly for complex or sensitive questions. Response rates primarily matter because they are associated with risk of nonresponse bias. However, meta-analysis and evidence from the Scottish Government surveys has found fairly weak association between overall survey response rates and nonresponse bias. Higher response rates can be associated with greater bias depending on what drives response, while lower response rates do not necessarily indicate higher bias. Nonresponse bias is also item-specific – so some variables may be more impacted by lower survey response rates than others. | Incentives can increase response rates across all modes but are particularly effective for those with lower baseline responses. They are, by extension, particularly important to consider for push-to-web and paper surveys. However, unconditional incentives, although generally more effective in raising response, may be considered more problematic on low response rate surveys as so many will be ‘wasted’. | Determining an ‘acceptable’ current or future response rate for the Scottish Government surveys is likely to be difficult given the current level of uncertainty among experts and stakeholders on ‘norms’ (and on the importance of response rates per se). |
Mode and nonresponse bias Each mode has biases in terms of who is more or less likely to respond via that mode.
|
Multiple contact strategies can increase overall response rates and reduce nonresponse bias. Monetary incentives have a greater impact on those with a lower propensity to respond (and are therefore more likely to reduce nonresponse bias). The evidence on nonmonetary incentives is more mixed – there is some evidence to suggest they work better for groups already more likely to respond, and may therefore increase nonresponse bias. Weighting is used to reduce nonresponse bias but cannot eliminate it. The nonresponse issues associated with the particular mode or combination of modes used on a survey are likely to remain, at least to an extent, even after post-survey adjustment and weighting. | Multiple contacts and tailored contact strategies are particularly important to web and paper surveys and should form part of design and testing. However, there are practical limitations in the extent to which contact strategies can be targeted at individuals less likely to respond, since in general only address level data is available at the contact stage. Many different incentive strategies are possible. Testing optimal incentive strategies should ideally form part of testing any proposed mixed mode design, given the potential impact on nonresponse bias. A core challenge that needs to be considered with push-to-web designs is the risk that those more engaged in the topic will be more likely to respond. Strategies to reduce nonresponse bias may have different impacts on different items – this also needs to be considered in developing and testing such strategies on mixed mode surveys. | |
| SHS | There is some evidence that variables associated with civic responsibility (e.g. volunteering, which is measured on the SHS) are more strongly correlated with survey response – surveys with lower response rates tend to find higher levels of volunteering. Consent to additional tasks tends to be lower when respondents take part in initial interviews online (see for example evidence from Understanding Society and the Health Survey for England ( HSE)). This could impact the proportion agreeing to the physical survey on the SHS | See above re. factors that may reduce nonresponse (though lower responding modes may still be associated with nonresponse bias on these types of measures). This would need to be factored into design and testing of any new modes – one option might be to increase the sample size for those asked to opt into the physical survey (and potentially to select a sub-sample). | This highlights the challenge of assessing the impact of a potentially lower response rate on surveys – it may impact differently on different measures. This is something to factor into any plans and testing. |
| SCJS | There is evidence that those who are victims of crime are more likely to respond to web crime surveys than F2F surveys (see for example development work on the Crime Survey for England and Wales) – echoing similar findings for telephone from the 2005 Scottish Crime and Victimisation telephone survey. | See above re. the SHS. While it is possible to incorporate elements that reduce overall nonresponse, these may not necessarily reduce this specific nonresponse bias. | This would require very careful consideration and testing if online was to form part of the future mode design for the SCJS. The CSEW are still testing possible web options, so there may be scope to learn from this work. |
| SHeS | As noted, consent to additional tasks tends to be lower when respondents take part in initial interviews online than when they take part F2F. This has impacted on agreement to biomeasures on other studies (see HSE and Understanding Society). | See above re. SHS physical survey. | See above re. SHS physical survey. |
Contact
Email: sscq@gov.scot
There is a problem
Thanks for your feedback