Publication - Progress report
National innovation strategy: scorecard - 2024 update
The national innovation strategy first published an innovation scorecard in 2023, tracking Scotland's performance against key metrics compiled from publicly available data. In the first annual update to the scorecard, Scotland’s innovation performance is compared to UK and global peers.
2. GERD (Gross Expenditure on R&D)
2.1 Ecosystem
- Investment
2.2 Performance Assessment
- Performance to be Confirmed
2.3 Description
- Gross Expenditure on R&D (GERD) measures R&D expenditure investment in Business (BERD), Higher Education (HERD), Government (GovERD) and Charity (PNP) sector and is a proxy for total R&D spend. This is expressed as a percentage of GDP to allow for regional and international comparisons.
- R&D and related concepts follow internationally agreed OECD definitions, as published in the Frascati Manual (2015). GERD is the OECD preferred measure of R&D activity for international comparisons.
- Also tracked for insight and analysis are the main GERD sub-categories of Business Enterprise (BERD), Higher Education R&D expenditure (HERD) and Government R&D expenditure (GovERD).
2.4 UK Regional Benchmark for GERD Main Sub-categories
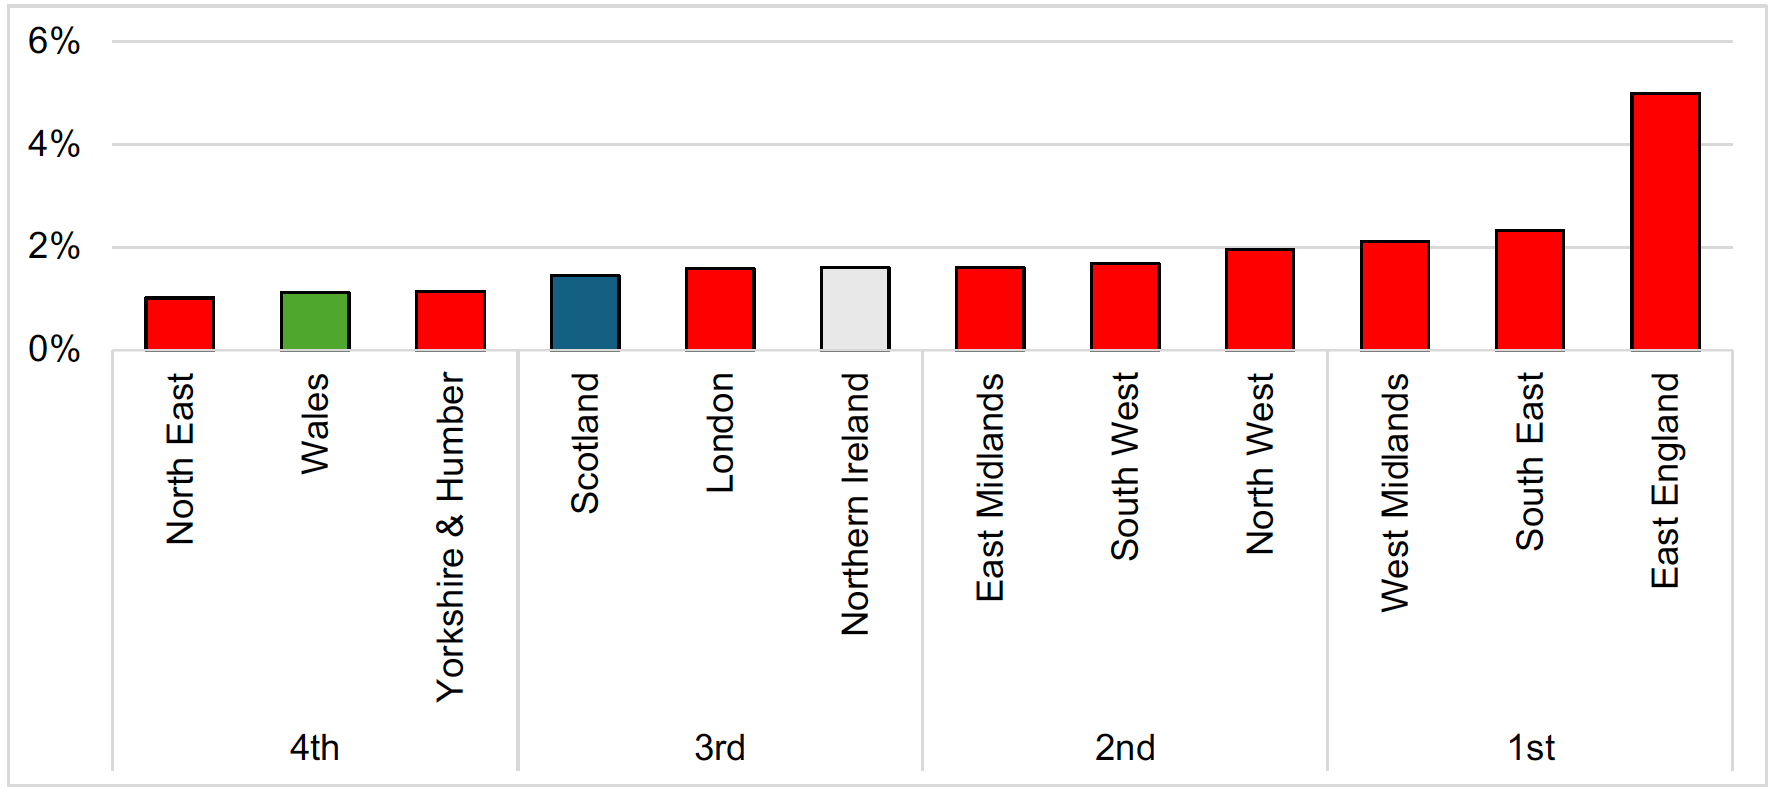
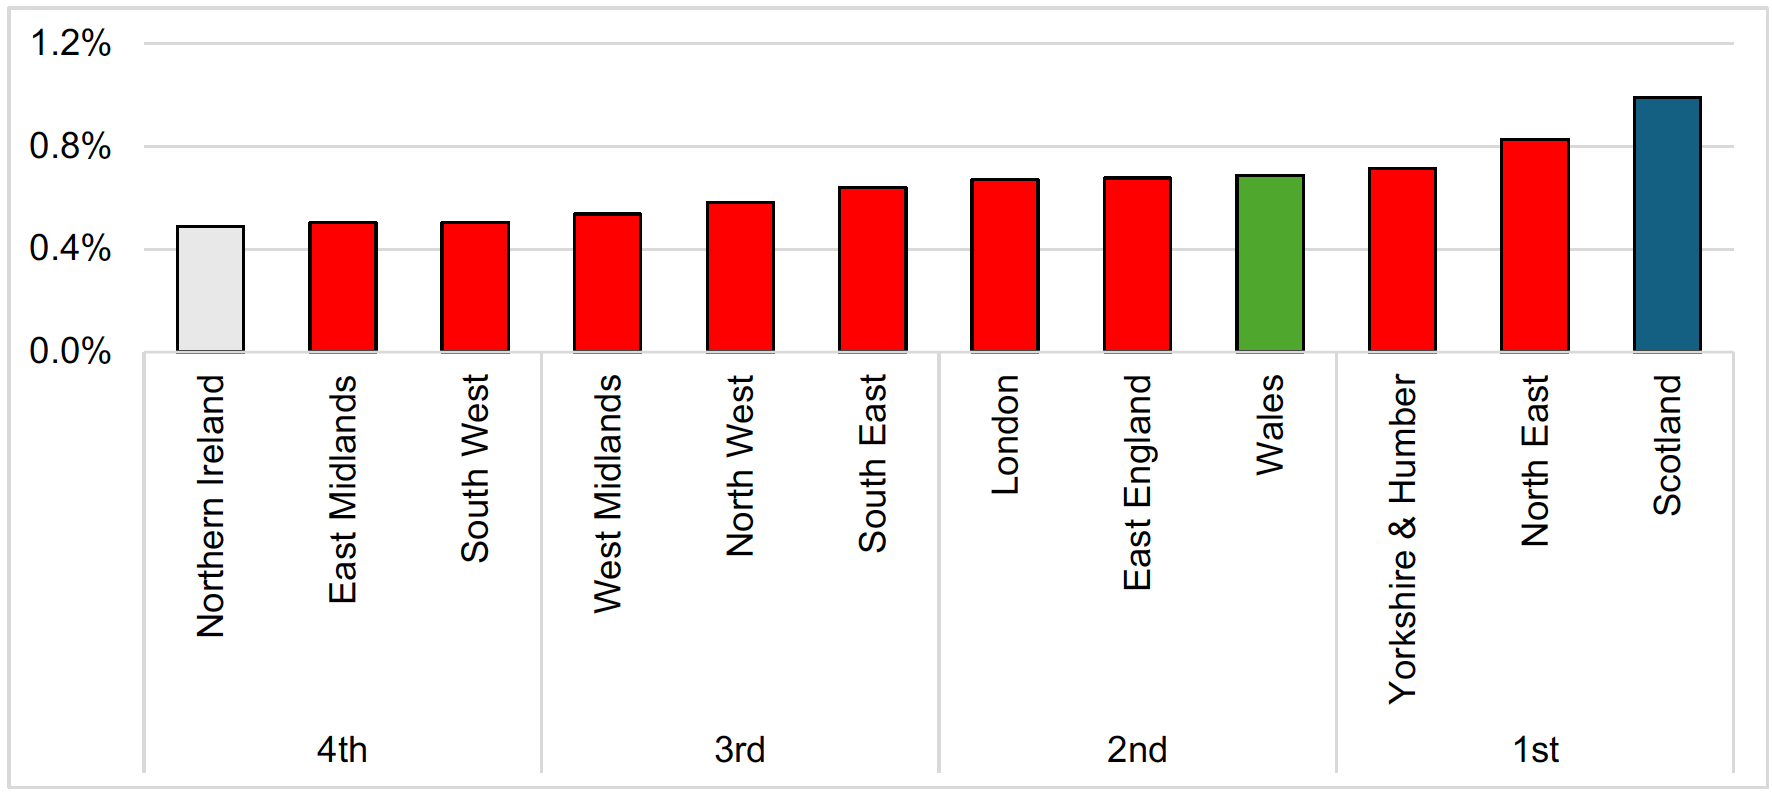
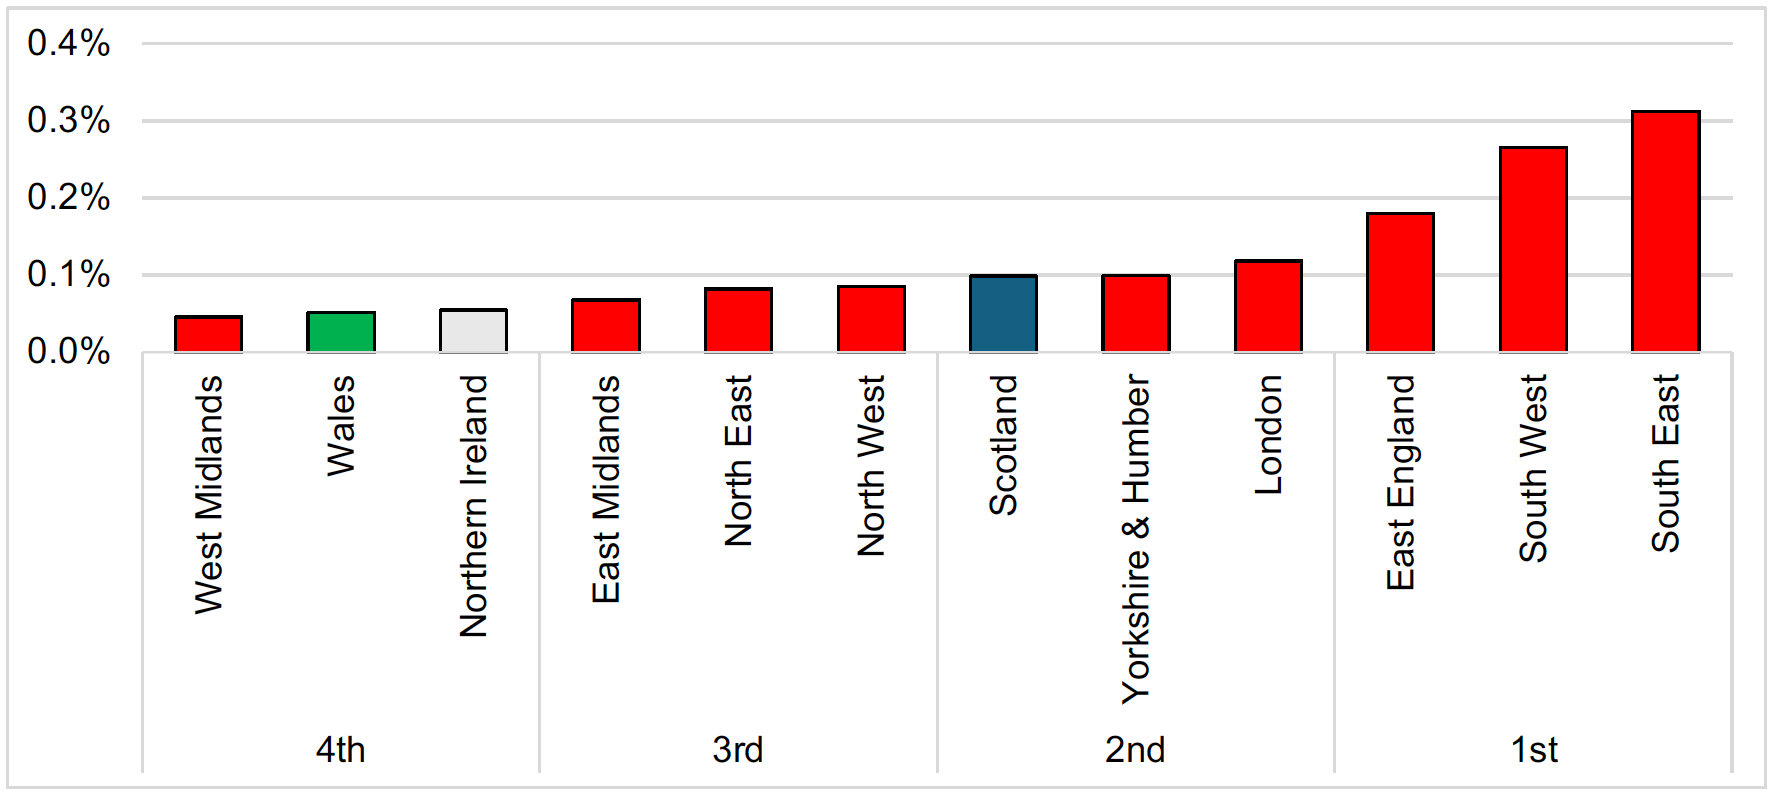
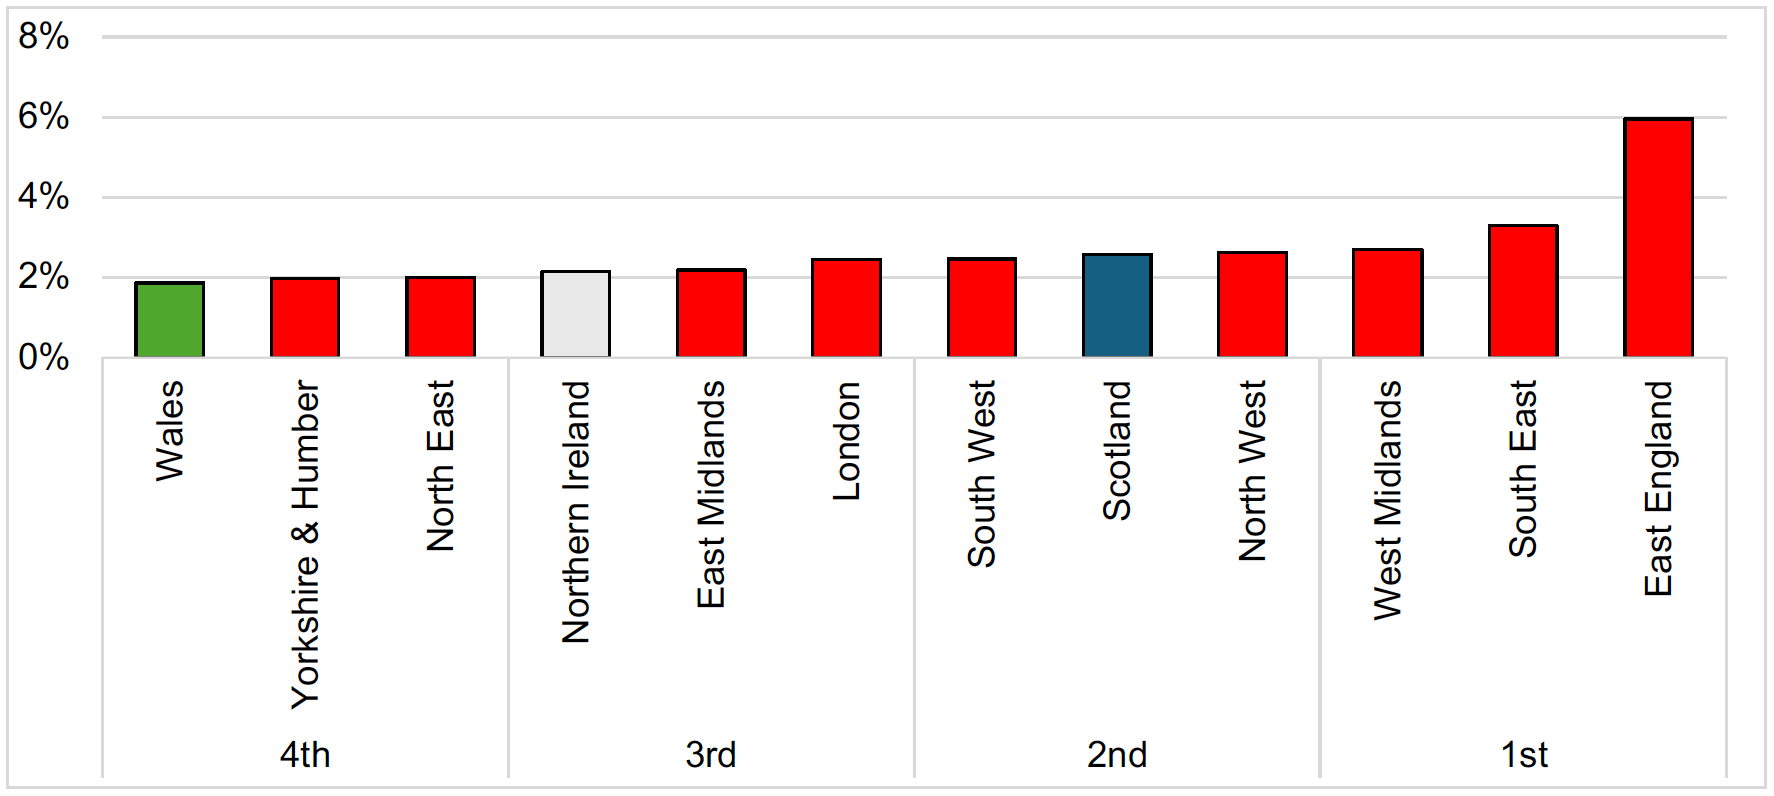
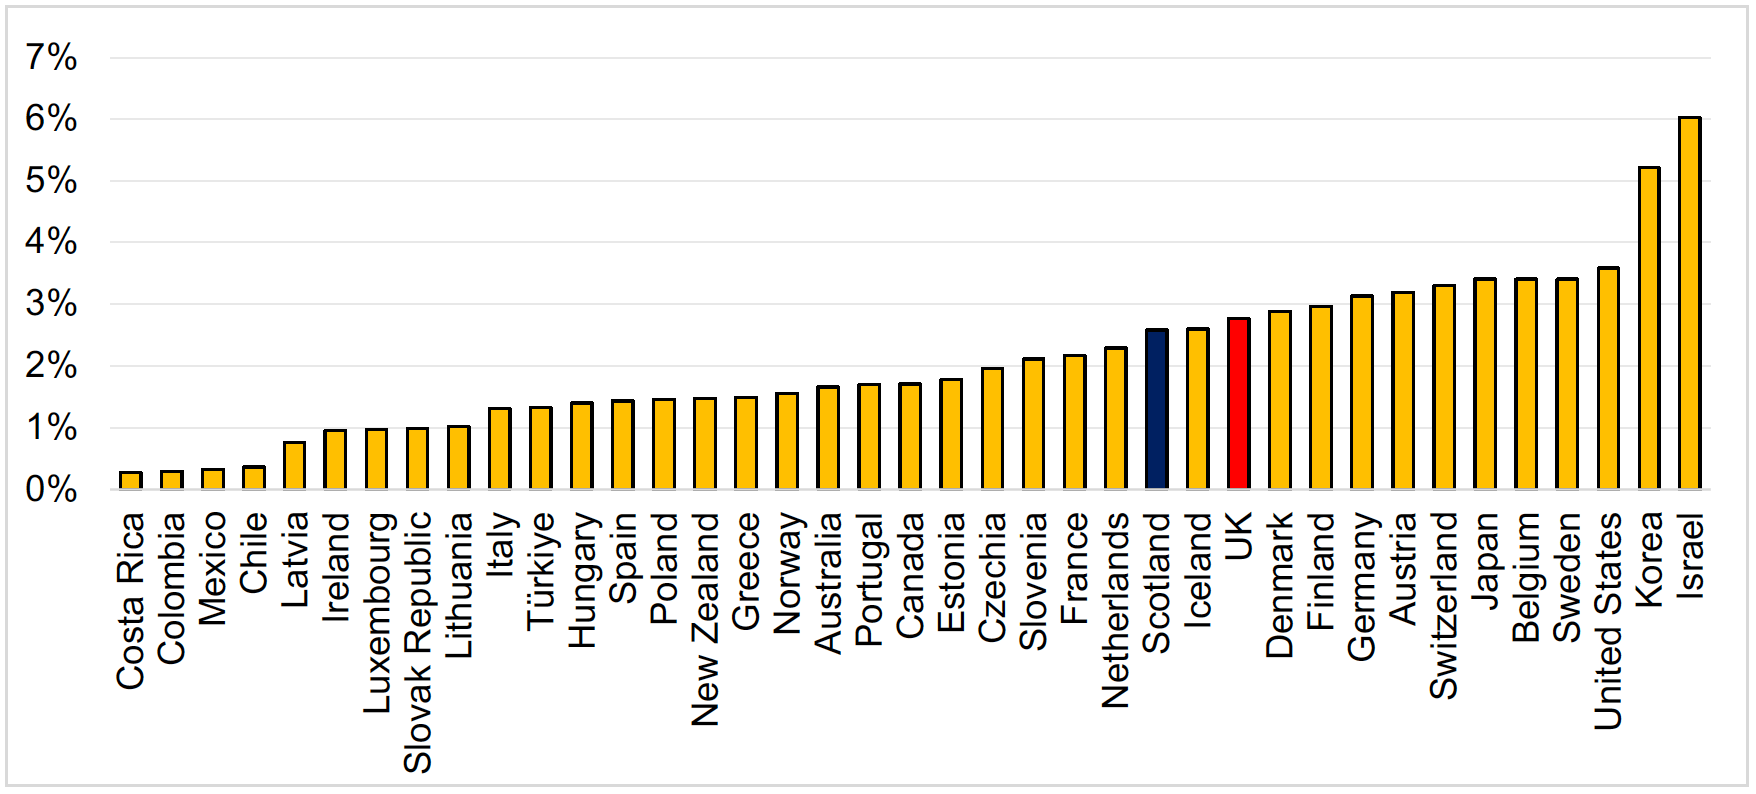
- While Scotland is in the 2nd quartile of UK regions for GERD (at 2.58% of GDP in 2022), it is in the 3rd, 1st, and 2nd quartiles for BERD (1.45% in 2022), HERD (0.99%) and GovERD (0.10%) respectively.
2.5 Current Performance
| R&D as % of GPD | 2022 | 2021 |
|---|---|---|
| GERD | 2.58% | * |
| BERD | 1.45% | * |
| HERD | 0.99% | 0.98% |
| GovERD | 0.10% | 0.10% |
*There is a time series break for GERD/BERD
2.6 Previous Year and Time Series
- ONS have developed a new methodology for BERD estimates, which introduces a break to GERD time series.
- While some detail data have been reintroduced in 2022, breakdowns by region for 2018-2021 are not available and will be published in 2025.
2.7 UK Regional Benchmark
- For GERD, Scotland is in the 2nd quartile.
2.8 International Benchmark
- EU27 average GERD is 2.11% and OECD is 2.73%.
- Scotland is 14th and UK 12th out of OECD countries (second quartile).
2.9 About the Data
- Current Dataset: Gross expenditure on research and development Scotland 2022 - gov.scot (www.gov.scot) (Released 25 September 2024)
- Next Release: September 2025
Contact
Email: innovation@gov.scot
There is a problem
Thanks for your feedback