Publication - Progress report
National innovation strategy: scorecard - 2024 update
The national innovation strategy first published an innovation scorecard in 2023, tracking Scotland's performance against key metrics compiled from publicly available data. In the first annual update to the scorecard, Scotland’s innovation performance is compared to UK and global peers.
4. Academic Income from Business and Community Interactions
4.1 Ecosystem
- Concept
4.2 Performance Assessment
- Performance Worsening
4.3 Description
- Academic Income from Business and Community Interactions (in cash terms) is monitored as an indicator of the level of innovation activity occurring between higher education and business. A total of 7 types of academic incomes are captured this monitor, categorised as contract or other income:
Contract* income includes:
1) Consultancy contracts,
2) Contract research
3) Facilities and equipment related services
Other** income includes:
4) Collaborative research involving public funding
5) CPD and Continuing Education courses
6) Intellectual Property (incl. sale of shares in spin-offs)
7) Regeneration and development programmes
4.4 Time Series
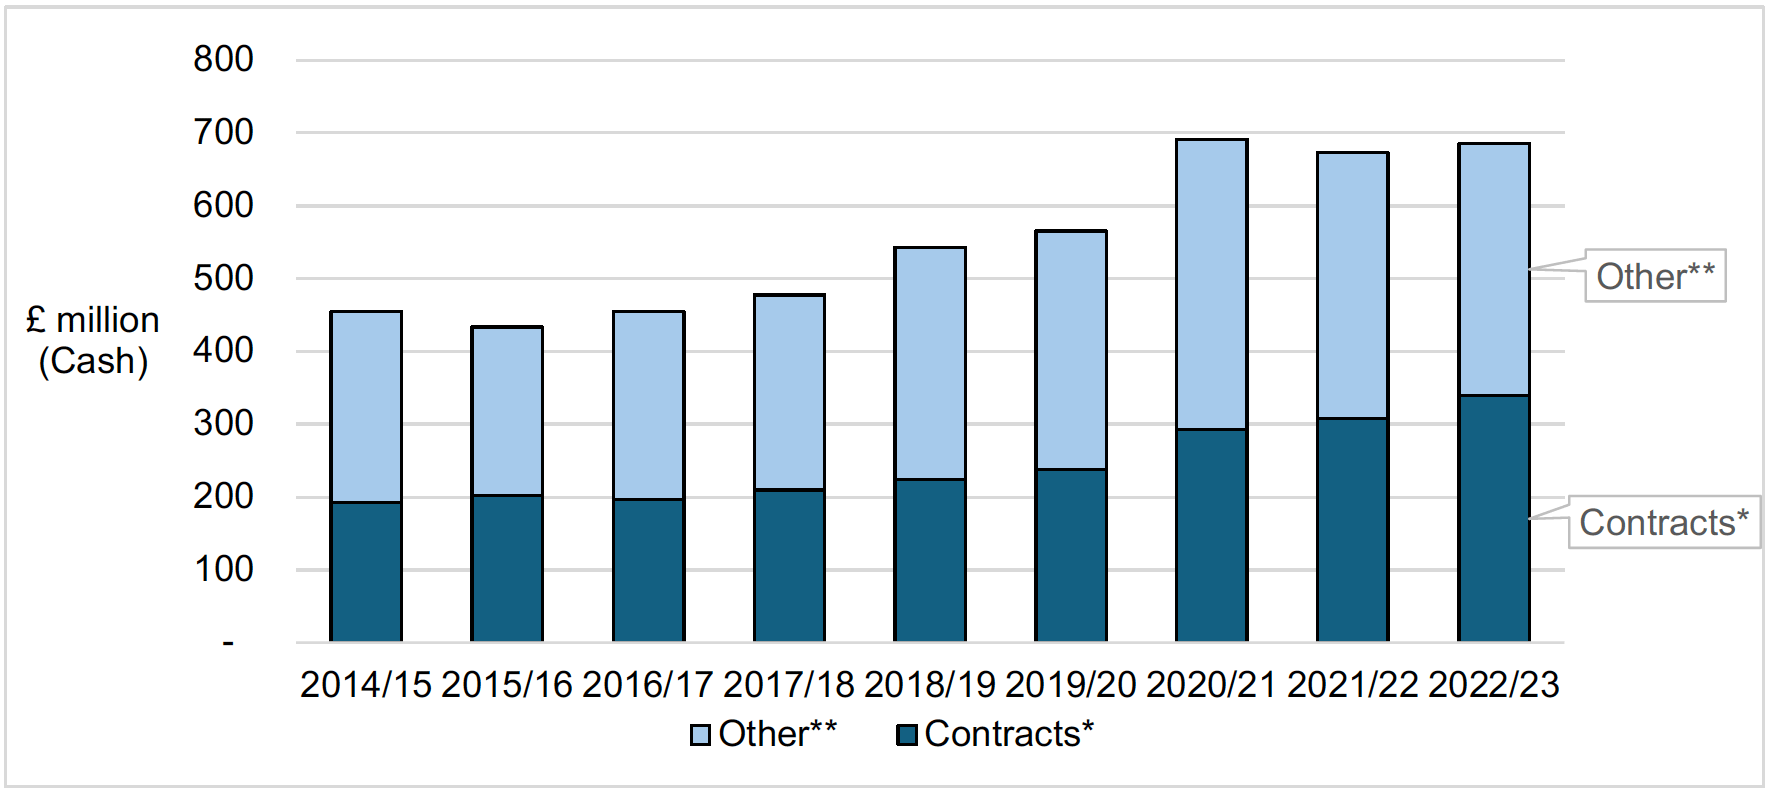
- Academic income from business community interactions has grown by 44% in cash terms over the past 5 years. Over the same period, contract income grew by 62% while other incomes are up by 29%.
4.5 Current Performance
- Total income in 2022/23 was £685m, up 2% in nominal terms, but down 4% in real terms compared to 2021/22.
- The value of contracts held in 2022/23 was £340m, up 11% in cash terms and 4% in real terms compared to 2021/22.
- Other income is £345 million.
4.6 Previous Year Performance
| £m | 22/23 | 21/22 | %∆ |
|---|---|---|---|
| Total | £685m | £717m | (4%) |
| Contract | £340m | £328m | 4% |
| Other | £345m | £365m | (11%) |
- Nominal ‘Total’ and ‘Other’ incomes peaked 2020/21.
4.7 UK Regional Benchmark
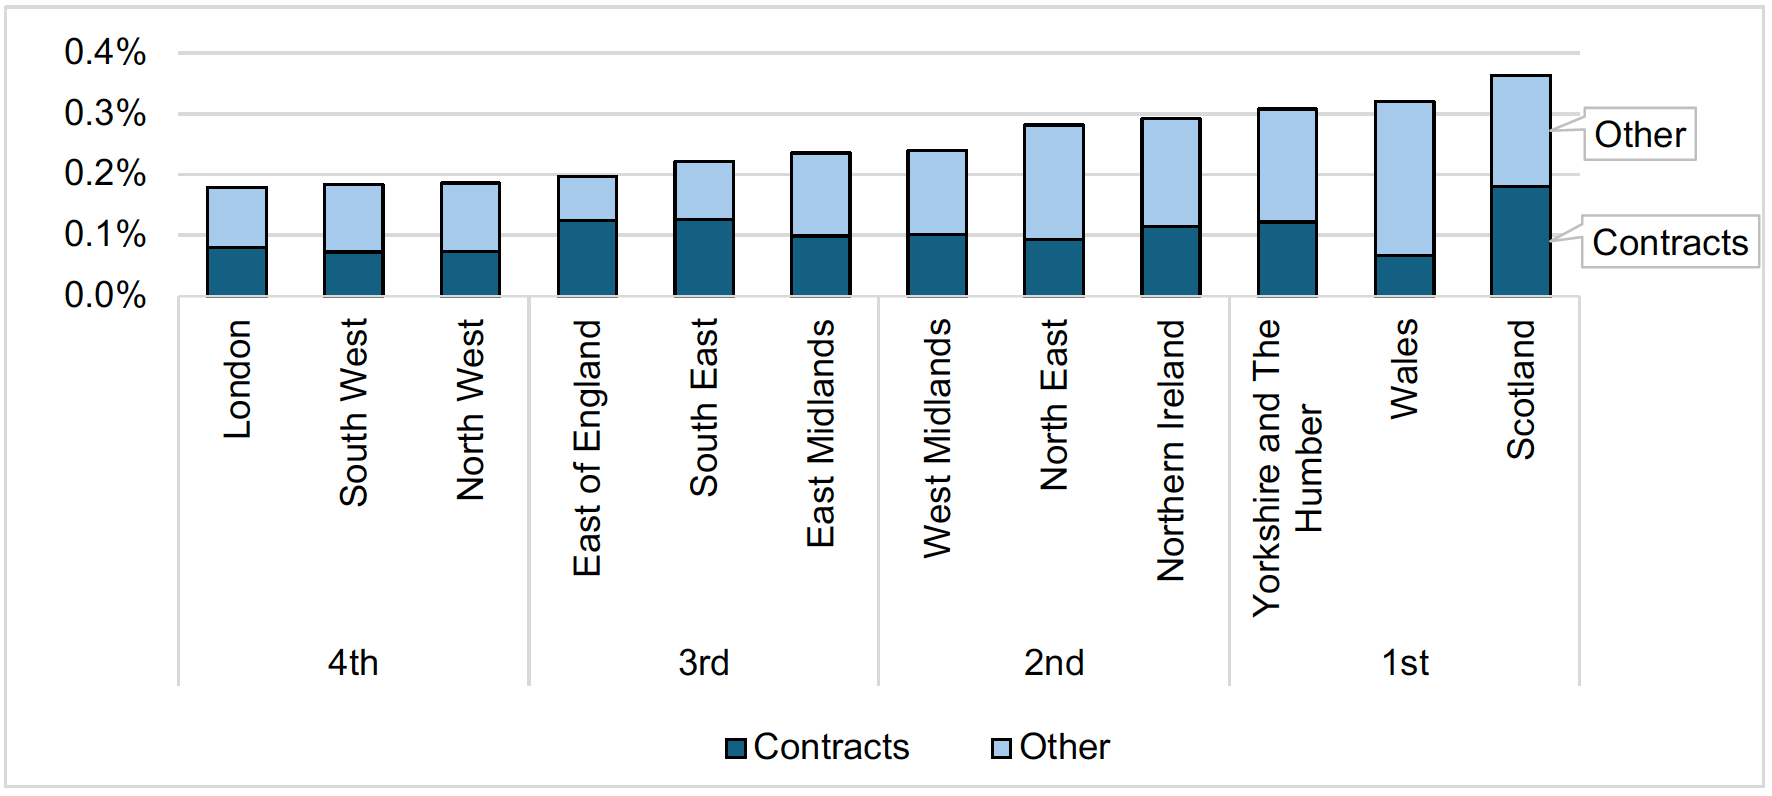
- Scotland ranks 1st for Total, 1st for Contracts and 4th for Other as percentages of GDP.
4.8 International Benchmark
- There are no readily available international comparisons.
4.9 About the Data
- Current Dataset: Higher Education Statistics Agency (HESA): Income from business and community interactions 2014/15 to 2022/23 (Released April 2024)
- Next Release: April 2025
Contact
Email: innovation@gov.scot
There is a problem
Thanks for your feedback