Publication - Progress report
National innovation strategy: scorecard - 2024 update
The national innovation strategy first published an innovation scorecard in 2023, tracking Scotland's performance against key metrics compiled from publicly available data. In the first annual update to the scorecard, Scotland’s innovation performance is compared to UK and global peers.
5. Risk Capital (Deals Under £10 million)
5.1 Ecosystem
- Convert
5.2 Performance Assessment
- Performance Worsening
5.3 Description
- Equity investment is an effective indicator of innovation which is closer to the market. Although not all ‘deals’ are innovation driven, risk capital is considered a good proxy for innovation as evidence shows top sectors for deals are generally those associated with high levels of innovation, with university spinouts particularly associated with innovation. The term "deal" describes risk capital obtained during an announced or unannounced equity investment rounds.
- The number and value of risk capital deals in Scotland are tracked by Scottish Enterprise, including deals below £10m, categorised as deals below £2m and deals between £2m and less than £10m.
- All figures are in cash, nominal terms. Performance assessment based on real terms performance.
5.4 Time Series
- According to the Scotland’s Risk Capital Market: Benchmark Analysis 2023, Scotland’s underlying market remained robust in 2023, higher than the years before the equity funding heyday of 2021.
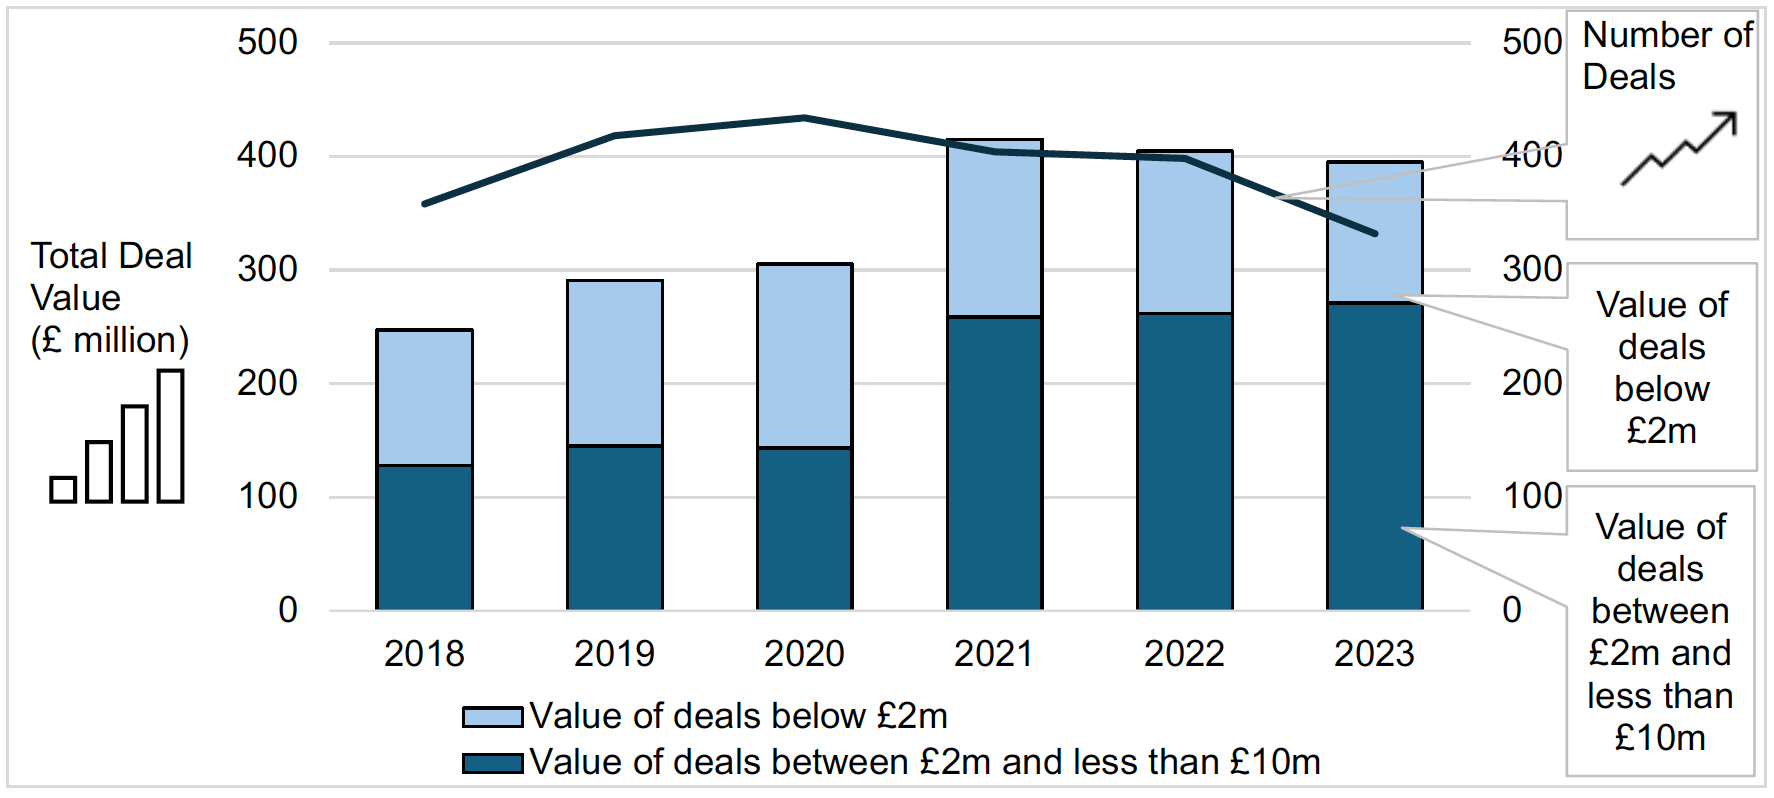
5.5 Current Performance
- In 2023, there were 332 deals under £10m, valuing £395m. Of which:
- 267 deals were below £2m, with value of £124m.
- 65 deals were between £2m and less than £10m, with value of £271m.
- 49 deals were for university spinouts, valuing c.£93m.
5.6 Previous Year Performance
- The number of sub-£10m risk capital deals declined by 17% in 2023 from 398 in 2022.
- The value of deals in Scotland below £10m fell by 2% from £405m in 2022 (a 9% decrease in real terms).
- The value decline was driven by falls in deals below £2m.
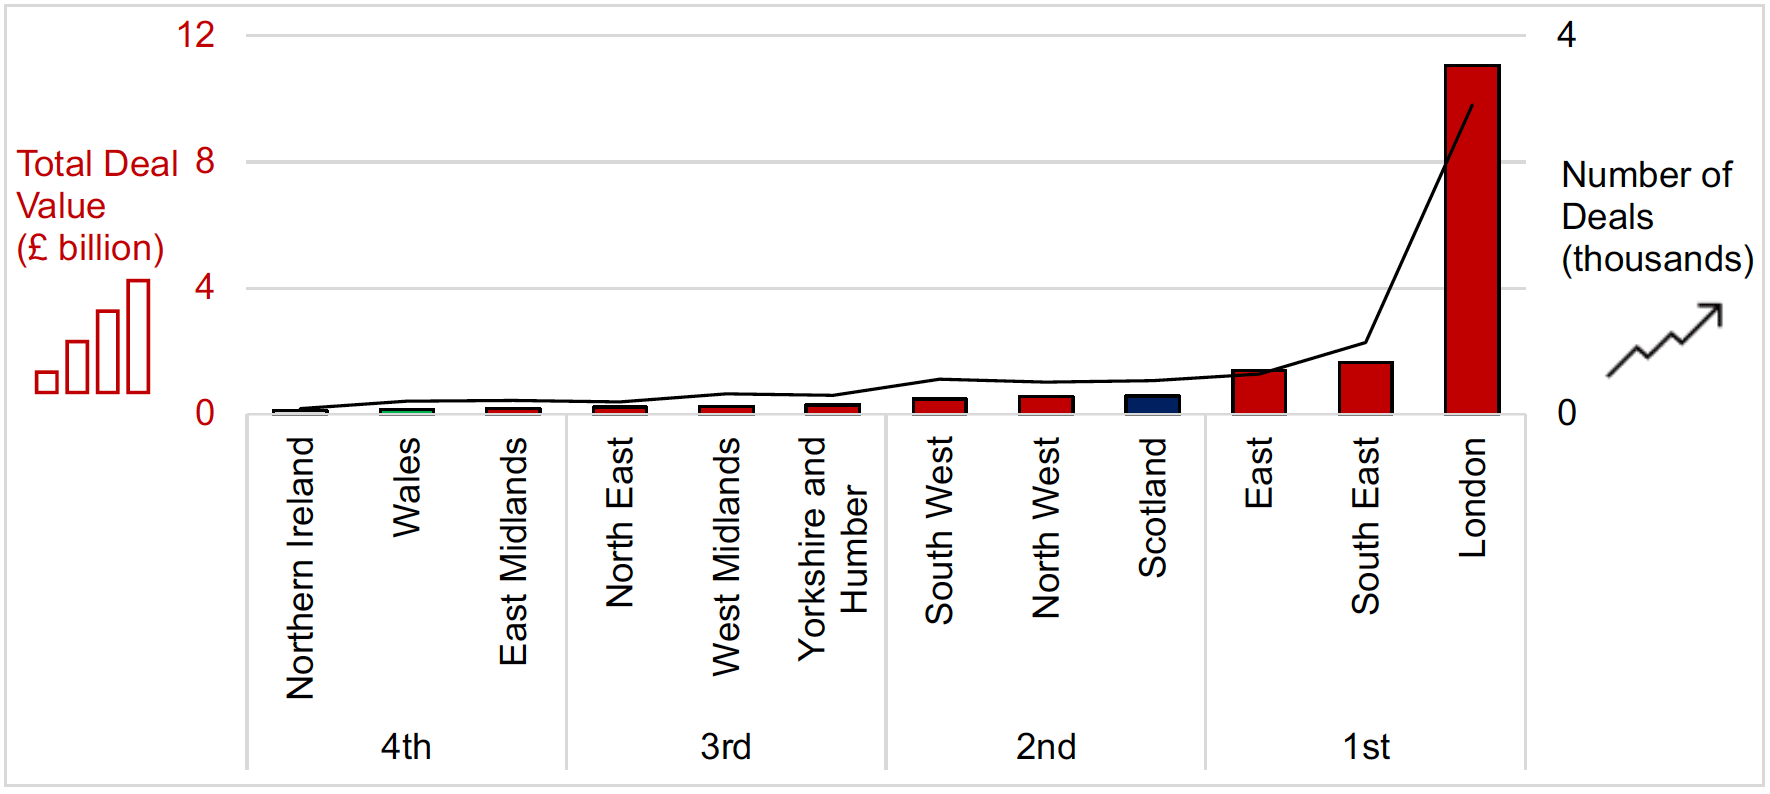
5.7 UK Regional Benchmark
- Scotland ranks 4th in terms of the total value of all deals (of any value).
5.8 International Benchmark
- Limited international comparability.
- In 2023, the UK retained its position as the most active European market, coming in after the US and China globally (HSBC Innovation Banking and Dealroom.co.uk, UK Innovation 2024 Forward Look, Jan 2024).
- Within this context, Scotland has maintained its relative position compared to the UK.
5.9 About the Data
- Current Dataset: Scottish Enterprise (SEnt): Scotland’s Risk Capital Market – Benchmark Analysis 2023 (Released 22 July 2024)
- Next Release: July 2025
Contact
Email: innovation@gov.scot
There is a problem
Thanks for your feedback