National Standardised Assessments for Scotland: national report 2022 to 2023
Summary of outcomes at a national level on the 'Scottish National Standardised Assessments' (SNSA) and ‘Measaidhean Coitcheann Nàiseanta airson Foghlam tron Ghàidhlig’ (MCNG) (collectively known as NSA) in the 2022 to 2023 academic year.
4 Writing
4.1 The scope of the writing assessment
In the 2022 to 2023 academic year, National Standardised Assessments in writing were available for P4, P7 and S3. At P1, learners were presented with a single assessment combining elements of reading and writing. This is referred to as the P1 literacy assessment. For more information on the P1 literacy assessment, please see Section 3: Reading/Literacy.
The assessments of writing were based on elements of Curriculum for Excellence (CfE), as articulated in the Benchmarks: Literacy and Gàidhlig, published in March 2017 and the Benchmarks: Literacy and English, published in June 2017.
4.2 Coverage of the Curriculum for Excellence
NSA is just one part of the range of assessments that teachers use in making their evaluations of children's and young people's learning. As a standardised assessment to be completed within a limited time, using items capable of being scored automatically, only some parts of the writing Benchmarks could be addressed. It was agreed that the writing assessments should be based on the assessment organisers Spelling, Grammar and Punctuation, which all fall under the curriculum organiser Tools for writing. Each of the items selected for inclusion in NSA writing assessments for the 2022 to 2023 academic year reflect the knowledge, skills understanding, and standards embedded within the Curriculum for Excellence Experiences and Outcomes for writing across the CfE Levels.
Spelling, Grammar and Punctuation were all substantially represented in the writing assessments for P4, P7 and S3, with Spelling having a slightly higher weighting in comparison with Grammar and Punctuation. This reflected the importance placed on this area of Tools for writing by the Scottish education experts involved in defining the basis of the assessment. The weighting across the three organisers for each stage in the NSA was roughly the same, and all three assessment organisers were addressed by at least five items in the stage's full set, and in each learner's assessment, regardless of which path they took through the adaptive system. As such, in the school-level reports, teachers received information about the relationship between the learner's overall outcome and organiser level outcome for each of these areas at an individual learner level. In the rest of this section, features of the assessments of Spelling, Grammar and Punctuation for the three stages are described, with examples of items for illustration.
The information in sections 4.2.1 - 4.2.3 apply to the SNSA. MCNG examples and descriptions can be found in sections 4.2.4 - 4.2.6 of this report.
4.2.1 SNSA Spelling
The writing assessment in the 2022 to 2023 academic year was designed to assess spelling words and strategies, covering the range of skills and the progression articulated in the Experiences and Outcomes – 'I can use a range of strategies and resources and spell most of the words I need to use, including specialist vocabulary, and ensure that my spelling is accurate. LIT 3-21a'; 'I can spell the most commonly-used words, using my knowledge of letter patterns and spelling rules and use resources to help me spell tricky or unfamiliar words. LIT 1-21a.’. At the lower levels, learners were assessed on their ability to spell relatively simple and commonly used vocabulary. As the difficulty of the spelling items increased, and in the upper stage assessments, children and young people were also asked questions to assess their knowledge of less familiar words. To answer the questions correctly, learners may have needed to rely on strategies, such as their knowledge of phonics, spelling patterns and rules, and at the highest level may have been asked to spell specialised vocabulary.
Throughout, spelling was assessed in context, using a range of formats. One format was the cloze style, in which learners had to select the correct spelling from a range of options, either in a single sentence or in a short passage. In another, learners had to identify the incorrectly spelt word in a sentence.
Figure 31 shows an exemplar Spelling item which could be used in the P4 writing assessment.
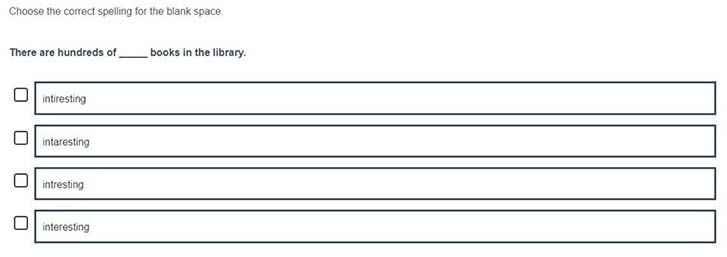
The item presented here requires learners to identify the correctly spelt word in a sentence, from a range of options. This item draws on the writing strategy of proofing and editing, which models for learners the importance of checking their writing to identify errors.
As can be seen in this P4 item, the context provided is a familiar activity and all the words in the stem are grammatically simple, common and relatively short. To answer this item correctly, the learner must know the correct spelling of the common word or know that the other options given are all spelt incorrectly. This item is in the middle (band 7) of the item difficulty range for P4.
4.2.2 SNSA Grammar
This organiser focuses on general grammar points, addressing the skills, knowledge and understanding articulated in the Experiences and Outcomes. At P4, for example, it assessed children's ability to link sentences using common conjunctions, such as 'and', 'because' or 'but', while at the higher stages, a fuller and more complex range of conjunctions was assessed. Items addressing the Grammar organiser also assessed usage of prepositions, verb forms, adjectives and pronouns. At P4, the items tended to relate to simple sentences.
At P7 and S3, the challenge was increased by introducing longer, more complex language structures, such as compound sentences, conditionals and negative clauses; or by asking questions for which the child or young person needed to identify the relationship between two pronouns, where there was some ambiguity. In summary, as well as the grammar itself becoming more challenging, the contexts in which learners were asked to demonstrate their skills became more complex in the higher stage assessments.
Figure 32 presents an example of an S3 Grammar item, a typical example of the cloze (or gap fill) writing items. As in the reading assessments, SNSA writing items were often presented as 'units' – a group of items based on a single piece of stimulus. These units enabled more sustained context to be provided, and were used to assess all three writing assessment organisers. This stimulus text uses quite commonplace, simple vocabulary, but the sentence structures are relatively complex, allowing for a range of grammatical forms to be addressed.
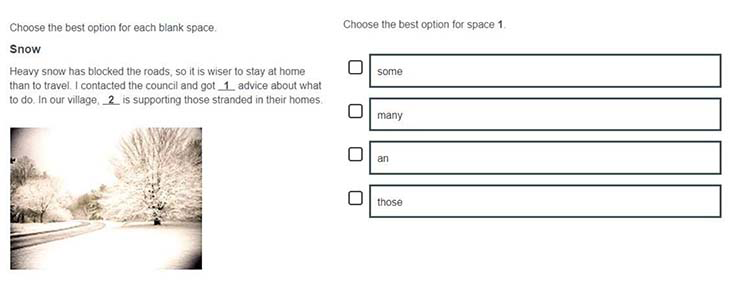
In this item, learners would be asked to identify the correct word to introduce the noun in a sentence, from a given range of options. This item would be rated as coming from the low end of the item difficulty range.
The item in Figure 33 is based on the same text as that in Figure 31 and asks about the second space in the given paragraph. This second item would ask the learner to identify the correct collective noun to complete a sentence.
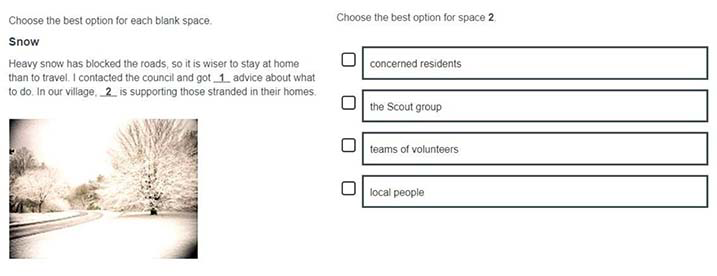
This item comes from the top of the item difficulty range for the S3 writing assessment.
4.2.3 SNSA Punctuation
The 2022 to 2023 SNSA assessed the skill Punctuation in a variety of ways. These included asking learners to identify the location of a given punctuation mark, to choose between sentences to identify the correctly punctuated example, and to choose the missing punctuation in a sentence from a range of options.
In the P4 assessment, items from this organiser focused on the full stop, question mark and exclamation mark, and the correct use of capital letters. This punctuation was assessed in relatively simple sentences. At P7, the range of punctuation was extended to include commas, parentheses and the uses of inverted commas and punctuation within speech, in more complex sentences. At S3, colons and semi-colons were added to the range of punctuation marks addressed, and learners were asked to identify correct usage of punctuation marks in increasingly complex sentences. There was some variation across stages, with more demanding items at each stage drawing on some content from the stage above.
As for the other writing organisers, items targeting the Punctuation organiser were presented either using stand-alone sentences or in items that used a passage of text with several items attached to it.
Figure 34 presents an example of a P7 writing item from the Punctuation organiser. It is a typical example of an item in which children were asked to choose the sentence with the correct punctuation from a range of options.
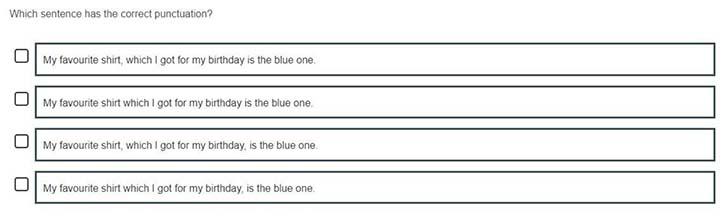
This item comes from the top of the item difficulty range for the P7 writing assessment. In this item, learners would be asked to identify the correct punctuation, where a single sentence is broken up by commas. To answer this item correctly, learners would have to work through each version of the sentence and choose the one with the correct punctuation structure.
Figure 35 shows another example of an item from the Punctuation organiser. In this item type, learners were presented with a sentence and asked to identify the correct location of the missing punctuation: in this case, parentheses. The item is an example which could be included in the S3 writing assessment.
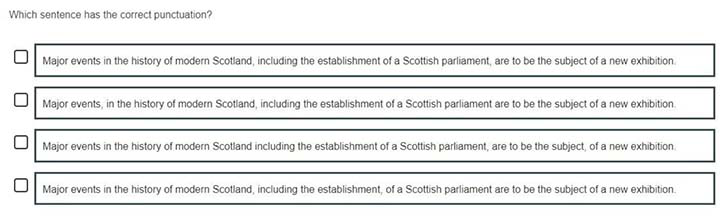
This item would be above average difficulty for the S3 writing assessment. In the item, a complex sentence uses the context of a major event in Scottish history. To answer this item correctly, learners would have to identify that they can use commas to offset a parenthesis (non-essential information).
3.2.4 – MCNG Spelling
The writing assessment in the 2022 to 2023 academic year was designed to assess spelling words and strategies, covering the range of skills and the progression articulated in the Experiences and Outcomes. At the lower levels, learners were assessed on their ability to spell relatively simple and commonly used vocabulary. As the difficulty of the spelling items increased, and in the upper stage assessments, children and young people were also asked questions to assess their knowledge of less familiar words. To answer the questions correctly, learners may have needed to rely on strategies, such as their knowledge of phonics, spelling patterns and rules, and at the highest level may have been asked to spell specialised vocabulary.
Throughout, spelling was assessed in context, using a range of formats. One format was the cloze style, in which learners had to select the correct spelling from a range of options, either in a single sentence or in a short passage. Another type of item required learners to select the incorrectly spelled word in a sentence.
Figure 36 is an example of a P4 spelling item.
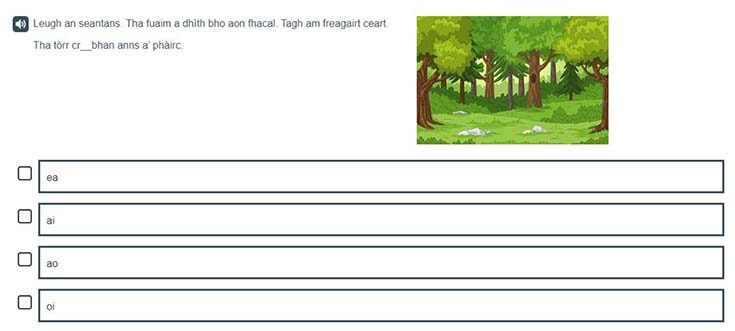
This item assesses learners’ knowledge of vowel blends to complete a common word and would be an easier item for P4. This item has audio support for the question stem, but no audio support for the answer options.
Figure 37 is an example of a P7 spelling item that assesses the learner’s knowledge of the plural spelling of a common word.
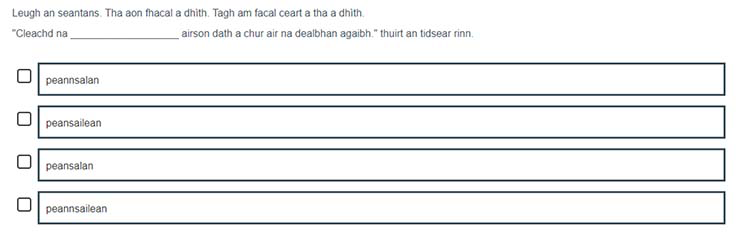
This item would be an easy to mid difficulty item for P7 learners which assesses their knowledge of the plural version of the word ‘peansail’ (‘pencil’). This requires the learner to know the correct spelling of the root word, and pair it with the correct word ending in order to make it plural.
3.2.5 – MCNG Grammar
This organiser focuses on general grammar points, addressing the skills, knowledge and understanding articulated in the Benchmarks. At P4, for example, it assessed children's ability to link sentences using common conjunctions, such as 'and', 'because' or 'but', while at the higher stages, a fuller and more complex range of conjunctions was assessed. Items addressing the Grammar organiser also assessed usage of prepositions, verb forms, adjectives and pronouns. At P4, the items tended to relate to simple sentences.
At P7 and S3, the challenge was increased by introducing longer, more complex language structures, such as compound sentences, conditionals and negative clauses; or by asking questions for which the child or young person needed to identify the relationship between two pronouns, where there was some ambiguity. In summary, as well as the grammar itself becoming more challenging, the contexts in which learners were asked to demonstrate their skills became more complex in the higher stage assessments.
Figure 38 show an example of an S3 Grammar item.
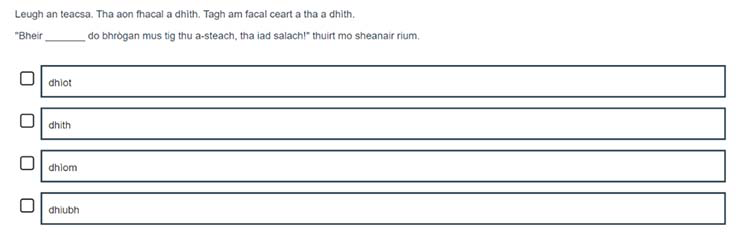
This item assesses learners’ knowledge of singular prepositional pronouns. This would be an easier item for S3; some common plural prepositional pronouns would also be classed towards the easier end of S3, however some less common plural prepositional pronouns are deemed to be harder for S3 learners.
3.2.6 – MCNG Punctuation
The 2022 to 2023 MCNG assessed the organiser Punctuation in a variety of ways. These included asking learners to identify the location of a given punctuation mark, to choose between sentences to identify the correctly punctuated example, and to choose the missing punctuation in a sentence from a range of options.
In the P4 assessment, items from this organiser focused mainly on the full stop, question mark and exclamation mark, and the correct use of capital letters. This punctuation was assessed in relatively simple sentences. At P7, the range of punctuation was extended to include commas, parentheses and the uses of inverted commas and punctuation within speech, in more complex sentences. At S3, colons and semi-colons were added to the range of punctuation marks addressed, and learners were asked to identify correct usage of punctuation marks in increasingly complex sentences. There was some variation across stages, with more demanding items at each stage drawing on some content from the stage above.
As for the other writing organisers, items targeting the Punctuation organiser were presented either using stand-alone sentences or in units that used a passage of text with several items attached to it.
Figure 39 show an example of a P4 Punctuation item.
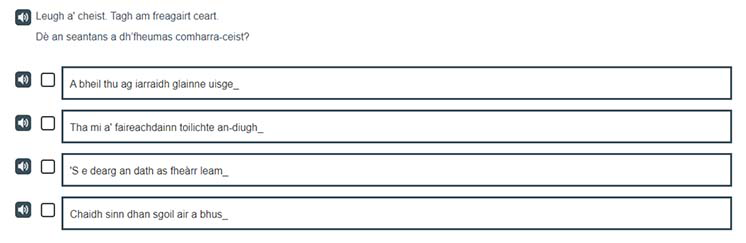
This item asks learners to identify the sentence that requires a question mark. This item requires the learners to read (or listen to) each answer option and through their knowledge of common Gaelic phrases, identify the sentence which requires a question mark.
4.3 SNSA National outcomes for writing[9]
4.3.1 Overall outcome
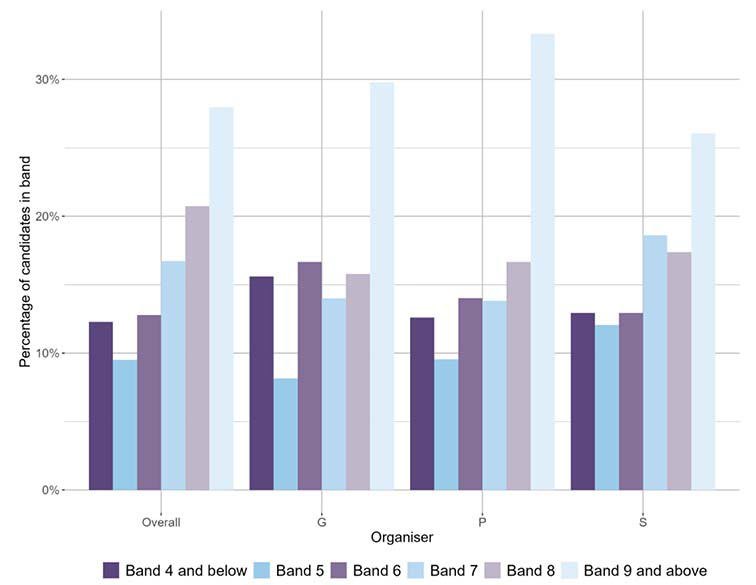
Charts 25a to 25c show the percentages of learners with outcomes in each band for writing across all three stages (P4, P7, and S3), both overall and when considering each of the three organisers Spelling (S), Grammar (G) and Punctuation (P) separately. The bar charts indicate the proportions of learners with outcomes in each of the six bands, in line with SNSA reports for the 2022 to 2023 academic year, which are specific to each stage.
Please note that a ‘notable difference’ refers to a difference of 10% or more.
In line with the Office for National Statistics (ONS) guidelines data is not available for any assessments where there are fewer than 10 learners in any category or band. These cases are indicated where appropriate in this section of the report.
The charts show that across all stages the highest proportions of learners had outcomes corresponding to the two middle bands. The second largest proportion of learners had outcomes corresponding to the two upper bands. There were relatively smaller proportions of learners with outcomes in the two lowest bands; however, among P4 learners, the proportions in these bands were somewhat larger.
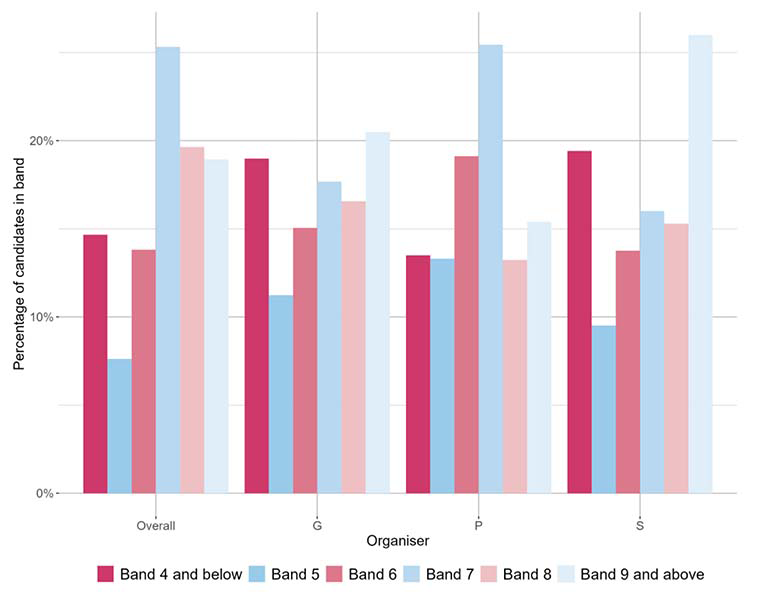
Overall, for P4, the band achieved by the largest proportion of learners was 7, and the band achieved by the second largest proportion was 9. Overall, 59% of learners achieved bands 6, 7 or 8 and 85% of learners achieved bands 5, 6, 7, 8 or 9.
For the organiser ‘Grammar’, 81% of learners achieved bands 5, 6, 7, 8 or 9. This organiser did not have the largest proportion of learners achieving outcomes in band 7, instead the largest proportion of learners are in band 9.
For the organiser ‘Punctuation’, 58% of learners achieved bands 6, 7 or 8 and 87% of learners achieved bands 5, 6, 7, 8 or 9.
For the organiser ‘Spelling’, 81% of learners achieved bands 5, 6, 7, 8 or 9. This organiser did not have the largest proportion of learners achieving outcomes in band 7, instead the largest proportion of learners are in band 9.
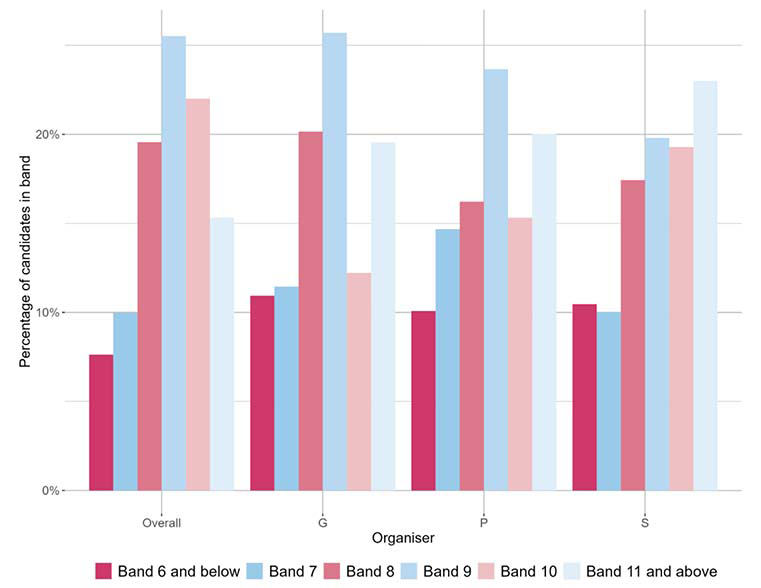
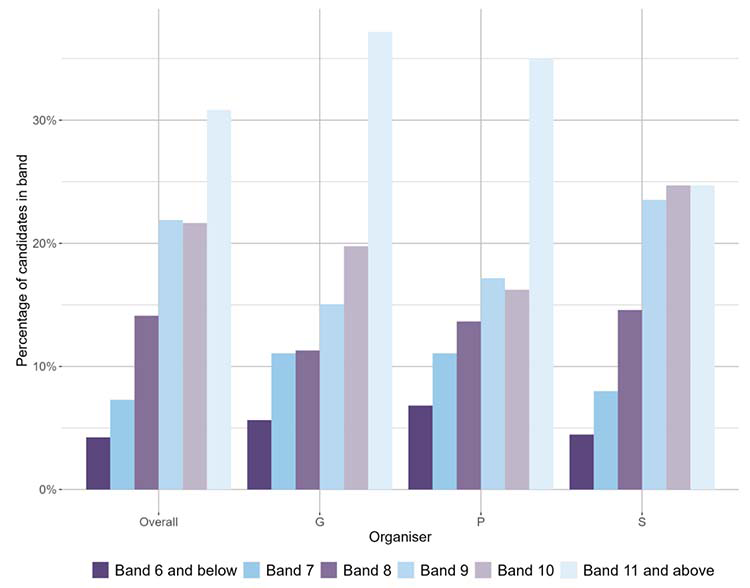
Overall, for P7, the band achieved by the largest proportion of learners was 9, and the band achieved by the second largest proportion was 10. Overall, 67% of learners achieved bands 8, 9 or 10 and 92% of learners achieved bands 7, 8, 9, 10 or 11.
For the organiser ‘Grammar’, 58% of learners achieved bands 8, 9 or 10 and 89% of learners achieved bands 7, 8, 9, 10 or 11.
For the organiser ‘Punctuation’, 55% of learners achieved bands 8, 9 or 10 and 90% of learners achieved bands 7, 8, 9, 10 or 11.
For the organiser ‘Spelling’, 57% of learners achieved bands 8, 9 or 10 and 90% of learners achieved bands 7, 8, 9, 10 or 11. This organiser did not have the largest proportion of learners achieving outcomes in band 9, instead the largest proportion of learners are in band 11.
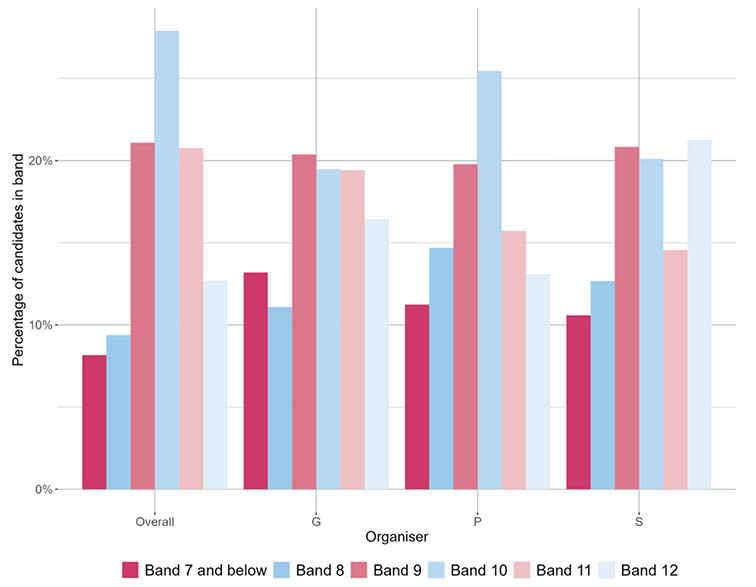
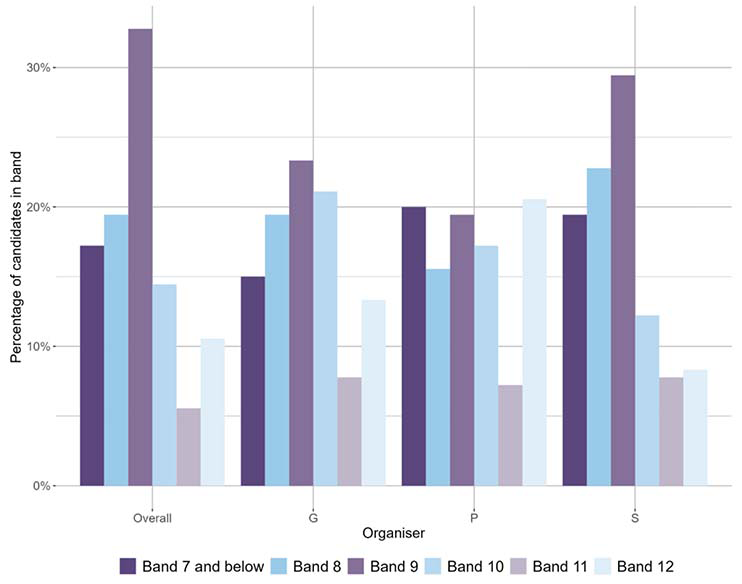
Overall, for S3, the band achieved by the largest proportion of learners was 10, and the band achieved by the second largest proportion was 9. Overall, 70% of learners achieved bands 9, 10 or 11 and 92% of learners achieved bands 8, 9, 10, 11 or 12.
For the organiser ‘Grammar’, 59% of learners achieved bands 9, 10 or 11 and 87% of learners achieved bands 8, 9, 10, 11 or 12. This organiser did not have the largest proportion of learners achieving outcomes in band 10, instead the largest proportion of learners are in band 9.
For the organiser ‘Punctuation’, 61% of learners achieved bands 9, 10 or 11 and 89% of learners achieved bands 8, 9, 10, 11 or 12.
For the organiser ‘Spelling’, 56% of learners achieved bands 9, 10 or 11 and 89% of learners achieved bands 8, 9, 10, 11 or 12. This organiser did not have the largest proportion of learners achieving outcomes in band 10, instead the largest proportion of learners are in band 12.
4.3.2 Sex
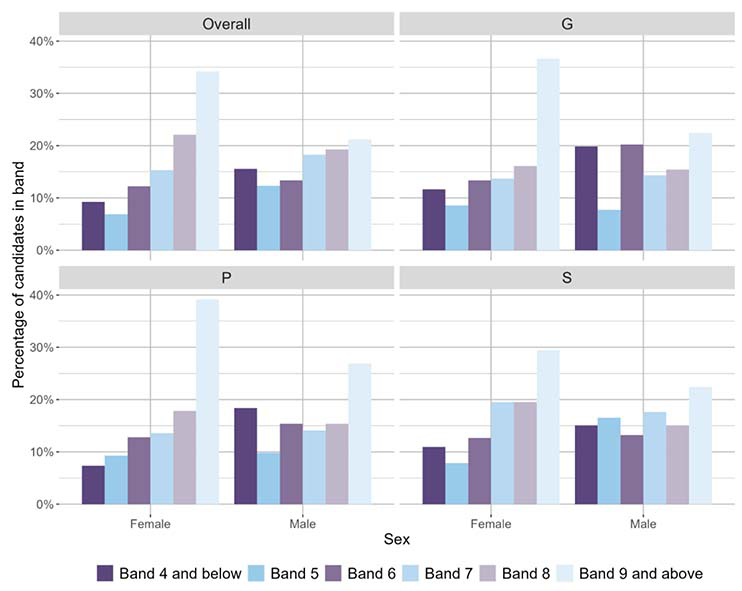
Charts 26a to 26c show writing outcomes for boys and girls for each stage. Outcomes are given for writing overall and also by organiser.
Across all stages, there were differences between male and female learners. There were consistently larger proportions of female learners with outcomes in the two upper bands than was the case for male learners though this was less pronounced at S3. The percentages of learners with outcomes corresponding to the two lower bands were also smaller among female learners than among male learners.
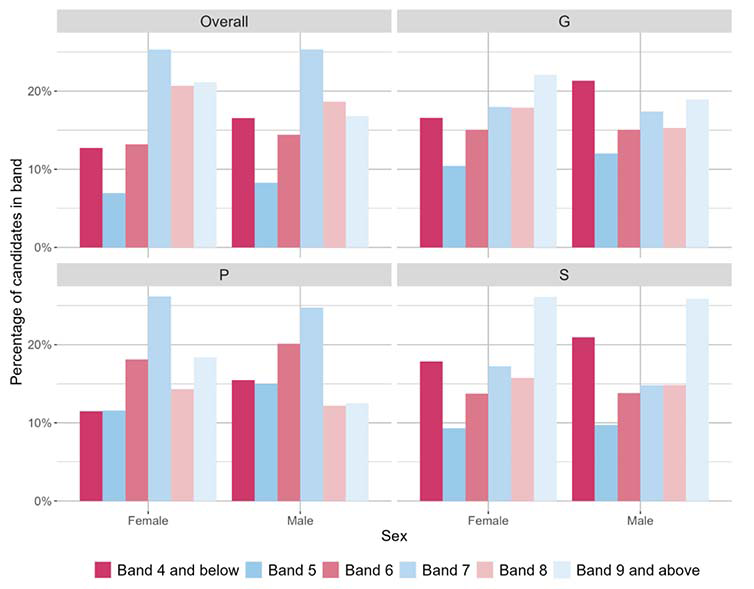
There were no notable differences between the proportion of females and males achieving outcomes in each band overall and for each organiser.
At P4, the largest proportions of male learners achieved outcomes in the middle two bands whilst the largest proportions of female learners achieved outcomes in the top two bands. There were proportionally more girls than boys with outcomes in the two upper bands, and fewer girls than boys with outcomes in the lower two bands. There was a similar pattern for each organiser. There were somewhat greater differences in the proportions of girls compared to boys achieving outcomes in the two upper bands when considering outcomes for ‘Grammar’ and ‘Punctuation’.
There were no notable differences between the proportion of females and males achieving outcomes in each band overall and for each organiser.
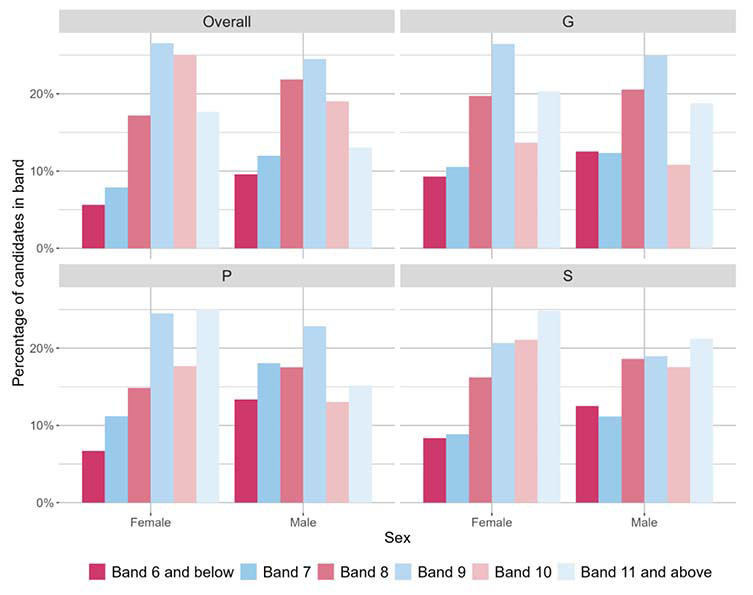
At P7, a higher of proportion of female learners than male learners achieved outcomes in the upper two bands and there was a higher proportion of male learners than female learners with outcomes in the lower two bands. This finding holds for writing overall and by organiser. There was a higher proportion of girls than boys achieving outcomes in the upper two capacity bands for ‘Punctuation’.
There were no notable differences between the proportion of females and males achieving outcomes in each band overall and for each organiser.
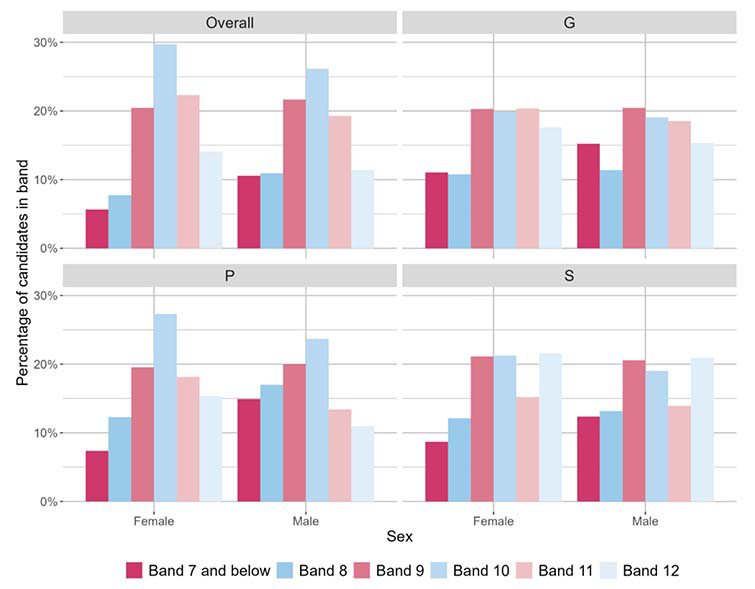
At S3, the outcomes were quite similar to those at other stages. The differences between the proportions of male learners and female learners with outcomes in the two highest bands were somewhat smaller than in P7; however, when considering ‘Punctuation’, it was again the case that higher proportions of girls achieved outcomes in the upper two capacity bands.
4.3.3 Scottish Index of Multiple Deprivation
This section reviews the distribution of learners for all stages across categories that reflect the Scottish Index of Multiple Deprivation (SIMD). To simplify the display of outcomes and aid their interpretation, we have divided the original 20 categories (vigintiles) into three combined categories of socio-economic background. These combined categories are: SIMD 1-4, indicating the lowest socio-economic quintile (that is, the most deprived children and young people, those in vigintiles 1 to 4); SIMD 5-16, indicating the three middle quintiles (vigintiles 5 to 16); and SIMD 17-20, indicating the highest socio-economic quintile (that is the least deprived children and young people, those in vigintiles 17 to 20).
Charts 27a to 27c illustrate that, at each stage, the proportions of learners in the two upper bands were noticeably larger in the least deprived group, as compared with the most deprived group.
There were also relatively larger proportions of learners with outcomes in the two lower bands in the most deprived group. This pattern was present in all stages, overall, and by each of the three writing organisers: Spelling, Grammar and Punctuation.
The differences in writing outcomes between children from the most and least deprived groups (SIMD 1–4 and SIMD 17–20) were similar across all stages (P4, P7 and S3). More children from the most deprived group (SIMD 1–4) had outcomes in the lower two bands, whereas a larger proportion of children in the least deprived group (SIMD 17–20) achieved outcomes in the two upper bands.
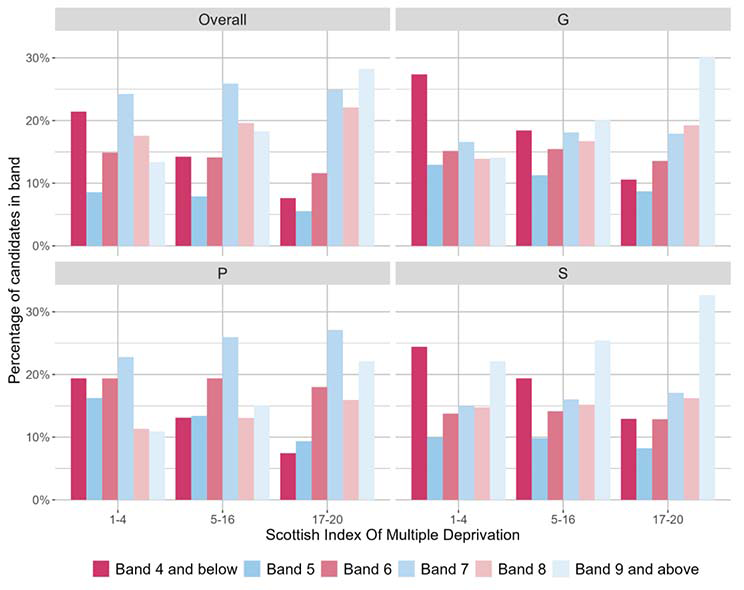
Overall, there was a notable difference between the proportions of learners in SIMD quintile 1-4 and 17-20 in bands 4 and 9.
There was also a difference between the proportions of learners in SIMD quintile 1-4 and quintiles 5-16 in bands 4 and 9 and between the proportions of learners in SIMD quintiles 5-16 and quintile 17-20 in bands 4 and 9.
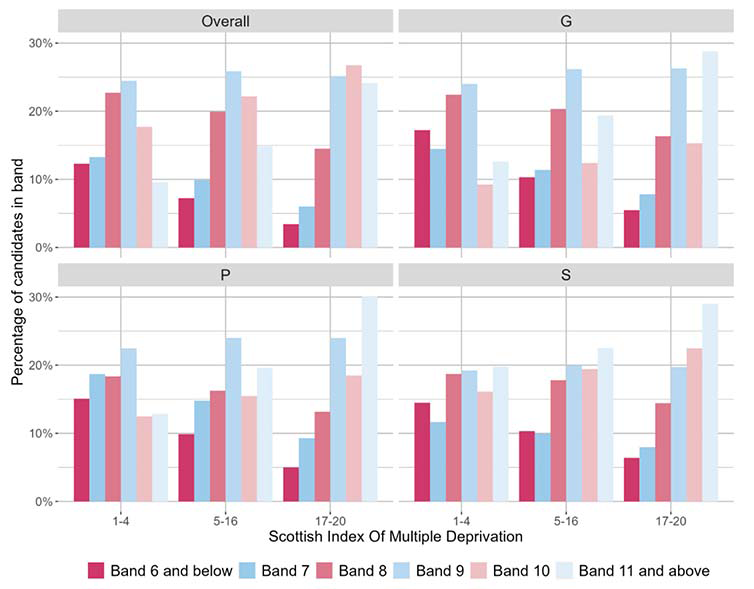
Overall, there was a notable difference between the proportions of learners in SIMD quintile 1-4 and 17-20 in band 11
There was also a notable difference between the proportions of learners in SIMD quintile 1-4 and quintiles 5-16 in band 11 and between the proportions of learners in SIMD quintiles 5-16 and quintile 17-20 in band 11.
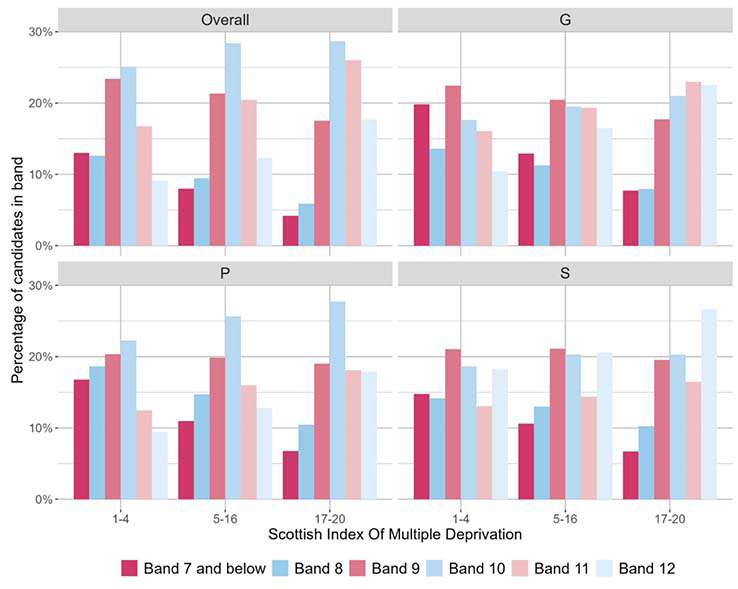
Whilst there were no notable differences in overall outcomes across all SIMD groups in each band, there were higher proportions of learners from SIMD 17-20 in the two upper capacity bands than learners from other SIMD groups and, correspondingly there were higher proportions of learners from SIMD 1-4 in the two lower capacity bands.
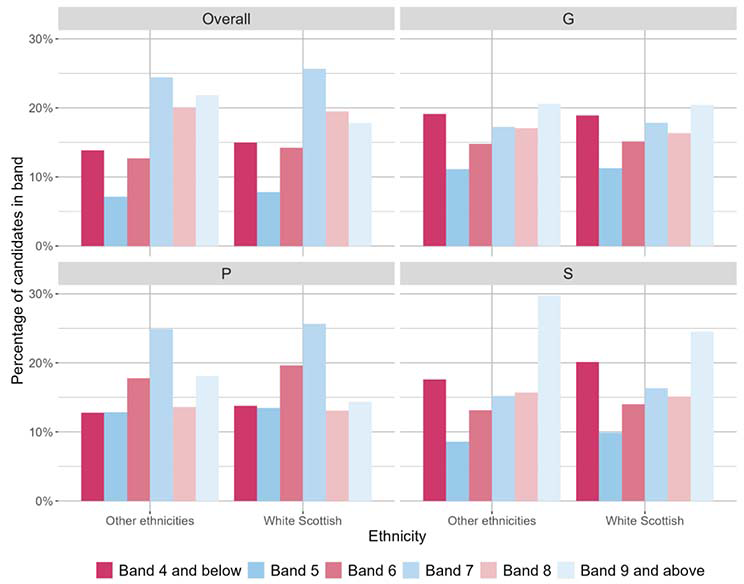
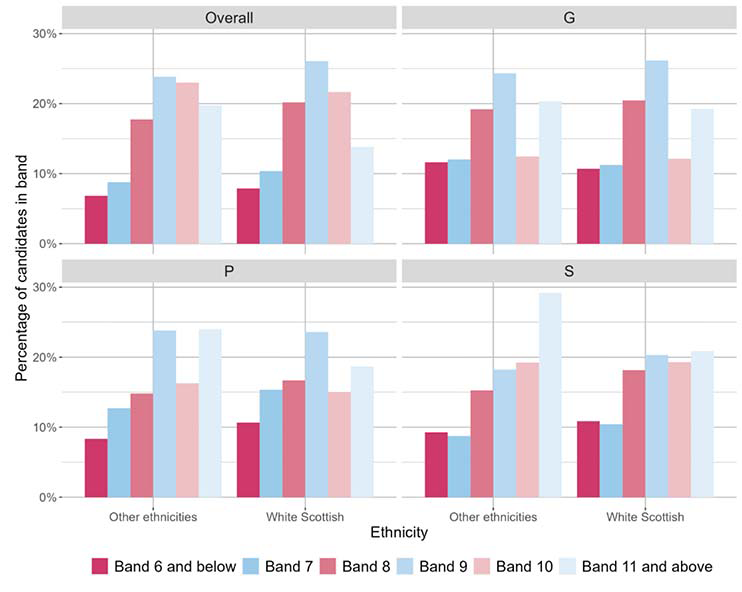
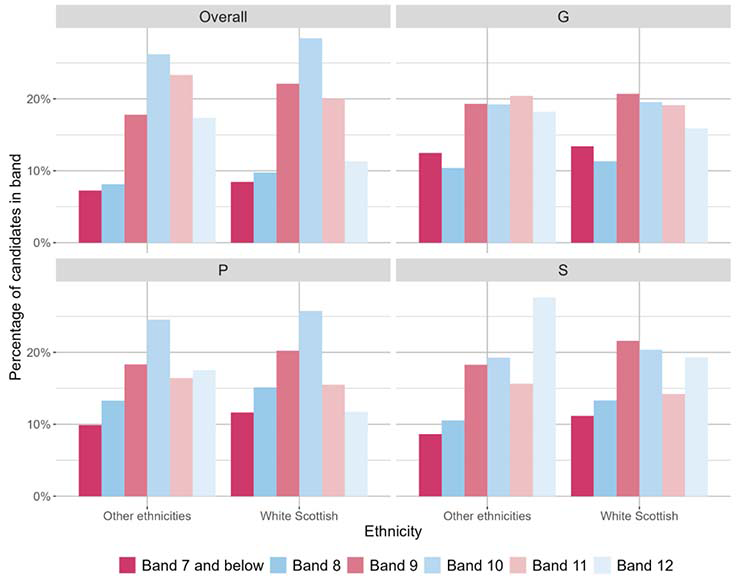
4.3.4 Ethnic background
This section looks at differences in writing outcomes between learners with 'White Scottish' and other ethnic backgrounds. Charts 28a to 28c show the percentages of learners with outcomes in the bands of reading/literacy for these two groups.
When comparing writing outcomes across the two comparison groups, there were relatively small differences, both in terms of overall outcome and when considering outcomes for each of the three organisers. There were lower proportions with outcomes in the two upper bands among learners from a 'White Scottish' background than among other learners. These differences were most notable at S3.
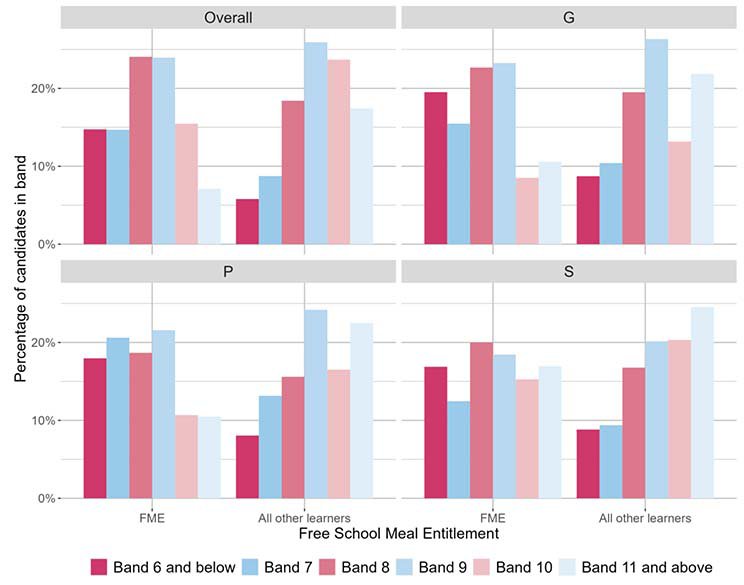
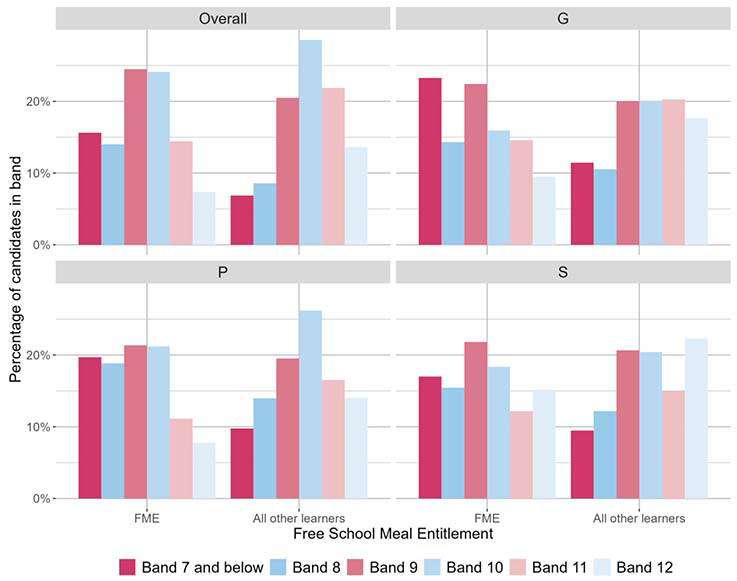
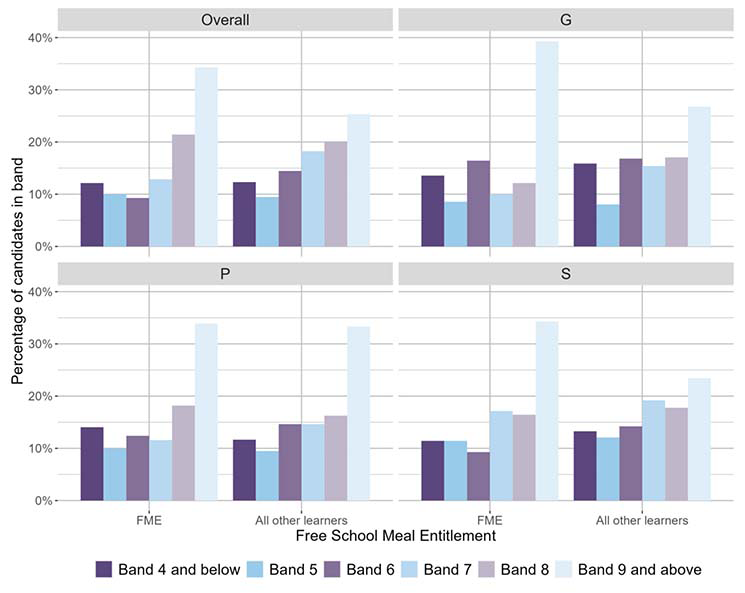
4.3.5 Free School Meal Entitlement
This section reviews differences in writing outcomes between learners with an entitlement to free school meals and other learners. Charts 29a to 29c show the percentages of learners who achieved outcomes in each band within each of the two groups.
There were notably lower proportions of learners with outcomes in the two upper bands among learners registered for FME in comparison to others. There were also relatively higher proportions of learners with outcomes in the two lower bands among learners with FME. This pattern was similar across all stages for each of the three organisers. Outcomes were very similar for both groups in the middle two bands.
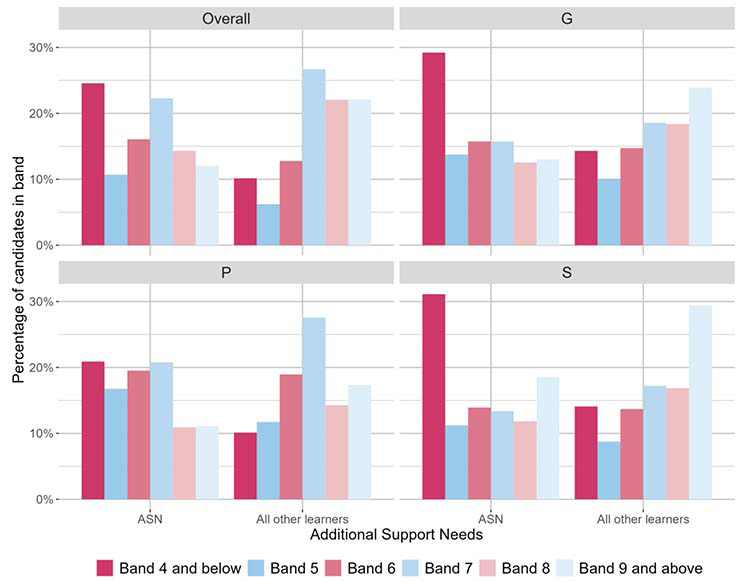
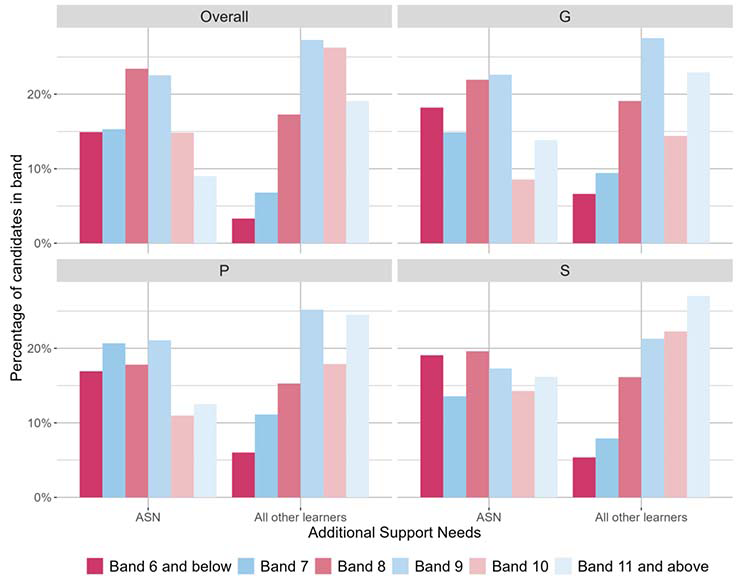
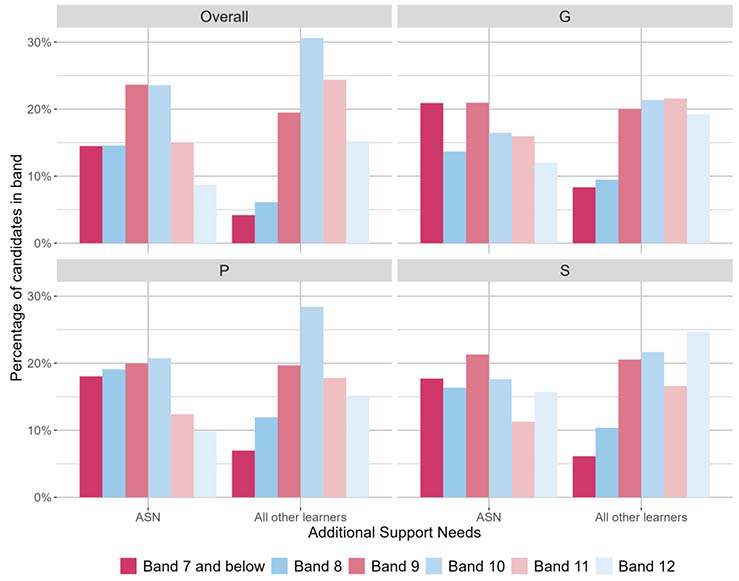
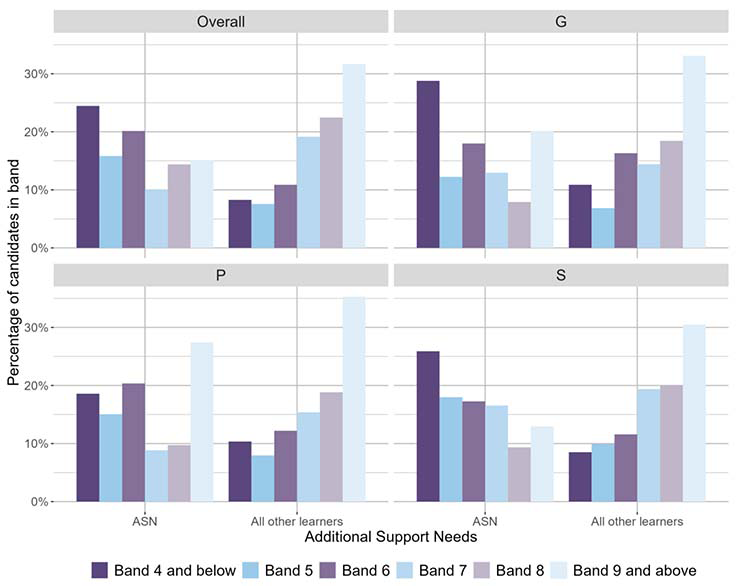
4.3.6 Additional Support Needs
This section reviews differences in outcomes between learners who were identified as having Additional Support Needs (ASN) and others. Charts 30a to 30c show the proportions of learners in the six bands within these two groups across stages.
Across all stages, the proportions of learners with outcomes in the two upper bands were notably higher among learners not identified as having ASN. There were also relatively larger proportions with outcomes in the lower two bands among learners with ASN. Outcomes were very similar for both groups in the middle two bands. Typically, between twice and three times as many learners with ASN had outcomes in the lower two bands compared to other learners. This pattern was present across all stages and for each of the three writing organisers.
4.3.7 Looked After Children
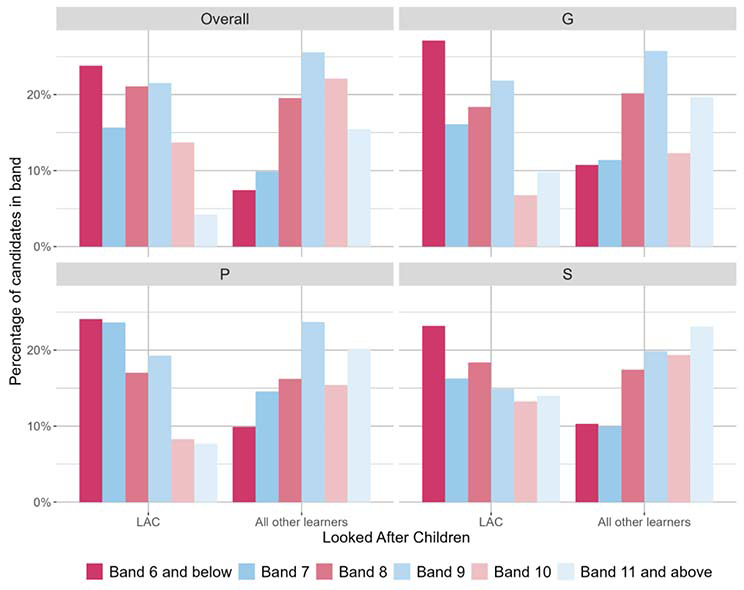
This sections reviews differences between learners classified (within SEEMiS) as Looked After Children (LAC), and other learners without such a classification. Charts 31a to 31c illustrate the proportions of learners with outcomes at each band for learners in these two categories.
Across all three stages, there were notable differences in writing outcomes between the two comparison groups. Among learners classified as LAC, there were considerably lower proportions achieving outcomes in the two upper bands than among other learners; typically, there were two to three times as many non-LAC learners achieving outcomes in this region. Likewise, there were much larger proportions of learners with outcomes in the two lower bands for LAC than among other learners. This pattern was similar across all stages, both for writing overall and for each of the three organisers.
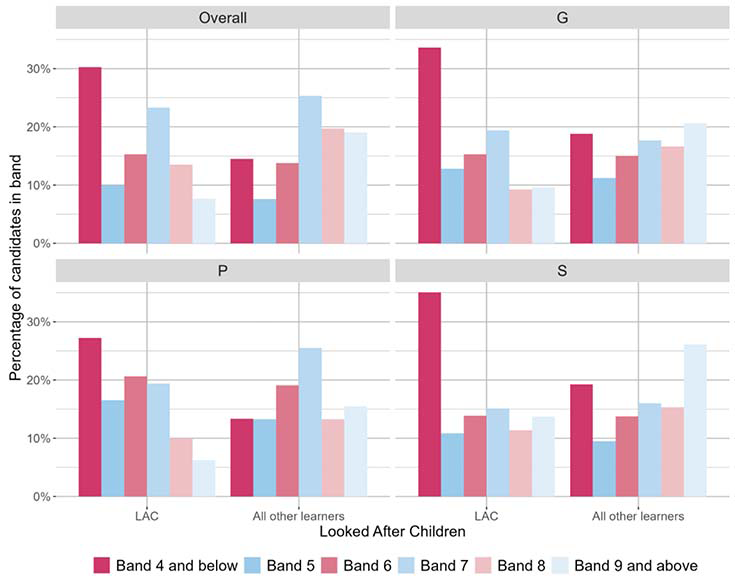
At P4, about 40% of Looked After Children achieved outcomes in the lower two bands, while less than a quarter of other learners had outcomes in this region.
At P7, about 40% of Looked After Children achieved outcomes in the lower two bands, while less than a fifth of other learners had outcomes in this region.
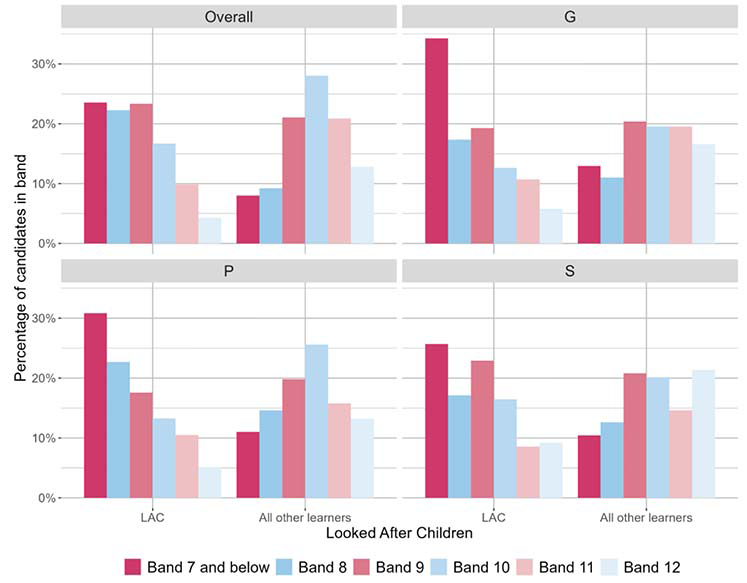
At S3, over 40% of Looked After Children achieved outcomes in the lower two bands, while less than a fifth of other learners had outcomes in this region.
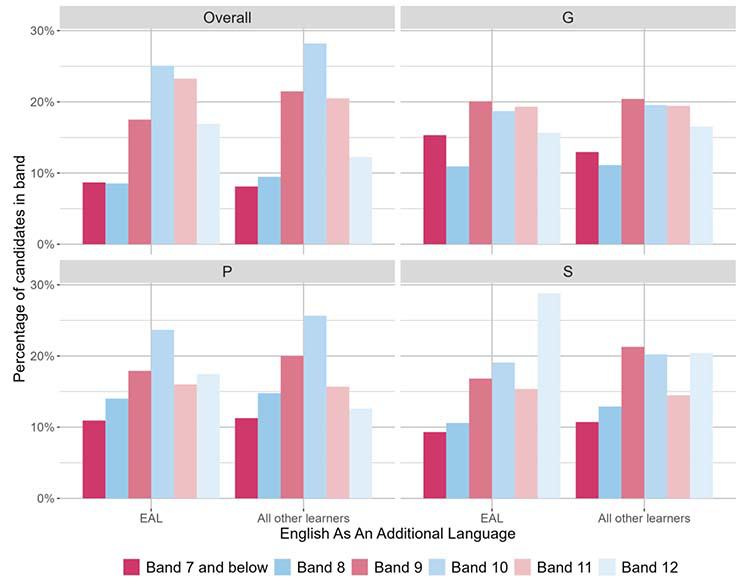
4.3.8 English as an Additional Language
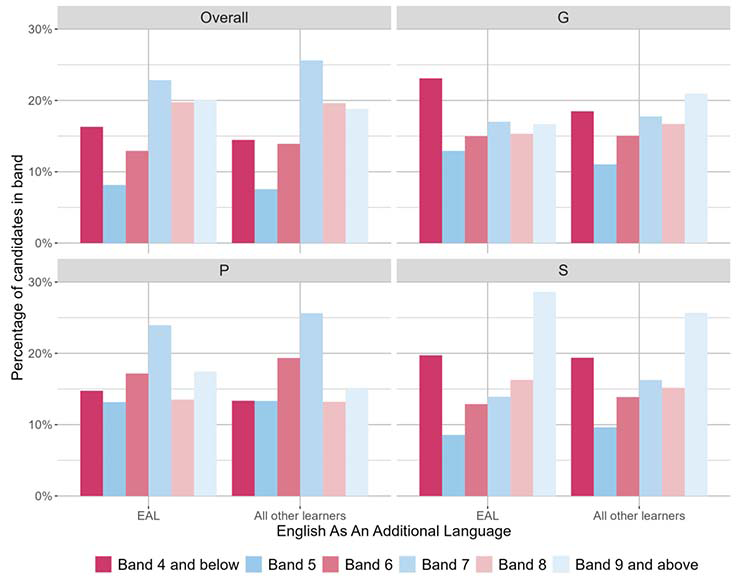
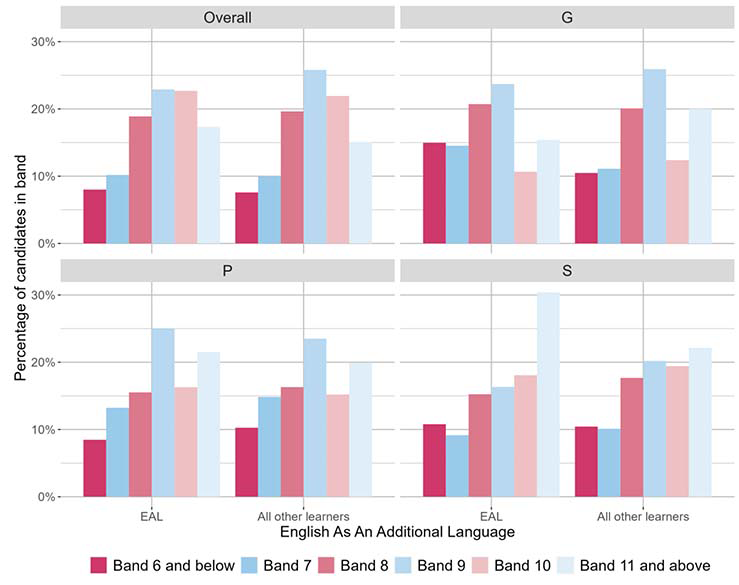
Charts 32a to 32c compare learners by language background: English as an Additional Language (EAL) compared with all other learners. The category 'EAL' refers to those learners whose record in SEEMiS showed that they had English as an additional language. The 'Not EAL' category comprises both learners who were recorded as not having EAL and those for whom there was no entry in this field.
When comparing proportions in bands between groups of learners for whom English is an additional language (EAL) and those with English as their first language, there were minimal differences though these were more pronounced at S3.
When considering only assessment material related to the organiser ‘Grammar’, there were small differences between the two groups with a greater proportion of learners with English as their first language achieving outcomes in the upper capacity band. There were similar differences across all stages. When considering only assessment content related to ‘Spelling’, there were very small differences between the two groups with a greater proportion of learners with English as an Additional Language achieving outcomes in the upper capacity band.
4.4 MCNG National outcomes for writing
4.4.1 Overall outcome
Charts 33a to 33c show the percentages of learners with outcomes in each band for writing across all three stages (P4, P7, and S3), both overall and when considering each of the three organisers Spelling (S), Grammar (G) and Punctuation (P) separately. The bar charts indicate the proportions of learners with outcomes in each of the six bands, in line with MCNG reports for the 2022 to 2023 academic year, which are specific to each stage.
Please note that a ‘notable difference’ refers to a difference of 10% or more.
The charts show that at P4 and P7, the highest proportions of learners had outcomes corresponding to the two upper bands. At S3, the highest proportions of learners had outcomes in the middle two bands.
In line with the Office for National Statistics (ONS guidelines) data is not available for any assessments where there are fewer than 10 learners in any category or band. These cases are indicated where appropriate in this section of the report.
Overall, for P4, the band achieved by the largest proportion of learners was 9, and the band achieved by the second largest proportion was 8. Overall, 65% of learners achieved bands 7, 8 or 9 and 78% of learners achieved bands 6, 7, 8 or 9.
For the organiser ‘Grammar’, 60% of learners achieved bands 7, 8 or 9 and 77% of learners achieved bands 6, 7, 8 or 9.
For the organiser ‘Punctuation’, 50% of learners achieved bands 5 or 6 and 78% of learners achieved bands 6, 7, 8 or 9.
For the organiser ‘Spelling’, 62% of learners achieved bands 7, 8 or 9 and 75% of learners achieved bands 6, 7, 8 or 9.
Overall, for P7, the band achieved by the largest proportion of learners was 11, and the band achieved by the second largest proportion was 9. Overall, 53% of learners achieved bands 10 or 11 and 75% of learners achieved bands 9, 10 or 11.
For the organiser ‘Grammar’, 58% of learners achieved bands 10 or 11 and 84% of learners achieved bands 8, 9, 10 or 11.
For the organiser ‘Punctuation’, 52% of learners achieved bands 10 or 11 and 83% of learners achieved bands 8, 9, 10 or 11.
For the organiser ‘Spelling’, 50% of learners achieved bands 10 or 11 and 89% of learners achieved bands 8, 9, 10 or 11.
Overall, for S3, the band achieved by the largest proportion of learners was 9, and the band achieved by the second largest proportion was 8. Overall, 67% of learners achieved bands 8, 9 or 10 and 89% of learners achieved bands 7, 8, 9, 10 or 11.
For the organiser ‘Grammar’, 65% of learners achieved bands 8, 9 or 10 and 87% of learners achieved bands 7, 8, 9, 10 or 11.
For the organiser ‘Punctuation’, 52% of learners achieved bands 8, 9 or 10 and 79% of learners achieved bands 7, 8, 9, 10 or 11. This organiser did not have the largest proportion of learners achieving outcomes in band 9, instead the largest proportion of learners are in band 12.
For the organiser ‘Spelling’, 65% of learners achieved bands 8, 9 or 10 and 92% of learners achieved bands 7, 8, 9, 10 or 11.
4.4.2 Sex
Chart 34 shows writing outcomes for boys and girls at P4. Outcomes are given for writing overall and also by organiser.
In line with ONS guidelines the data for P7 and S3 is not reported in order to avoid identifying individual learners.
At P4, there were notable differences between male and female learners. There were consistently larger proportions of female learners with outcomes in the two upper bands than was the case for male learners. The percentages of learners with outcomes corresponding to the two lower bands were also smaller among girls than among boys.
At P4, the largest proportions of male and female learners achieved outcomes in the upper two bands. There was a greater proportion of females than males with outcomes in the two upper bands, and a lower proportion of females than males with outcomes in the lower two bands. There was a similar pattern for each organiser. There were somewhat greater differences in the proportions of female learners compared to male learners when considering outcomes for Grammar and Punctuation.
4.4.3 Scottish Index of Multiple Deprivation
In line with ONS guidelines the data for all stages is not reported in order to avoid identifying individual learners.
4.4.4 Ethnic background
In line with ONS guidelines the data for all stages is not reported in order to avoid identifying individual learners.
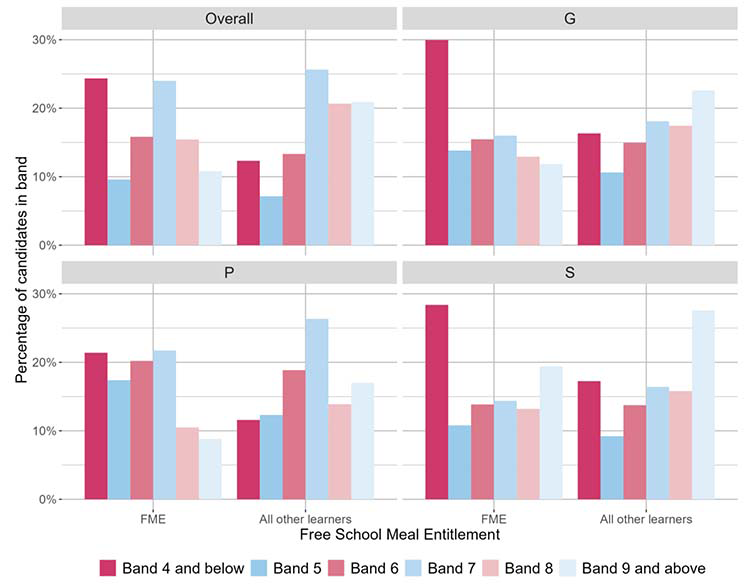
4.4.5 Free School Meal Entitlement
This section reviews differences in writing outcomes between learners with an entitlement to free school meals and other learners. Chart 35 shows the percentages of learners who achieved outcomes in each band within each of the two groups at P4.
In line with ONS guidelines the data for P7 and S3 is not reported in order to avoid identifying individual learners.
At P4 there were notable higher proportions of learners with outcomes in the upper two bands among learners registered for FME in comparison to others
4.4.6 Additional Support Needs
This section reviews differences in outcomes between learners who were identified as having Additional Support Needs (ASN) and others. Chart 36 shows the proportions of learners in the six bands within these two groups at P4.
In line with ONS guidelines the data for P7 and S3 is not reported in order to avoid identifying individual learners.
At P4, the percentages of learners with outcomes in the two upper bands were notably higher among learners not identified as having ASN. There were also relatively larger proportions with outcomes in the lower two bands among learners with ASN.
4.4.7 Looked After Children
In line with ONS guidelines the data for all stages is not reported in order to avoid identifying individual learners.
4.4.8 English as an Additional Language
In line with ONS guidelines the data for all stages is not reported in order to avoid identifying individual learners.
Contact
There is a problem
Thanks for your feedback