National Standardised Assessments for Scotland: national report - academic year 2023-2024
Summary of outcomes at a national level on the 'Scottish National Standardised Assessments' (SNSA) and ‘Measaidhean Coitcheann Nàiseanta airson Foghlam tron Ghàidhlig’ (MCNG) (collectively known as NSA) in the 2023 to 2024 academic year.
3 Reading/Literacy
3.1 The scope of the reading/literacy assessment
3.1.1 Reading and literacy for P1, P4, P7 and S3
For P4, P7 and S3, the assessments of reading and writing are delivered separately. For P1, children are presented with a single assessment combining elements of reading and writing – this is referred to as the P1 literacy assessment. There are two reasons for combining reading and writing at P1. First, literacy skills tend to be quite integrated at this early stage of development (and may be referred to as 'precursor' or 'component' literacy skills). Secondly, a combined literacy assessment reduces the burden of the assessment, which is an important consideration for the very young children in this stage. The P1 literacy assessment is scaled with the reading assessments for higher stages, using the same set of curriculum organisers, and is therefore discussed in this section in conjunction with the outcomes of the P4, P7 and S3 reading assessments.
The P1 literacy assessment comprised both stand-alone items and 'units', which are groups of questions focusing on a single stimulus text. At P4, P7 and S3, all the reading items were grouped into units of four or five items, to economise on the reading load. Using this unit structure, items of differing difficulty and covering different organisers could be asked with reference to the same text.
3.1.2 Alignment with Curriculum for Excellence
In the NSA academic year 2023 to 2024, the assessments of reading and P1 literacy were based on elements of Curriculum for Excellence (CfE), as articulated in the Benchmarks: Literacy and Gàidhlig, published in March 2017 and the Benchmarks: Literacy and English, published in June 2017.
3.1.3 A note on texts used in NSA reading assessments
For NSA reading in English and Gaelic, a broad definition of texts was used, in line with the statements in Benchmarks: Literacy and English (June 2017): 'Challenge in literacy … involves engaging with a wide range of increasingly complex texts which are suitable to the reading age of each learner.' In NSA, this range includes narrative fiction and non-fiction, description, explanation, argument and instructions. A further dimension to the definition of texts in NSA reading relates to format, as described in Curriculum for Excellence: Literacy and English, Principles and Practice: 'Texts can be in continuous form, including traditional formal prose, or non-continuous, for example charts and graphs.'
3.2 Coverage of the Curriculum for Excellence
NSA are just one part of the range of assessments that teachers use in making their evaluations of children's and young people's learning. As a standardised assessment with a defined number of items and using items capable of being scored automatically, only some parts of the specified reading Benchmarks could be addressed. In consultation with Scottish literacy experts, it was agreed that the reading and P1 literacy assessments should be based on the organisers Tools for reading (TFR), Finding and using information (FUI), and Understanding, analysing and evaluating (UAE). The assessment questions for the NSA reflect the knowledge, skills understanding, and standards embedded within the Curriculum for Excellence Experiences and Outcomes for reading, writing and numeracy across the CfE Levels, in accordance with the most up to date Education Scotland advice and curricular guidance on experiences and outcomes and Benchmarks.
Although all three organisers are represented in the P1, P4, P7 and S3 reading assessments, there were different proportions across the stages. In the reports provided to schools, teachers received information about organiser-level outcomes if the learner was presented with at least five items from the organiser. Similarly, in this report, outcomes for organisers that were addressed by at least five items in each learner's assessment are analysed. The organisers included in the reports are shown by stage, in Table 2.
Table 2: Reporting organisers for reading by stage, academic year 2023 to 2024
| Stage | Organisers |
|---|---|
| Primary 1 | Tools for reading; Finding and using information; Understanding, analysing and evaluating. |
| Primary 4 | Tools for reading; Finding and using information; Understanding, analysing and evaluating. |
| Primary 7 | Tools for reading; Finding and using information; Understanding, analysing and evaluating. |
| Secondary 3 | Tools for reading; Finding and using information; Understanding, analysing and evaluating. |
The following sections provide more information on each of the reading organisers in NSA 2023 to 2024, along with some example items. These items were not used in NSA 2023 to 2024, and they will not be used in future Scottish National Standardised Assessments.
The information in sections 3.2.1 - 3.2.3 apply to SNSA. MCNG examples and descriptions can be found in sections 3.2.4 - 3.2.6 of this report.
3.2.1 SNSA Tools for reading
In the P1 assessment, this organiser comprised items related to phonological awareness, word decoding and word recognition; in the assessments for the upper stages, assessment content mainly referred to learners' use of strategies to work out the meaning of words. The P4, P7 and S3 assessments contained relatively small numbers of items from this organiser in the academic year 2023 to 2024.
Figure 16 shows a typical item from the P1 literacy assessment, which reflects the organiser Tools for reading. It is designed to assess children's knowledge of sounds (phonological awareness). Note that the 'audio’ icon indicates to the learner that there is a voiced component to the item, enabling the child to listen to the instruction. In this case, clicking on the icon prompts a reading of the item text to the child.
Figure 16. Example of a P1 Tools for reading item, ‘Match a letter to its sound’
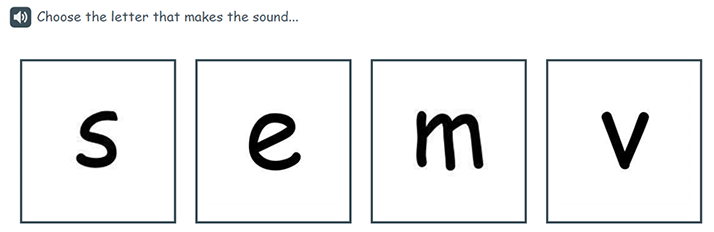
This item asks the child to match the grapheme to the aurally presented phoneme, a skill which, in English, is a key precursor to mastery of reading. The focus of the item is unambiguously on phonological awareness the sounds (phonemes) and corresponding letter/s (graphemes) which represent them) rather than decoding. This item was classified as being at the bottom of the P1 literacy item difficulty range. It was presented to children near the beginning of the assessment, with almost all children were able to answer it correctly.
Figure 17 shows another example of a P1 Tools for reading item.
Figure 17. Example of a P1 Tools for reading item, 'Select the letter'
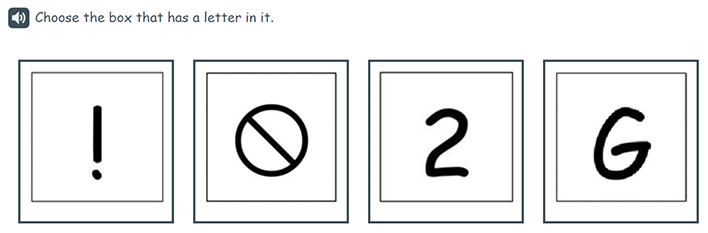
This item draws on a child's letter recognition skills, which is part of very early literacy development. It required learners to identify a letter from a set of options including numbers and symbols. An audio prompt provided support to the onscreen instruction. In this case, learners were not required to decode the letter, or demonstrate understanding of its sound.
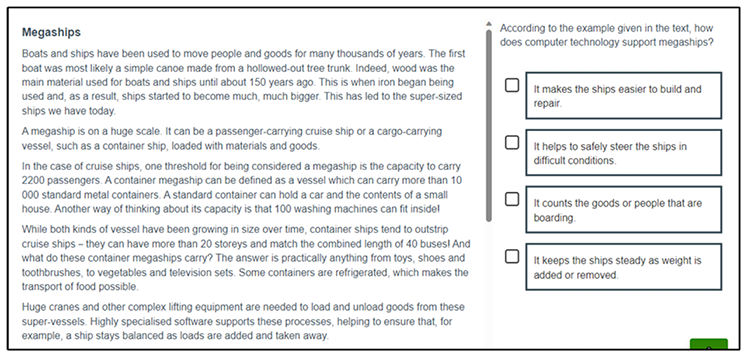
Figure 18. Example of a P7 Tools for reading item, ‘Identify the meaning of a word in context’, ‘Megaships’
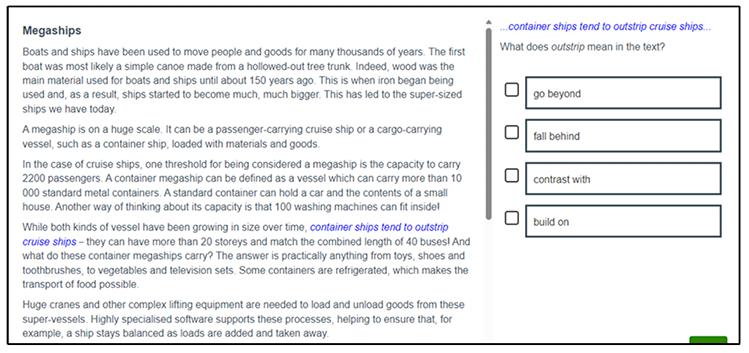
This is an information text. This item asks a learner to identify the meaning of a word in context in an information text. It required learners to identify the meaning of a word from a set of options. To help the learner locate the word in the text, the sentence where the word appears is highlighted in italic blue in both the question and the source text. This link allows the learner to understand the context of the item in order to identify the meaning of the word.
3.2.2 SNSA Finding and using information
This organiser focuses on the critical literacy skills of locating information in a text and employing the information to meet a purpose. These skills are often applied in the context of non-fiction texts but can also be applied to fiction. In the SNSA, items for P1 and P4 learners that corresponded to this organiser generally focused on finding information that was literally stated or required a low level of inference (for example, recognising synonyms linking the question with the text). More advanced items addressing similar skills – for P7 and S3 – were likely to be applied to longer and more complex texts. At P7, the organiser Finding and using information also included items requiring learners to sort information in a text into relevant categories. The S3 reading assessment presented Finding and using information items that asked learners to find key information in one or more texts, or to make connections between the information they located, sometimes across more than one source of information.
Figure 19 provides a good example of a P4 item where typically a learner is asked to find information that is literally stated in text.
Figure 19. Example of a P4 Finding and using information item, ‘Feed the Birds’
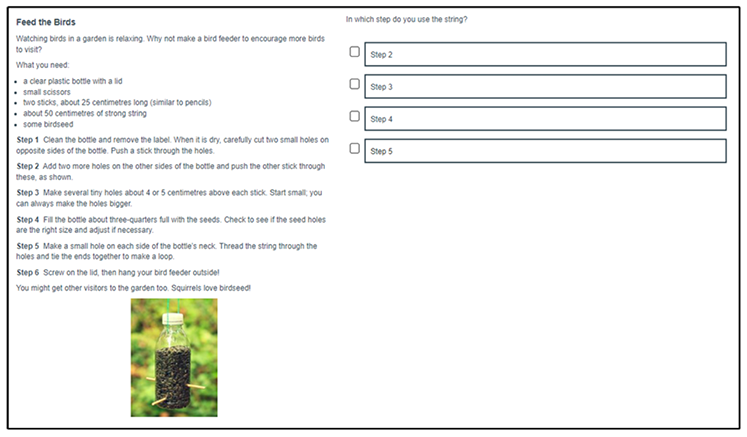
This item asks the learner to identify a step in a process in an instructional text. The learner can locate the step by linking the word string in the item to the step where the word string appears. This item is very much about the learner finding the correct bit of information.
This item was classified as being at the bottom of the P4 reading item difficulty range. It was presented to children near the beginning of the assessment, with almost all children able to answer it correctly.
Figure 20 shows a typical item from the P7 reading assessment, from the organiser Finding and using information. The stimulus for this item is a non-fiction information text of typical length within the context of the P7 reading assessment, and mainly uses relatively simple vocabulary and language structures. The item presented here required learners to find information in the non-fiction text.
Figure 20. Example of a P7 Finding and using information item, ‘Megaships’
This item asks the learner to locate a paraphrased detail in the text. The information uses familiar synonymous language to help the child link the information in the text to the correct answer. The phrase “specialised software supports the processes.” in the text is the information that needs to be located by the learner.
Figure 21 shows a Finding and using information item from a S3 reading assessment. The stimulus for this item is a descriptive, non-fiction text. The text uses more complex vocabulary, including some technical terminology, and the sentences are longer and use more complex structures, providing learners in S3 with greater challenge.
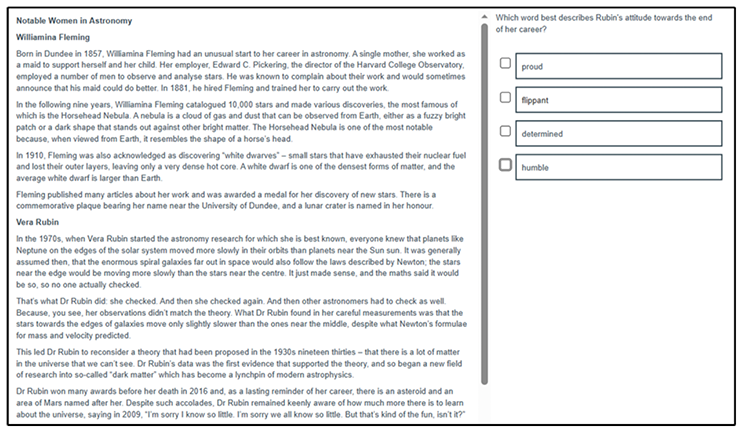
Figure 21. Example of an S3 Finding and using information item, ‘Notable Women in Astronomy’
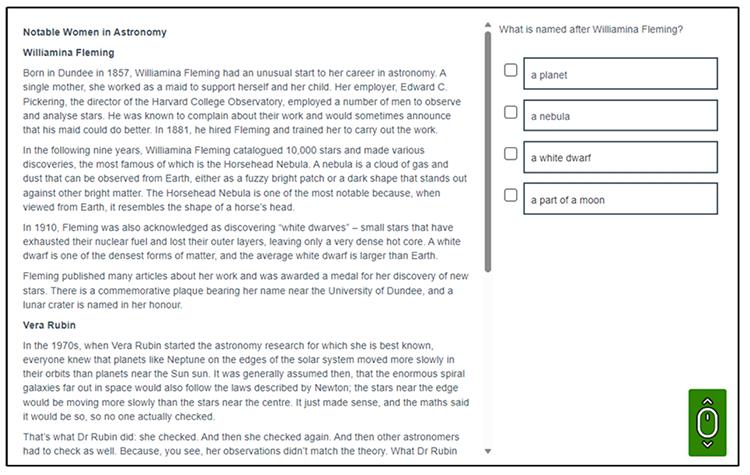
The item presented here required learners to select relevant information and identify a paraphrase of a detail given in a complex information text. Learners can relate the wording in the question directly to the identical expression in the text. However, in other ways this item is considerably more difficult than the P7 example provided in Figure 14, as the text is more complex and sophisticated and the learner has to understand that a lunar crater is a part of a moon.
This unit was only seen by learners if they did relatively well in the initial items within the assessment and the item was classified as being at the high end of the S3 item difficulty range.
3.2.3 SNSA Understanding, analysing and evaluating
The essence of this organiser is comprehension, beginning with word and sentence level texts (for learners at P1) and with progressively longer and more complex passages of text providing greater challenge across all the reading assessments. While items for the P4 assessment tended to focus on main or prominent ideas, learners at P7 and S3 were asked to answer a range of literal, inferential and evaluative questions that, for example, might require learners to distinguish between fact and opinion, recognise persuasive language, use evidence from a text to support answers, or evaluate the reliability and credibility of texts.
Figure 22 is an example of a P1 item from the organiser Understanding, analysing and evaluating. It assesses reading comprehension at sentence level. In this kind of item, the child chooses an answer from a selection (multiple choice item). This skill was modelled in the practice assessment.
Figure 22. Example of a P1 Understanding, analysing and evaluating item, ‘Washing the car’
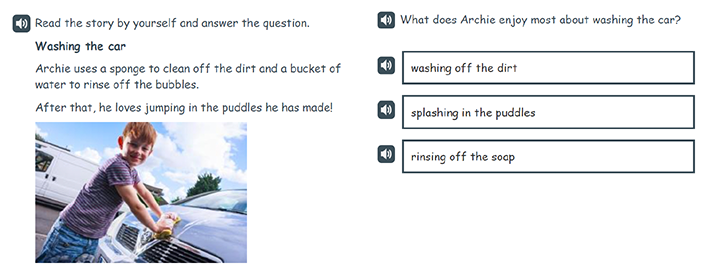
This item was rated as being at the high end of the P1 item difficulty range. The text instruction can be read to the learner using the audio button. The question and answer options also have audio support. In contrast to the Tools for reading items presented in Figures 16 and 17, the child is required to read the actual text independently. As well as being able to decode the words, the child needs to infer which part of the activity Archie enjoys the most from the sentence ‘After that, he loves jumping in the puddles he has made!’ This item therefore relies on understanding information, rather than just finding and using it. Only a minority of P1 learners presented with this item were expected to complete it successfully.
It can be seen that the example item shown in Figure 22 requires the child both to decode the words by themselves (that is, to read independently) and to understand the meaning of the sentence. Another approach to assessing the development of reading comprehension at the earliest stages is to present written texts orally. This is because young learners may have higher skills in comprehension than their decoding skills allow them to demonstrate. Accordingly, at P1, a combination of written texts with audio support and without audio support was used to assess the skills, knowledge and understanding associated with the organiser Understanding, analysing and evaluating.
Figure 23 is an example of a P4 item from the organiser Understanding, analysing and evaluating.
Figure 23. Example of a P4 Understanding, analysing and evaluating item, ‘Feed the Birds’
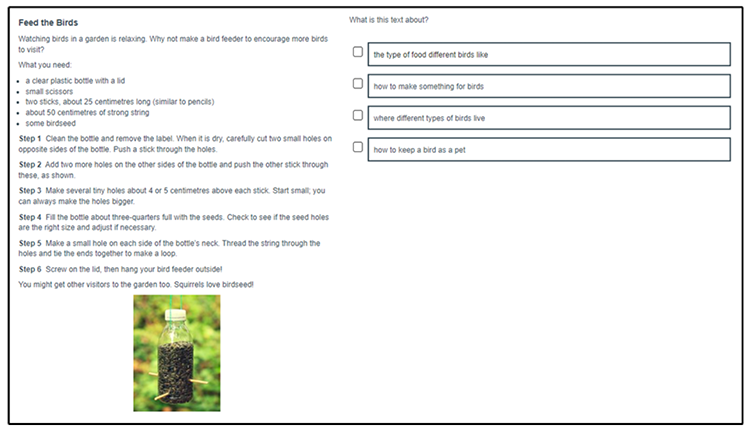
This item asks learners to identify the purpose of an instructional text. To answer this item successfully, learners must understand and synthesise information contained within the 6 steps before concluding and summarising what the text is about. This item was in the middle of the item difficulty range for P4. It was presented to learners who had done relatively well in the initial items within the assessment.
Reflecting the importance of the skills in this organiser within CfE, the larger amount of items in the S3 reading assessment for 2023 to 2024 focused on Understanding, analysing and evaluating. Like the reading assessments for P4 and P7, the texts used for the S3 assessment covered a range of text types, contexts and topics, from narrative through to information or persuasive texts, and fiction through to scientific texts or blogs. As would be expected, the texts for S3 were generally longer and more complex than for the lower stages.
The text in Figure 24 is an example of a typical text for S3.
Figure 24. Example of an S3 Understanding, analysing and evaluating text, ‘Notable Women in Astronomy’
Items in this organiser at S3 asked learners to demonstrate skills such as infer from a direct quotation a viewpoint held by a person described in a complex information text. The question requires the learner to interpret the final paragraph “Despite such accolades, Dr Rubin remained keenly aware of how much more there is to learn about the universe, saying in 2009, “I’m sorry I know so little. I’m sorry we all know so little. But that’s kind of the fun, isn’t it?” The learner is required to draw a conclusion based on the information provided in the text.
3.2.4 – MCNG Tools for Reading
In the P1 assessment, this organiser comprised items related to phonological awareness, word decoding and word recognition; in the assessments for the higher stages, assessment content mainly referred to learners' use of strategies to work out the meaning of words. The P4, P7 and S3 assessments contained relatively small numbers of items from this organiser in the academic year 2023 to 2024.
Figure 25 shows a typical item from the P4 reading assessment, which reflects the organiser Tools for reading.
Figure 25. Example of a P4 Tools for reading item
This item is designed to assess children's ability to recognise common words and suggest an appropriate synonym. Note that the 'speaker' icon indicates to the learner that there is audio support available, enabling the child to listen to the item text.
Figure 26 shows a typical P1 Tools for reading item.
Figure 26. Example of a P1 Tools for reading item
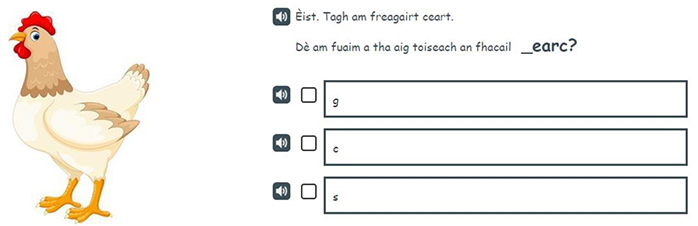
This item assesses learners’ ability to identify what the sound is at the start of a word. This item had audio support for the answer options as well as the question stem, which makes this item easier for learners. Similar items without audio supported answer options would be more difficult for learners.
3.2.5 – MCNG Finding and using information
This organiser focuses on the critical literacy skills of locating information in a text and employing the information to meet a purpose. These skills are often applied in the context of non-fiction texts but can also be applied to fiction. In MCNG, items for P1 and P4 learners that correspond to this organiser generally focus on finding information that is literally stated or requires a low level of inference (for example, recognising synonyms linking the question with the text). More advanced items addressing similar skills – for P7 and S3 –are likely to be applied to longer and more complex texts. At P7, the organiser Finding and using information also includes items requiring learners to sort information in a text into relevant categories. The S3 reading assessment presents Finding and using information items that ask young people to find key information in one or more texts, or to make connections between the information they locate, sometimes across more than one text.
Figure 27. Example of a P4 Finding and using information item
This multiple choice item assesses learners’ ability to identify information which is directly stated in the text; as such it would be an easier item for P4.
3.2.6 – MCNG Understanding, analysing and evaluating
The essence of this organiser is comprehension, beginning with word and sentence level texts (for learners at P1) and with progressively longer and more complex passages of text providing greater challenge across all the reading assessments. While items for the P4 assessment tended to focus on main or prominent ideas, learners at P7 and S3 were asked to answer a range of literal, inferential and evaluative items that, for example, might require learners to distinguish between fact and opinion, recognise persuasive language, use evidence from a text to support answers, or evaluate the reliability and credibility of texts.
Figure 28. Example of a P1 Understanding, analysing and evaluating item
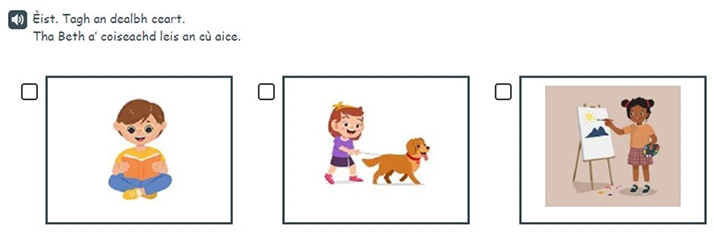
This item assesses learners’ ability to understand a simple sentence in Gaelic and match it to an image. This item has audio support for the question stem, but the answer options do not. The learner must understand what they read/hear and correctly identify the image that matches the sentence. In this instance, the simple sentence states ‘Beth is walking with her dog’.
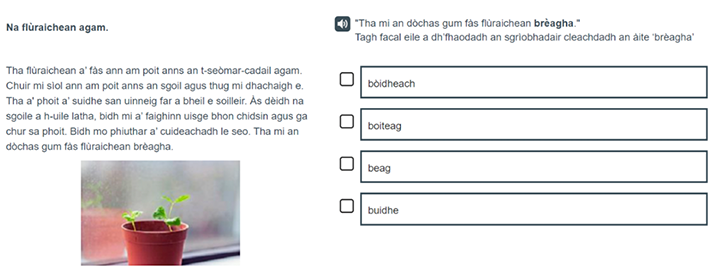
Figure 29. Example of a P4 Understanding, analysing and evaluating item
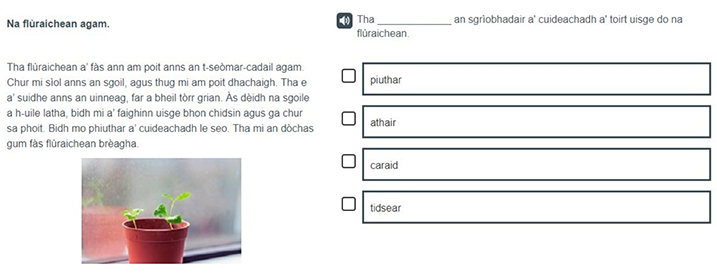
This item is an example of a sentence completion item and asks learners to identify one key word that is contained within the text. This item would be easy to mid difficulty for P4 learners as the answer is not a direct lift from the text, and it requires learners to closely read more than one sentence in order to answer it correctly.
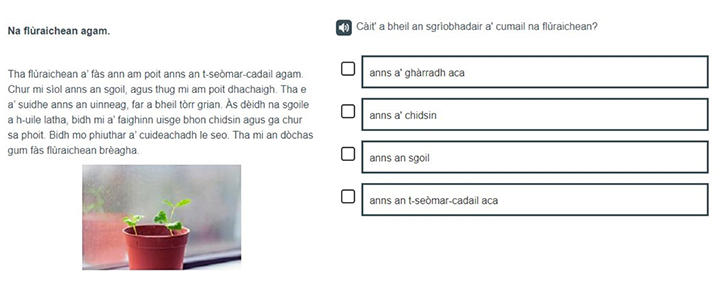
Figure 30. Example of a P4 Understanding, analysing and evaluating item
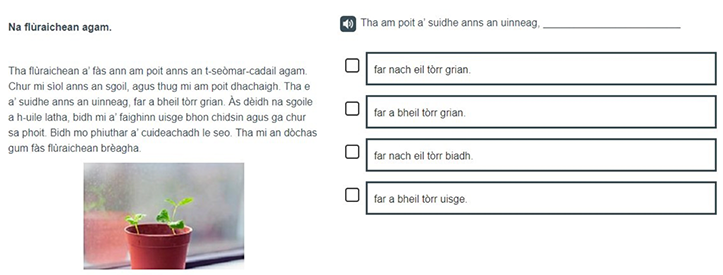
This cloze response item asks learners to identify a phrase within the text to complete the end of the given sentence. This would be an easier item for P4 as the answer is directly stated in the text. The difficulty of this item would increase should the answer not be a direct lift from the text, or if some degree of inference was required.
3.3 SNSA National outcomes for reading/literacy[8]
3.3.1 Overall outcome
Charts 13a to 13e show for each stage (P1, P4, P7 and S3) the overall outcomes of learners for reading/literacy. Where learners are presented with more than 5 items per organiser, they additionally show the outcomes of learners according to the knowledge organisers: Tools for reading (TFR), Understanding, analysing and evaluating (UAE) and Finding and using information (FUI). The bars show outcomes across the six capacity bands that are specific to each stage, in line with SNSA reports for the academic year 2023 to 2024.
For all stages, the majority of learners achieved outcomes in the mid to upper bands, a pattern that holds across the overall summaries and organiser outcomes.
Please note that for all charts, a notable difference refers to a difference of 10 percent or more, a small difference refers to any difference between 5 percent and 10 percent.
In line with the Office for National Statistics (ONS guidelines) data is not available for any assessments where there are fewer than 10 learners in any category or band. These cases are indicated where appropriate in this section of the report.
Chart 13a. SNSA Literacy outcomes for P1 with the exception of Finding and Using Information
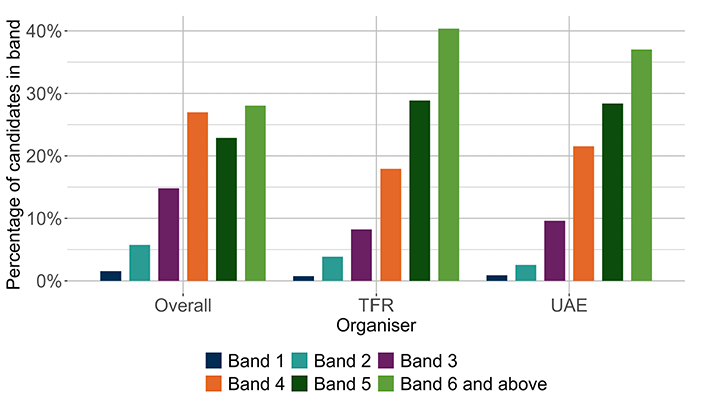
Chart 13b. SNSA Literacy outcomes for the Finding and Using Information organiser
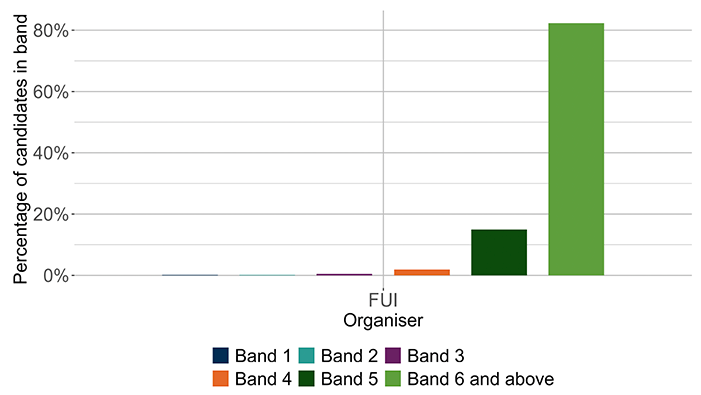
The Finding and Using Information organiser has been separated from the overall outcomes and other organisers to allow easier review of the overall outcomes. Please note that these two charts use different scales.
Overall for P1, the band achieved by the largest proportion of learners was band 6, with 28.0 percent of learners achieving this band. The second most common band achieved by learners was band 4 and the band achieved by the smallest proportion of participants was band 1 with only 1.6 percent of learners scoring in this band. Approximately 50.9 percent of learners achieved bands 5 and 6 and 77.9 percent of learners achieved bands 4 to 6.
As in the overall summaries, band 6 was the modal band achieved by learners for each of the organisers. For the 'Finding and using information' organiser, 82.3 percent of learners achieved bands 6. For the 'Tools for reading' organiser, 69.2 percent of learners achieved bands 5 and 6 and 87.1 percent of learners achieved bands 4 to 6. For the 'Understanding, analysing and evaluating' organiser, 65.4 percent of learners achieved bands 5 and 6 and 86.9 percent of learners achieved bands 4 to 6.
Chart 13c. SNSA Reading outcomes for P4
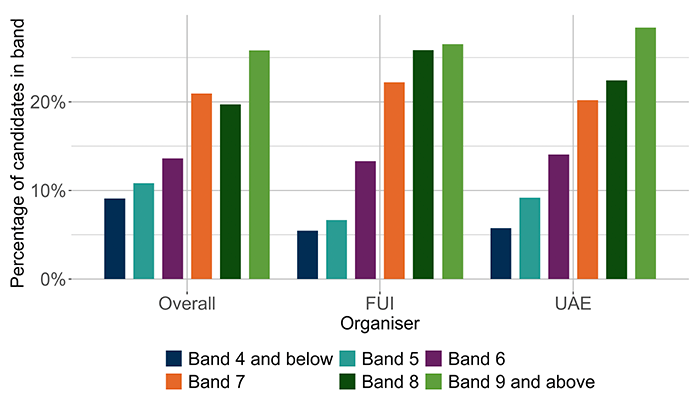
Overall for P4, the largest proportion of learners achieved band 9, with 25.8 percent of learners achieving this band. The second most common band achieved by learners was band 7 and the band achieved by the smallest proportion of participants was band 4 with only 9.1 scoring in this band. Approximately 66.5 percent of learners achieved bands 7 to 9 and 80.1 percent of learners achieved bands 6 to 9.
As with the overall summary, the organisers had the largest proportion of learners achieving outcomes in band 9. For the 'Finding and using information' organiser, 52.3 percent of learners achieved bands 8 and 9 and 87.9 percent of learners achieved bands 6 to 9. For the 'Understanding, analysing and evaluating' organiser, 50.8 percent of learners achieved bands 8 and 9 and 85.1 percent of learners achieved bands 6 to 9.
Chart 13d. SNSA Reading outcomes for P7
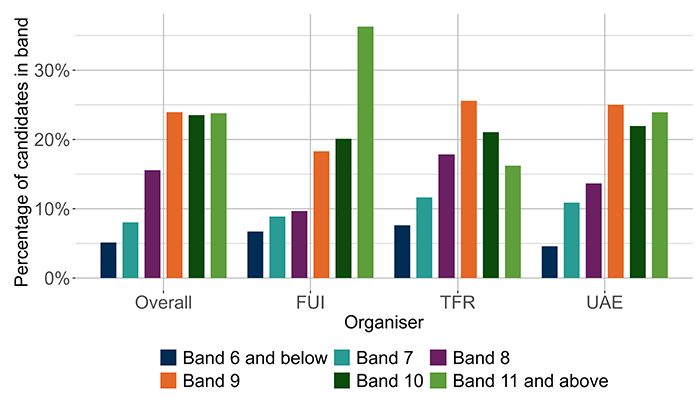
Overall for P7, the largest proportion of learners achieved band 9, with 23.94 percent of learners achieving this band. The second most common band achieved by learners was band 11 and the band achieved by the smallest proportion of participants was band 6 with only 5.13 percent of learners scoring in this band. Approximately 63 percent of learners achieved bands 8 to 10 and 94.9 percent of learners achieved bands 7 to 11.
For the 'Tools for reading' and 'Understanding, analysing and evaluating' organisers, as with the overall summary, the largest proportion of learners achieved band 9, while for the 'Finding and using information' organiser, the band achieved by the largest proportion of learners was band 11.
For the 'Finding and using information' organiser, 93.3 percent of learners achieved bands 7 to 11. For the 'Tools for reading' organiser, 64.5 percent of learners achieved bands 8 to 10 and 92.4 percent of learners achieved bands 7 to 11. For the 'Understanding, analysing and evaluating' organiser, 60.6 percent of learners achieved bands 8 to 10 and 95.4 percent of learners achieved bands 7 to 11.
Chart 13e. SNSA Reading outcomes for S3
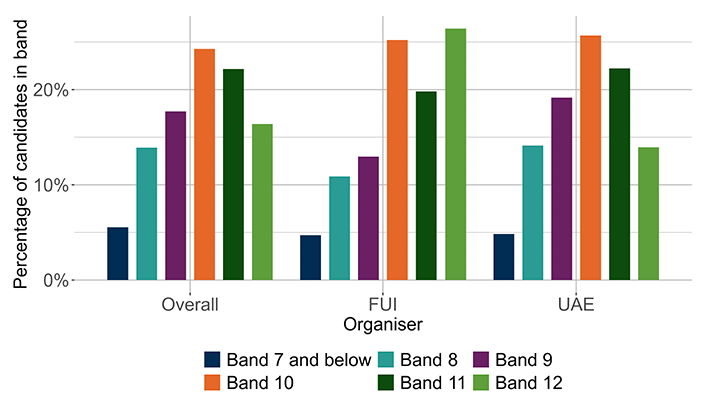
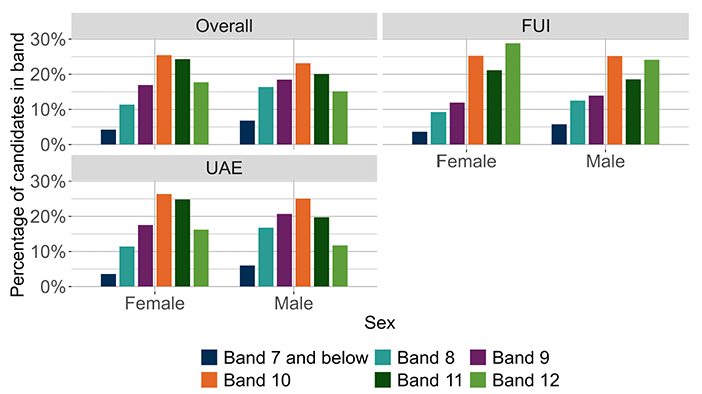
Overall for S3, the band achieved by the largest proportion of learners was band 10, with 24.3 percent of learners achieving this. The second most common band achieved by learners was band 11 and the band achieved by the smallest proportion of participants was band 7 with only 5.6 percent of learners scoring in this band. Approximately 64.1 percent of learners achieved bands 9 to 11 and 94.5 percent of learners achieved bands 8 to 12.
For the 'Finding and using information' organiser, 58 percent of learners achieved bands 9 to 11 and 95.3 percent of learners achieved bands 8 to 12. The modal band for this organiser differed from the Overall summary, with the band achieved by the largest proportion of learners instead being band 12.
For the 'Understanding, analysing and evaluating' organiser, 67.1 percent of learners achieved bands 9 to 11 and 95.2 percent of learners achieved bands 8 to 12. As with the overall summary, the 'Understanding, analysing and evaluating' organiser had the largest proportion of learners achieving outcomes in band 10.
3.3.2 Sex
Charts 14a to 14e show for each stage (P1, P4, P7 and S3) the outcomes for male and female learners for show reading/literacy, both overall and by organiser.
For P1 and P4, for the overall outcomes, the majority of learners achieved outcomes in the mid to upper bands, while for the organisers this was in the upper two bands. At P1 there was a minor difference between male and female learners, while the difference was more pronounced at P4, with a greater proportion of female learners achieving outcomes in the higher bands than males.
For P7, the majority of female learners scored in the upper two bands, whereas the majority of males scored in the two mid to upper bands (9 and 10).
At S3, the largest proportions of male and female learners achieved outcomes in the mid to upper bands, with a greater proportion of females scoring these outcomes than male learners. This was the case for the overall outcomes, and generally was also the case when considering only assessment material related to each of the organisers.
Chart 14a. SNSA Literacy outcomes distributed by sex for P1 with the exception of Finding and Using Information
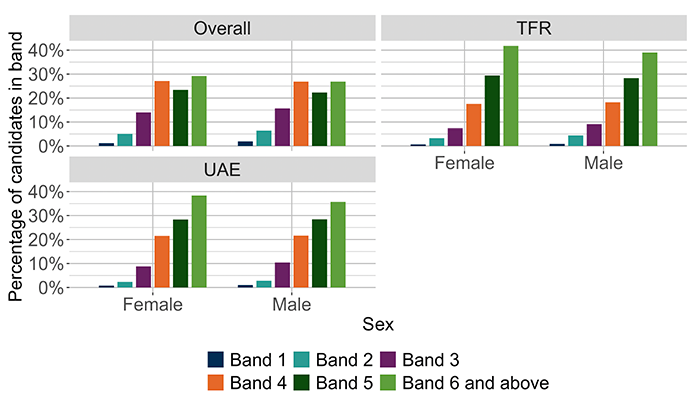
Chart 14b. SNSA Literacy outcomes distributed by sex for P1 for the Finding and Using Information organiser
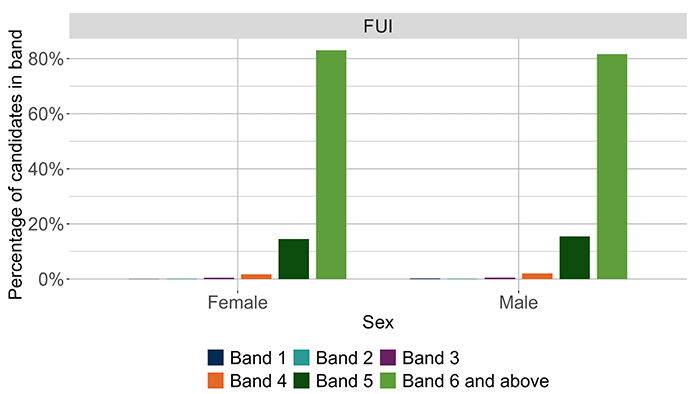
The Finding and Using Information organiser has been separated from the overall outcomes and other organisers to allow easier review of the overall outcomes. Please note that these two charts use different scales.
There were no notable or small differences between the proportion of females and males achieving outcomes in each band, both for the overall summaries and for each organiser.
Chart 14c. SNSA Reading outcomes distributed by sex for P4
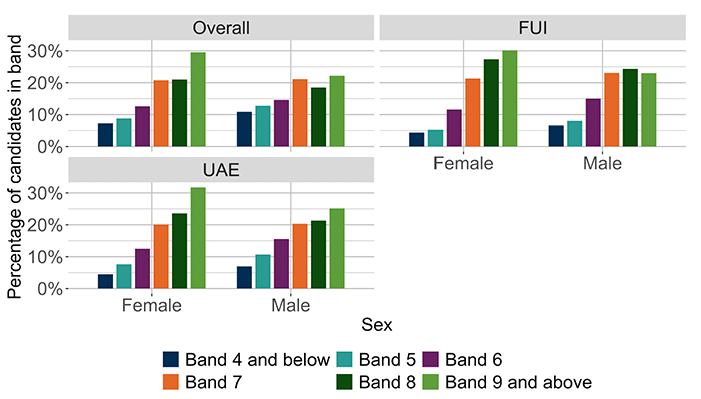
There were no notable differences between the proportion of females and males achieving outcomes in each band overall and for each organiser. Overall, there were small differences between the proportion of females and males achieving outcomes in band 9 with, proportionally, more female learners achieving outcomes in this band.
For the 'Finding and using information' organiser there were small differences between the proportion of females and males achieving outcomes in band 9.
For the 'Understanding, analysing and evaluating' organiser there were small differences between the proportion of females and males achieving outcomes in band 9.
Chart 14d. SNSA Reading outcomes distributed by sex for P7
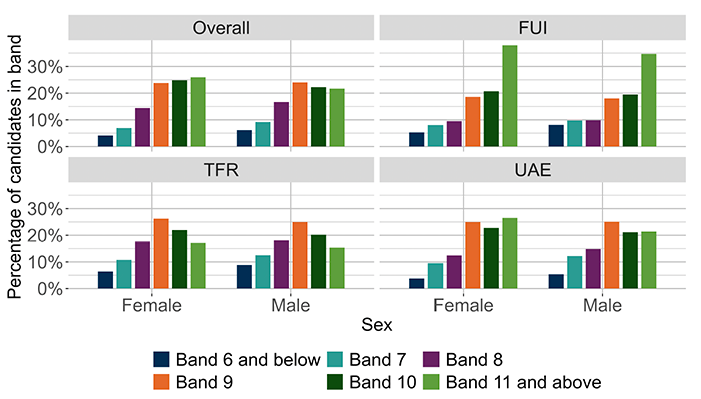
There were no notable differences between the proportion of females and males achieving outcomes in each band overall.
There were no differences between the proportion of females and males achieving outcomes in each band for the 'Finding and using information' and the 'Tools for reading' organiser.
For the 'Understanding, analysing and evaluating' organiser there was a small difference between the proportion of females and males achieving outcomes in band 11.
Chart 14e. SNSA Reading outcomes distributed by sex for S3
There were no notable differences between the proportion of females and males achieving outcomes in each band overall and for each organiser.
There were no differences between the proportion of females and males achieving outcomes in each band for the 'Finding and using information' organiser.
There were small differences between the proportion of females and males achieving outcomes in bands 8 and 11 for the 'Understanding, analysing and evaluating' organiser with, proportionally more male learners achieving outcomes in band 8 and, proportionally more female learners achieving outcomes in band 11.
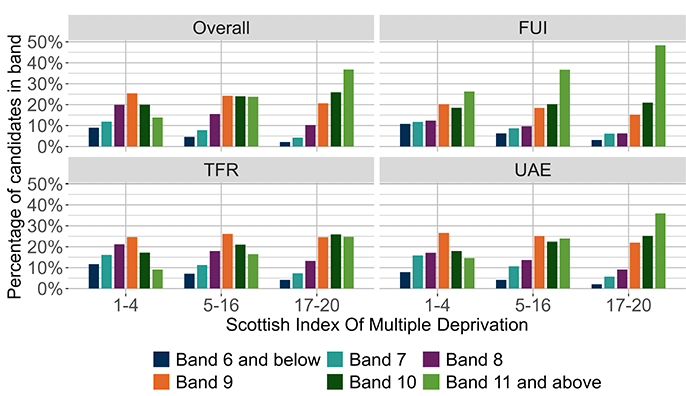
3.3.3 Scottish Index of Multiple Deprivation
This section reviews the distribution of learners for all stages across categories that reflect the Scottish Index of Multiple Deprivation (SIMD). To simplify the display of outcomes and aid their interpretation, we have divided the original 20 categories (vigintiles) into three combined categories of socio-economic background. These combined categories are: SIMD 1–4, indicating the lowest socio-economic quintile (that is, the most deprived children and young people, those in vigintiles 1 to 4); SIMD 5–16, indicating the three middle quintiles (vigintiles 5 to 16); and SIMD 17–20, indicating the highest socio-economic quintile (that is, the least deprived children and young people, those in vigintiles 17 to 20).
Charts 15a to 15e show for each stage (P1, P4, P7 and S3), the proportions of learners achieving each capacity band for learners within these SIMD categories, for both overall outcomes and outcomes in each organiser.
At each stage, the proportions of learners with outcomes corresponding to the upper capacity bands was larger in the least deprived group (SIMD 17–20). Likewise, there were also relatively higher proportions of learners who achieved outcomes in the two lower bands among learners classified in the most deprived group (SIMD 1–4). This pattern was present across all stages, both for reading/literacy overall and by organiser, but was more pronounced in later stages compared to P1, where differences are comparatively small.
Chart 15a. SNSA Literacy outcomes distributed by SIMD for P1 with the exception of Finding and Using Information
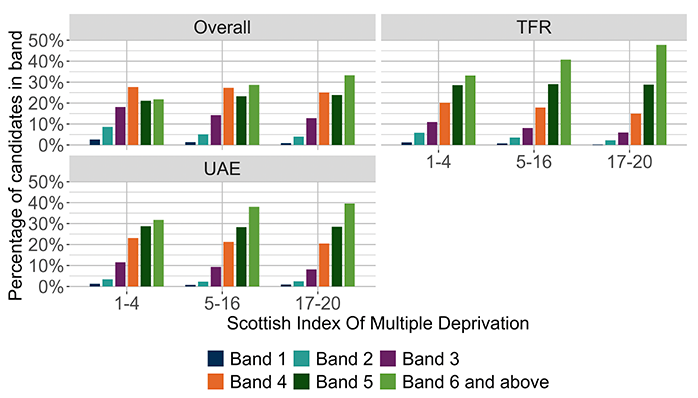
Chart 15b. SNSA Literacy outcomes distributed by SIMD for P1 for Finding and Using Information
The Finding and Using Information organiser has been separated from the overall outcomes and other organisers to allow easier review of the overall outcomes. Please note that these two charts use different scales.
Overall, there was a notable difference between the proportions of learners in SIMD vigintiles 1-4 and 17-20 in band 6. There was no notable difference between the proportions of learners with other SIMD values or in other bands.
There was a small difference between the proportions of learners in SIMD vigintiles 1-4 and 17-20 in band 3. There was no difference between the proportions of learners with other SIMD values or in other bands.
Chart 15c. SNSA Reading outcomes distributed by SIMD for P4
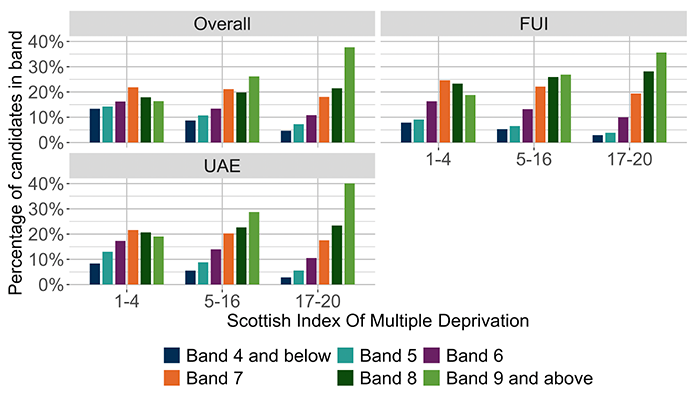
Overall, there was a notable difference between the proportions of learners in SIMD vigintiles 1-4 and 17-20 in band 9, and there was a notable difference between the proportions of learners in SIMD vigintiles 5-16 and 17-20 in band 9. There was no notable difference between the proportions of learners with other SIMD values or in other bands.
There was a small difference between the proportions of learners in SIMD vigintiles 1-4 and 17-20 in bands 4 to 6. There was no difference between the proportions of learners with other SIMD values or in other bands.
Chart 15d. SNSA Reading outcomes distributed by SIMD for P7
Overall, there was a notable difference between the proportions of learners in SIMD vigintiles 1-4 and 17-20 in band 11, and there was a notable difference between the proportions of learners in SIMD vigintiles 5-16 and 17-20 in band 11. There was no notable difference between the proportions of learners with other SIMD values or in other bands.
There was a small difference between the proportions of learners in SIMD vigintiles 1-4 and 17-20 in bands 6, 7, 8 and 10, and there was a small difference between the proportions of learners in SIMD vigintiles 5-16 and 17-20 in band 8. There was no difference between the proportions of learners with other SIMD values or in other bands.
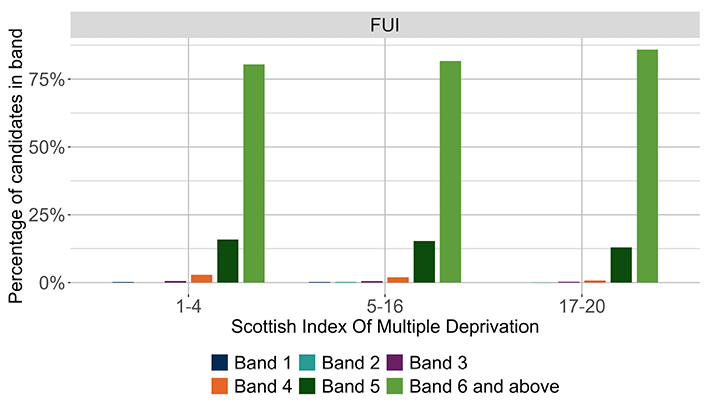
Chart 15e. SNSA Reading outcomes distributed by SIMD for S3
Overall, there was a notable difference between the proportions of learners in SIMD vigintiles 1-4 and 17-20 in bands 8 and 12. There was no notable difference between the proportions of learners with other SIMD values or in other bands.
There was a small difference between the proportions of learners in SIMD vigintiles 1-4 and 17-20 in bands 7, 9 and 11. There was no difference between the proportions of learners with other SIMD values or in other bands. .
3.3.4 Ethnic background
This section looks at differences in outcomes between learners from different ethnic backgrounds. Charts 16a to 16c show the percentages of learners in each of the major ethnic groups for P4 Reading. Outcomes for learners with missing or undisclosed ethnicity data are not included in the charts. A more granular breakdown of the number and percentages of learners in different ethnic groups who completed each assessment is available in Tables 17 to 20 in Appendix 6.
For the ethnicity outcomes, to allow for the presentation of data the MCNG ethnicity groupings differ from those used in SNSA where more granularity can be provided without identification of completers.
The outcomes show that, generally, there were only relatively small differences across the groups, both in terms of overall reading/literacy outcomes and when considering assessment outcomes regarding each of the organisers. For P4, generally, the mid to upper bands were the outcome achieved by the greatest proportion of learners for each ethnic background.
At P4, among learners from any White background and Mixed and multiple ethnic groups backgrounds, there were slightly higher proportions of learners with outcomes in the upper bands than the other major ethnic backgrounds. For the lower capacity bands, there were greater proportions of learners from Caribbean or Black and Other backgrounds achieving these outcomes.
For White Scottish learners, at P4 they most frequently achieved the highest band and the least common outcome amongst these learners was the lowest band.
In line with ONS guidelines the data for P1, P7 and S3 is not reported in order to avoid identifying individual learners.
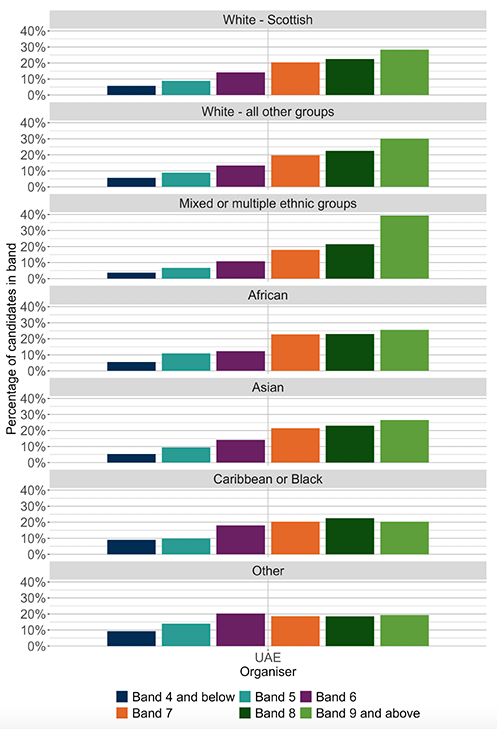
Chart 16a. SNSA Reading outcomes distributed by ethnic background for P4 – overall outcomes
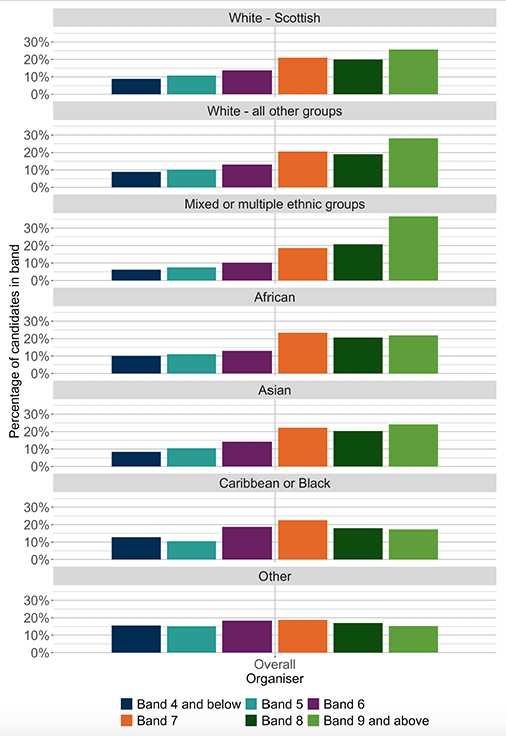
Overall, there were notable differences between the proportions of learners from different ethnic backgrounds in band 9 and there were small differences between outcomes in bands 4 to 6.
There were proportionally more learners from each White background, Mixed or multiple ethnic groups backgrounds and Asian backgrounds achieving outcomes in the highest capacity band compared to the other ethnic groups presented.
There were proportionally more learners from Caribbean or Black and the Other ethnic group achieving outcomes in the lowest capacity bands compared to the other ethnic groups presented.
Chart 16b. SNSA Reading outcomes distributed by ethnic background for P4 – Finding and using information
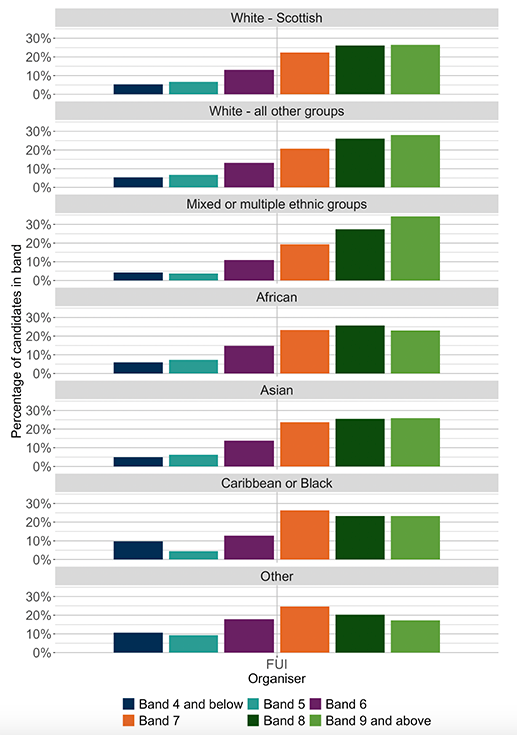
For the 'Finding and using information' organiser, there were notable differences between the proportions of learners from different ethnic backgrounds in band 9 and small differences between outcomes in all other bands.
There were proportionally more learners from Mixed or multiple ethnic groups backgrounds, achieving outcomes in the highest capacity band and proportionally fewer learners from the Other group achieving this outcome compared to the other ethnic groups presented.
There were proportionally more learners from Caribbean and Black and the Other ethnic group backgrounds achieving outcomes in the lowest capacity bands compared to the other ethnic groups presented.
Chart 16c. SNSA Reading outcomes distributed by ethnic background for P4 – Understanding, Analysing and evaluating
For the 'Understanding, Analysing and evaluating' organiser, there were notable differences between the proportions of learners from different ethnic backgrounds in band 9 and small differences between outcomes in bands 4 to 6.
There were proportionally more learners from Mixed or multiple ethnic groups backgrounds, achieving outcomes in the highest capacity band and proportionally fewer learners from the Caribbean or Black and the Other group backgrounds achieving this outcome compared to the other ethnic groups presented.
There were proportionally more learners from Caribbean and Black and the Other ethnic group backgrounds achieving outcomes in the lowest capacity bands compared to the other ethnic groups presented.
3.3.5 Free School Meal Entitlement
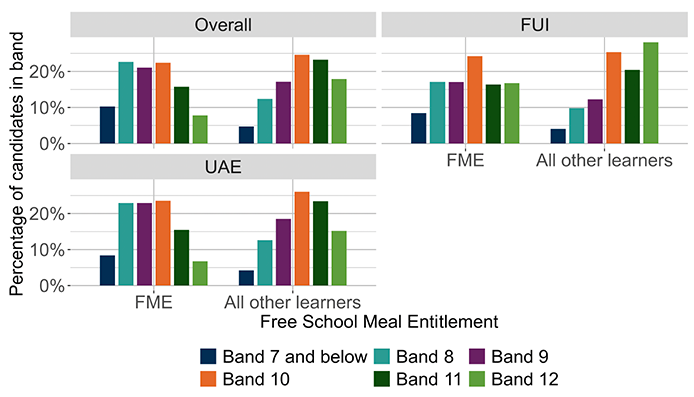
Charts 17a to 17e show literacy/reading outcomes of learners according to entitlement to free school meals (FME), distinguishing those with entitlement from all other learners, for each stage (P1, P4, P7 and S3). Outcomes are given for the overall outcomes and by organiser.
Across all stages, there were noticeably larger proportions with outcomes in the upper two capacity bands among learners not entitled to free school meals than among those with FME. Correspondingly, there were higher proportions of outcomes in the lower two capacity bands among learners with FME. This pattern was evident across all stages, both for reading/literacy overall and by organiser.
For learners with FME, the majority of outcomes were in the middle bands whereas the greatest proportion of learners not entitled to free school meals had outcomes in the mid to upper bands.
Chart 17a. SNSA Literacy outcomes distributed by FME for P1 with the exception of Finding and Using Information
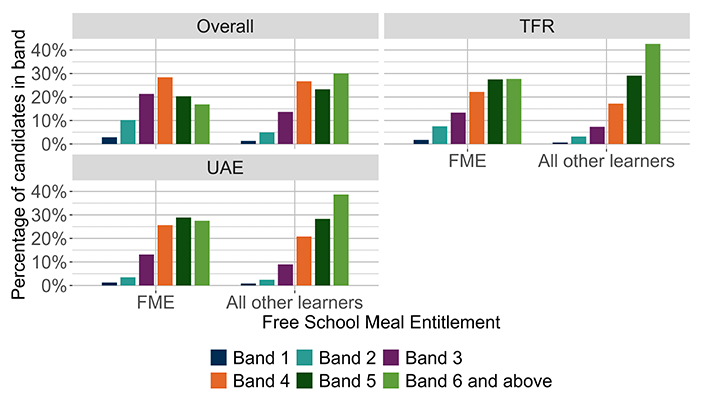
Chart 17b. SNSA Literacy outcomes distributed by FME for P1 for Finding and Using Information
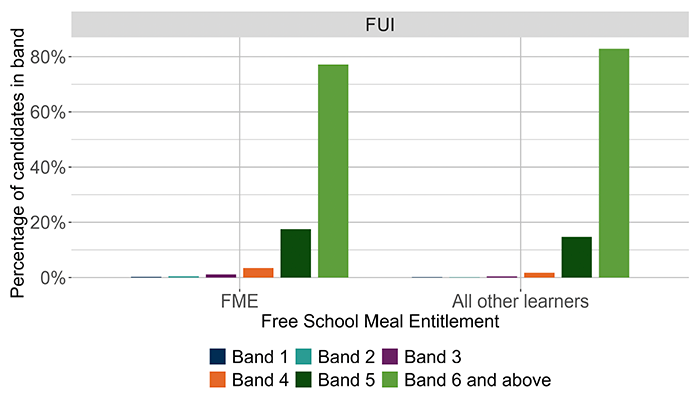
The Finding and Using Information organiser has been separated from the overall outcomes and other organisers to allow easier review of the overall outcomes. Please note that these two charts use different scales.
Chart 17c. SNSA Reading outcomes distributed by FME for P4
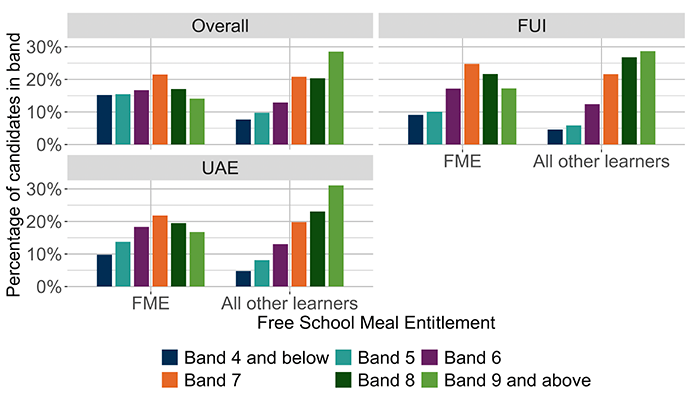
Chart 17d. SNSA Reading outcomes distributed by FME for P7
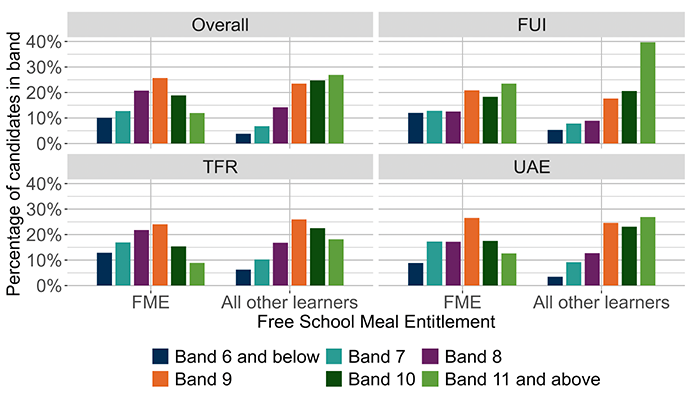
Chart 17e. SNSA Reading outcomes distributed by FME for S3
3.3.6 Additional Support Needs
Charts 18a to 18e show literacy/reading outcomes of learners according to whether or not learners were registered as learners with Additional Support Needs (ASN), distinguishing those registered as learners with ASN from all other learners, for each stage (P1, P4, P7 and S3). Outcomes are given for the overall outcomes and by organiser.
For all stages, the proportions of learners in the two upper bands were notably larger among learners without ASN. Similarly, there were relatively larger proportions of learners with ASN in the two lower bands. These differences were similar overall as well as when considering each organiser separately.
While in P1, differences between the proportions of learners with and without ASN in the two lower bands were somewhat less pronounced, at P4, P7 and S3, the proportion of learners with ASN in the two lower bands tended to be approximately double the proportion of learners without ASN.
Chart 18a. SNSA Literacy outcomes distributed by ASN for P1 with the exception of Finding and Using Information

Chart 18b. SNSA Literacy outcomes distributed by ASN for P1 for Finding and Using Information
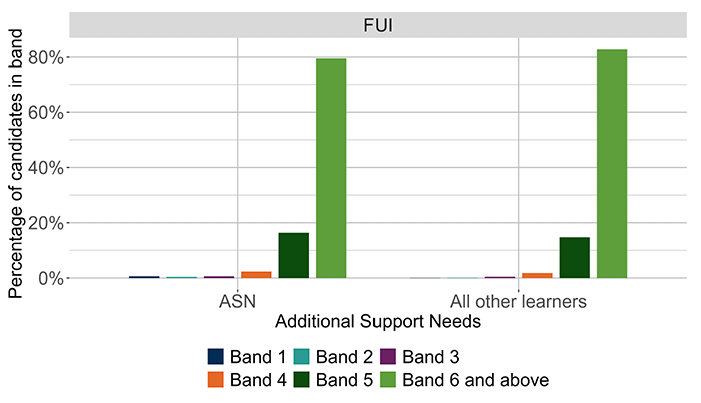
The Finding and Using Information organiser has been separated from the overall outcomes and other organisers to allow easier review of the overall outcomes. Please note that these two charts use different scales.
Chart 18c. SNSA Reading outcomes distributed by ASN for P4
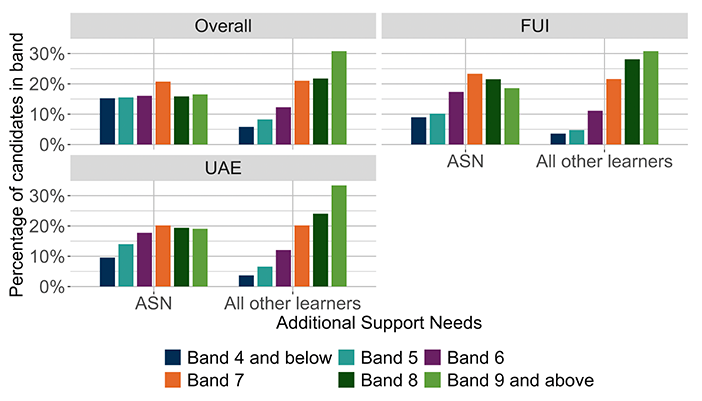
Chart 18d. SNSA Reading outcomes distributed by ASN for P7
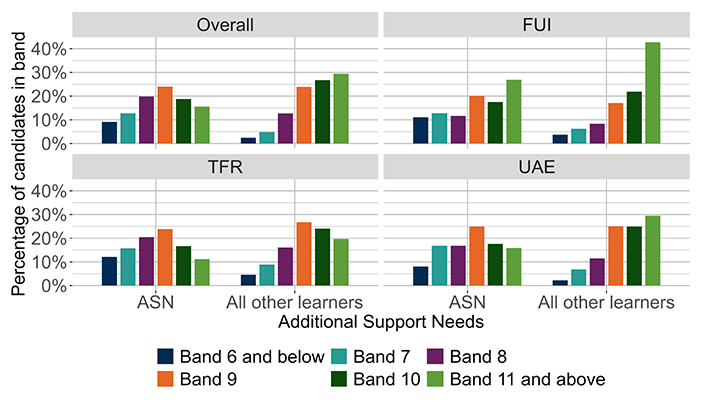
Chart 18e. SNSA Reading outcomes distributed by ASN for S3
3.3.7 Looked After Children
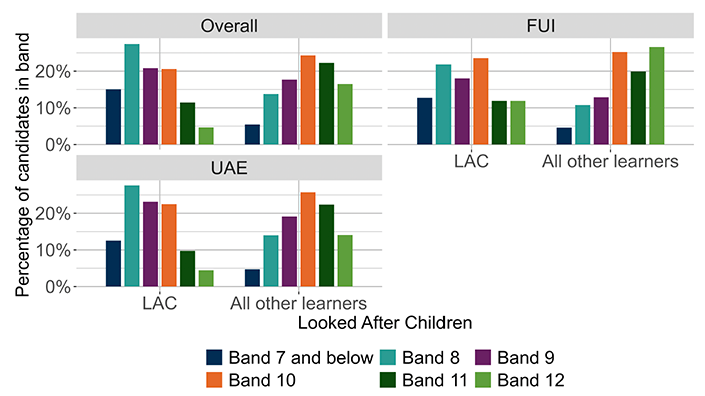
Charts 19a to 19c show literacy/reading outcomes of learners according to whether or not learners were learners who were classified as Looked After Children (LAC) either at Home or Away from Home. The information was taken from the national database, SEEMiS, and compares LAC with all other learners, for P4, P7 and S3. Outcomes are given for the overall outcomes and by organiser.
Across all stages, among learners classified as Looked After Children, smaller proportions achieved outcomes in the two upper capacity bands, compared to other learners without these classifications. Similarly, for the lower capacity bands, there was a higher proportion of learners classified as Looked After Children achieving these outcomes compared to all other learners. These patterns can be seen across stages and generally hold for organiser outcomes in addition to the overall summaries.
In line with ONS guidelines the data for P1 is not reported in order to avoid identifying individual learners.
Chart 19a. SNSA Reading outcomes distributed by LAC for P4
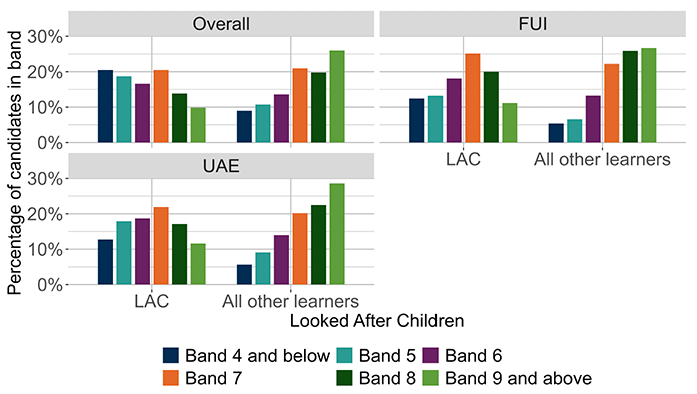
Chart 19b. SNSA Reading outcomes distributed by LAC for P7
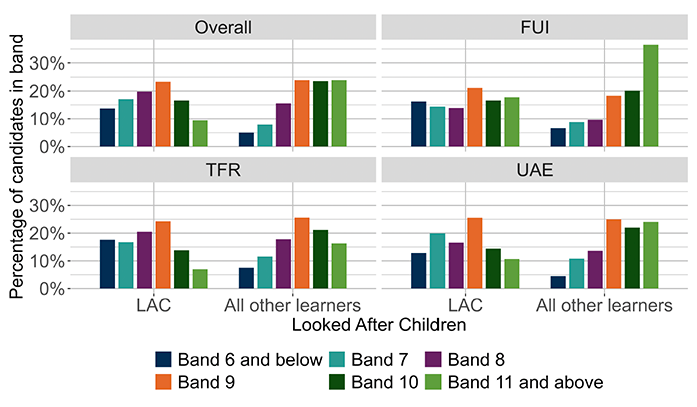
Chart 19c. SNSA Reading outcomes distributed by LAC for S3
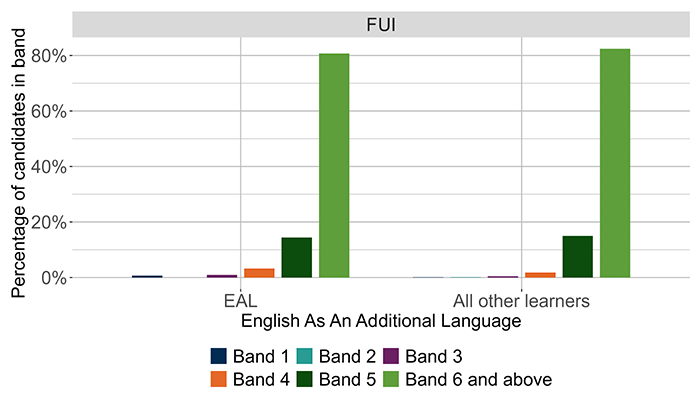
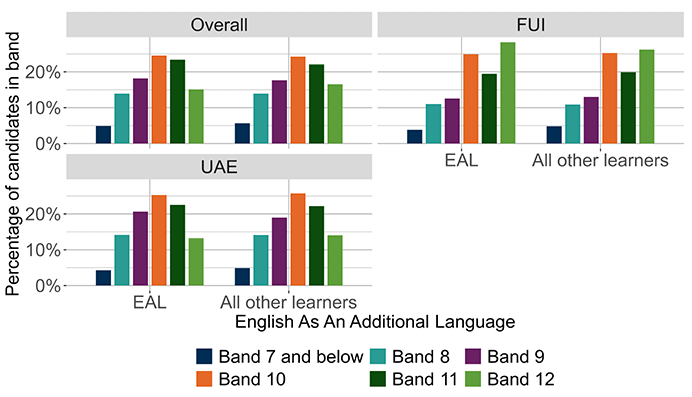
3.3.8 English as an Additional Language
Charts 20a to 20e show literacy/reading outcomes of learners according to language background and compares learner who have English as an Additional Language (EAL) with all other learners, for each stage (P1, P4, P7 and S3). Outcomes are given for the overall outcomes and by organiser.
At P1, there were minimal differences in the proportion of learners achieving outcomes in the lowest two capacity bands and more noticeable differences in the proportions achieving the highest capacity bands.
For P4 and P7, a greater proportion of learners for whom English is an Additional Language achieved outcomes in the lowest bands compared to the learners for whom English is their first language. The reverse was true for the highest capacity bands.
When comparing learners for whom English is an Additional Language (EAL) and those for whom English is their first language at S3, we observed only relatively small differences in the proportion of learners achieving outcomes in the lowest two and highest two capacity bands.
Chart 20a. SNSA Literacy outcomes distributed by EAL for P1 with the exception of Finding and Using Information
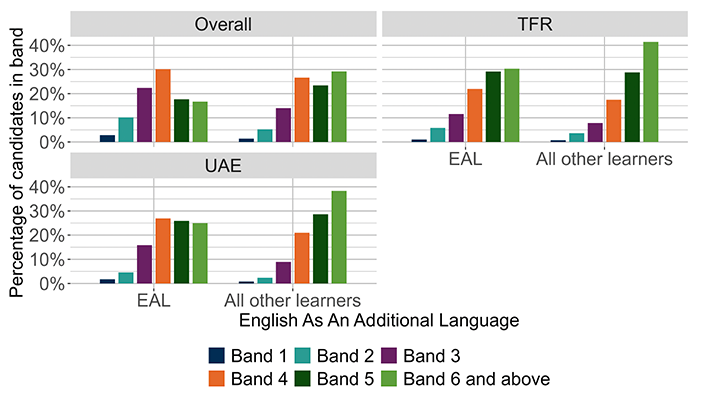
Chart 20b. SNSA Literacy outcomes distributed by EAL for P1 for Finding and Using Information
The Finding and Using Information organiser has been separated from the overall outcomes and other organisers to allow easier review of the overall outcomes. Please note that these two charts use different scales.
Chart 20c. SNSA Reading outcomes distributed by EAL for P4
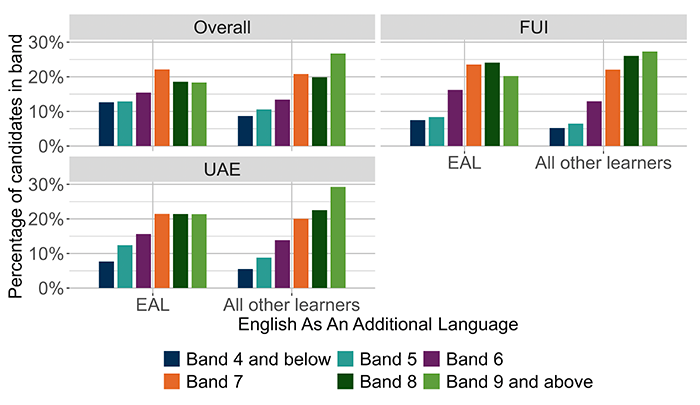
Chart 20d. SNSA Reading outcomes distributed by EAL for P7
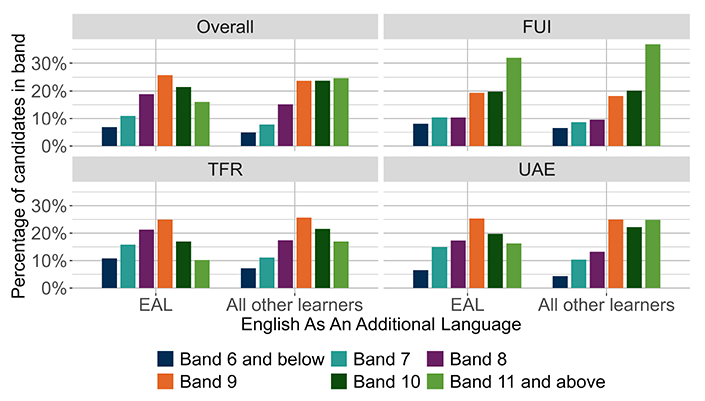
Chart 20e. SNSA Reading outcomes distributed by EAL for S3
3.4 MCNG National outcomes for reading/literacy
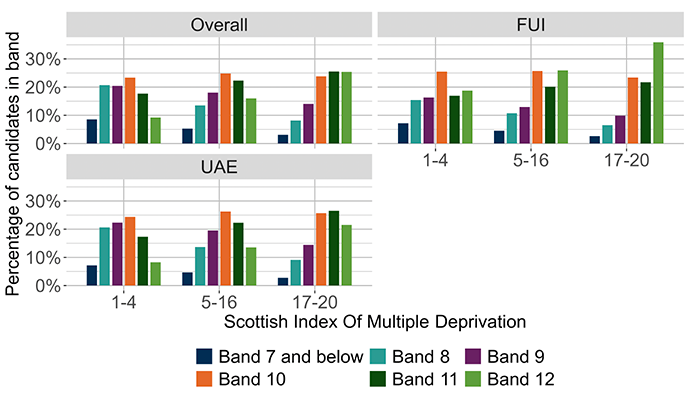
3.4.1 Overall outcome
Charts 21a to 21e show the overall outcomes of learners for reading/literacy for stages P4, P7 and S3. Where learners are presented with more than 5 items per organiser, they additionally show the outcomes of learners according to the knowledge organisers: Tools for reading (TFR), Understanding, analysing and evaluating (UAE) and Finding and using information (FUI). The bars show outcomes across the six capacity bands that are specific to each stage, in line with MCNG reports for the academic year 2023 to 2024.
For P4 and P7 learners, the highest capacity bands were the most commonly achieved bands and for S3 learners, the most commonly achieved bands was the lowest capacity band.
Please note that for all charts, a notable difference refers to a difference of 10 percent or more, a small difference refers to any difference between 5 percent and 10 percent.
In line with ONS guidelines the data for P1 is not reported in order to avoid identifying individual learners.
Chart 21a. MCNG Reading outcomes for P4 with the exception of Tools for Reading
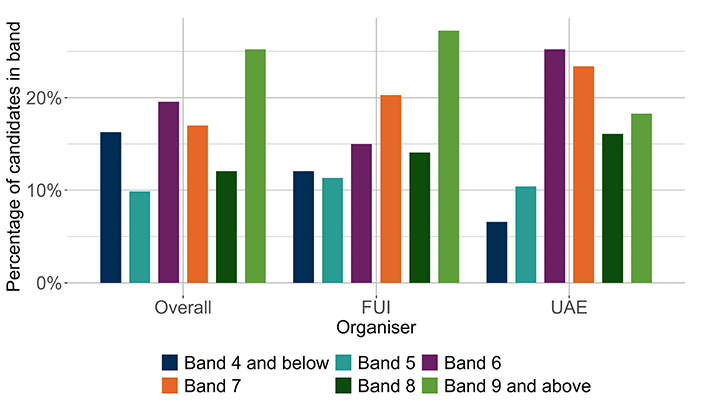
Chart 21b. MCNG Reading outcomes for P4 for Tools for Reading

The Tools for Reading organiser has been separated from the overall outcomes and other organisers to allow easier review of the overall outcomes. Please note that these two charts use different scales.
Overall for P4, the band achieved by the largest proportion of learners was band 9, with 25.2 percent of learners achieving this band. The second most common band achieved by learners was band 6 and the band achieved by the smallest proportion of participants was band 5 with only 9.87 percent of learners scoring in this band. Approximately 54.3 percent of learners achieved bands 7 to 9 and 83.7 percent of learners achieved bands 5 to 9.
As with the overall summary, the 'Finding and using information' and the 'Tools for reading' organisers had the largest proportion of learners achieving outcomes in band 9. The modal band for the 'Understanding, analysing and evaluating' organiser differed from the Overall summary, with the band achieved by the largest proportion of learners instead being band 6.
For the 'Finding and using information' organiser, 61.6 percent of learners achieved bands 7 to 9 and 76.6 percent of learners achieved bands 6 to 9. For the 'Tools for reading' organiser, 76.9 percent of learners achieved bands 9. For the 'Understanding, analysing and evaluating' organiser, 57.8 percent of learners achieved bands 7 to 9 and 83.0 percent of learners achieved bands 6 to 9.
Chart 21c. MCNG Reading outcomes for P7 with the exception of Tools for Reading
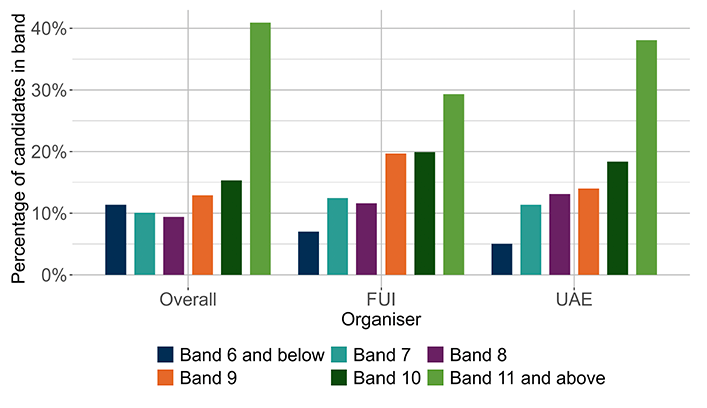
Chart 21d. MCNG Reading outcomes for P7 for Tools for Reading
The Tools for Reading organiser has been separated from the overall outcomes and other organisers to allow easier review of the overall outcomes. Please note that these two charts use different scales.
Overall for P7, the band achieved by the largest proportion of learners was band 11, with 40.9 percent of learners achieving this band. The second most common band achieved by learners was band 10 and the band achieved by the smallest proportion of participants was band 8 with only 9.4 percent of learners scoring in this band. Approximately 56.2 percent of learners achieved bands 10 or 11 and 78.6 percent of learners achieved bands 8 to 11.
As with the overall summary, for each of the organisers, the largest proportion of learners achieved outcomes in band 11. For the 'Finding and using information' organiser, 68.9 percent of learners achieved bands 9 to 11 and 80.5 percent of learners achieved bands 8 to 11. For the 'Tools for reading' organiser, 71 percent of learners achieved band 11 and 81.2 percent of learners achieved bands 10 and 11. For the 'Understanding, analysing and evaluating' organiser, 56.5 percent of learners achieved bands 10 and 11 and 83.6 percent of learners achieved bands 8 to 11.
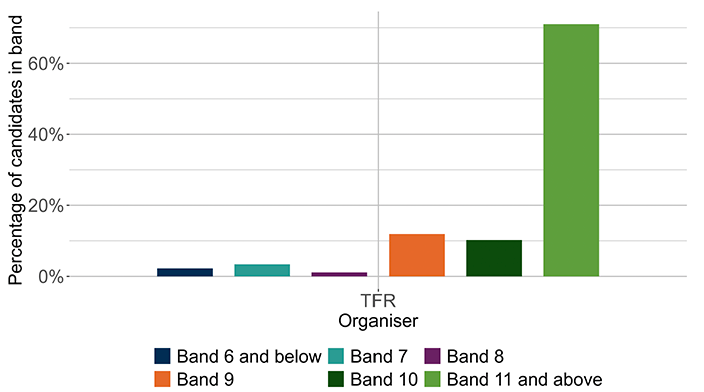
Chart 21e. MCNG Reading outcomes for S3
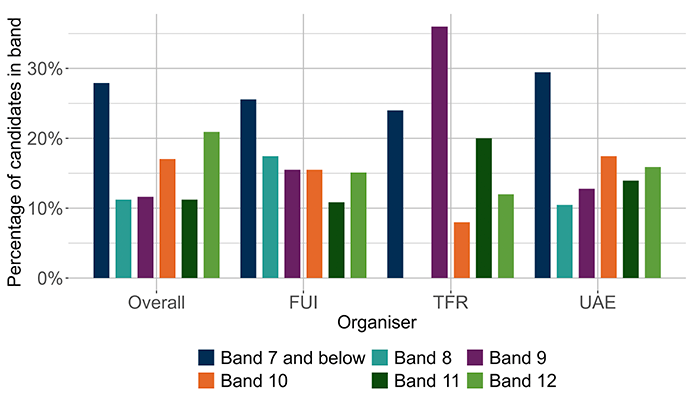
Overall for S3, the band achieved by the largest proportion of learners was band 7, with 27.9 percent of learners achieving this band. The second most common band achieved by learners was band 12 and the band achieved by the smallest proportion of participants was band 8, with only 11.2 percent of learners scoring in this band. Approximately 50.8 percent of learners achieved bands 7 to 9 and 79.1 percent of learners achieved bands 7 to 11.
As with the overall summary, the 'Finding and using information' and the 'Understanding, analysing and evaluating' organisers had the largest proportion of learners achieving outcomes in band 7. The modal band for the 'Tools for reading' organiser differed, with the band achieved by the largest proportion of learners instead being band 9.
For the 'Finding and using information' organiser, 58.5 percent of learners achieved bands 7 to 9 and 84.9 percent of learners achieved bands 7 to 11. For the 'Tools for reading' organiser, 60 percent of learners achieved bands 7 to 9 and 88 percent of learners achieved bands 7 to 11. For the 'Understanding, analysing and evaluating' organiser, 52.7 percent of learners achieved bands 7 to 9 and 84.1 percent of learners achieved bands 7 to 11.
3.4.2 Sex
Charts 22a to 22e show the outcomes for male and female learners for reading/literacy, both overall and by organiser for P4, P7 and S3.
For P4, for the overall outcomes, the majority of learners achieved outcomes in highest capacity band, while for the UAE organiser this was in the middle bands. For P7, the majority of learners, both male and female, achieved the highest capacity band for both reading overall and the organisers. At S3, the largest proportions of male learners achieved the lowest capacity band whereas the greatest proportion of female learners achieved outcomes in the upper band. Also, in S3, there was a greater proportion of learners achieving outcomes in the lowest capacity band compared to previous stages.
Across all stages, there were differences in the proportion of male and female learners achieving the lowest and highest capacity bands, with a greater percentage of males scoring in the lowest band and more females achieving the upper band. This pattern is more pronounced in the later stages, with only slight differences seen at P4.
In line with ONS guidelines the data for P1 is not reported in order to avoid identifying individual learners.
Chart 22a. MCNG Reading outcomes distributed by sex for P4 with the exception of Tools for Reading
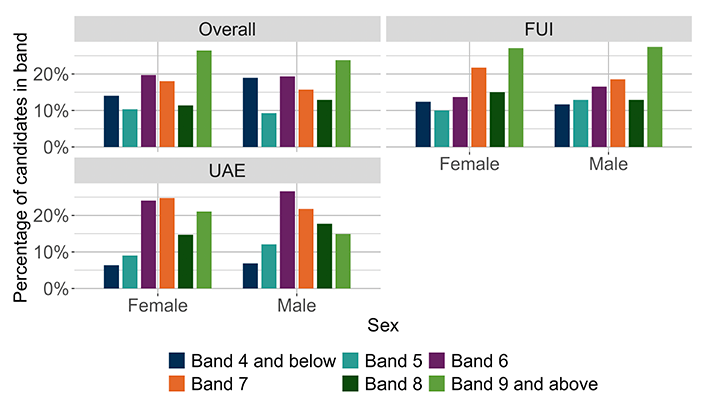
Chart 22b. MCNG Reading outcomes distributed by sex for P4 for Tools for Reading
The Tools for Reading organiser has been separated from the overall outcomes and other organisers to allow easier review of the overall outcomes. Please note that these two charts use different scales.
Overall, there were no notable or small differences between the proportion of females and males achieving outcomes in each band.
There were no notable or small differences between the proportion of females and males achieving outcomes in each band for the 'Finding and using information' organiser.
For the 'Tools for reading' organiser, there were notable differences between the proportion of females and males achieving outcomes in band 9 with proportionally more females learners achieving outcomes in this band than male learners.
For the 'Understanding, analysing and evaluating' organiser there were small differences between the proportion of females and males achieving outcomes in band 9.
Chart 22c. MCNG Reading outcomes distributed by sex for P7 with the exception of Tools for Reading
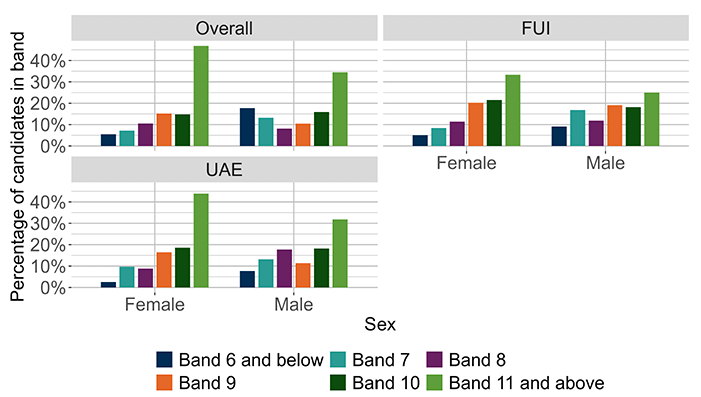
Chart 22d. MCNG Reading outcomes distributed by sex for P7 for Tools for Reading

The Tools for Reading organiser has been separated from the overall outcomes and other organisers to allow easier review of the overall outcomes. Please note that these two charts use different scales.
Overall, there were notable differences between the proportion of females and males achieving outcomes in bands 6 and 11 with proportionally more female learners achieving outcomes in band 11 and proportionally more male learners achieving outcomes in band 6.
For the 'Finding and using information' organiser, there were small differences between the proportion of females and males achieving outcomes in bands 7 and 11.
For the 'Tools for reading' organiser, there were notable differences between the proportion of females and males achieving outcomes in band 11. There were small differences between the proportion of females and males achieving outcomes in band 9.
For the 'Understanding, analysing and evaluating' organiser, there were notable differences between the proportion of females and males achieving outcomes in band 11. There were small differences between the proportion of females and males achieving outcomes in bands 6, 8 and 9.
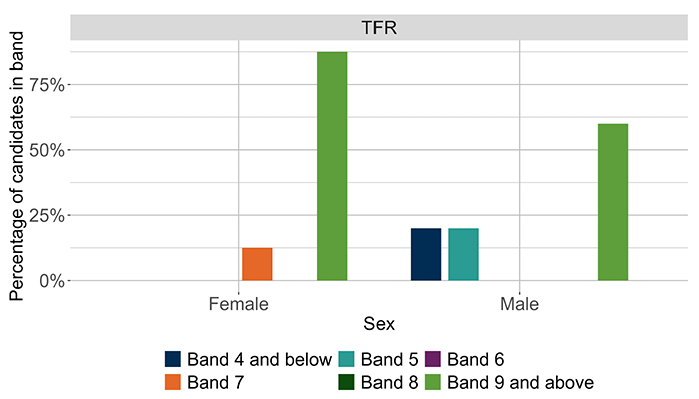
Chart 22e. MCNG Reading outcomes distributed by sex for S3
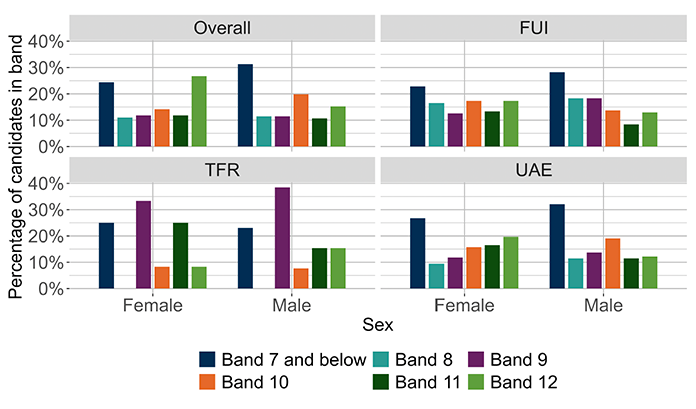
Overall, there were notable differences between the proportion of females and males achieving outcomes in band 12 and there were small differences in band 10 with proportionally more female learners achieving outcomes in band 12 and proportionally more male learners achieving outcomes in band 10.
For the 'Finding and using information' organiser, there were small differences between the proportion of females and males achieving outcomes in bands 7 and 9.
For the 'Tools for reading' organiser, there were small differences between the proportion of females and males achieving outcomes in bands 9, 11 and 12.
For the 'Understanding, analysing and evaluating' organiser, there were small differences between the proportion of females and males achieving outcomes in bands 7, 11 and 12.
3.4.3 Scottish Index of Multiple Deprivation
In line with ONS guidelines the data for all stages is not reported in order to avoid identifying individual learners.
3.4.4 Ethnic background
This section looks at differences in outcomes between learners from 'White Scottish' and other ethnic backgrounds. Charts 23a to 23d show the percentages of learners in each of the comparison groups at P4. A more granular breakdown of the number and percentages of learners in different ethnic groups who completed each assessment is available in Tables 27 to 30 in Appendix 7.
For the ethnicity outcomes, to allow for the presentation of data the MCNG ethnicity groupings differ from those used in SNSA where more granularity can be provided without identification of completers.
The outcomes show that, generally, there were only small differences across the two comparison groups, both in terms of overall outcomes and when considering assessment outcomes regarding each of the organisers.
For P4, generally, the highest band was the outcome achieved by the greatest proportion of learners for each ethnic background, with a slightly higher proportion of the learners from other ethnic backgrounds achieving this outcome. The proportion of learners achieving outcomes in the other bands was comparable between the two groups.
In line with ONS guidelines the data for P1, P7 and S3 is not reported in order to avoid identifying individual learners.
Chart 23a. MCNG Reading outcomes distributed by ethnic background for P4 - overall outcomes
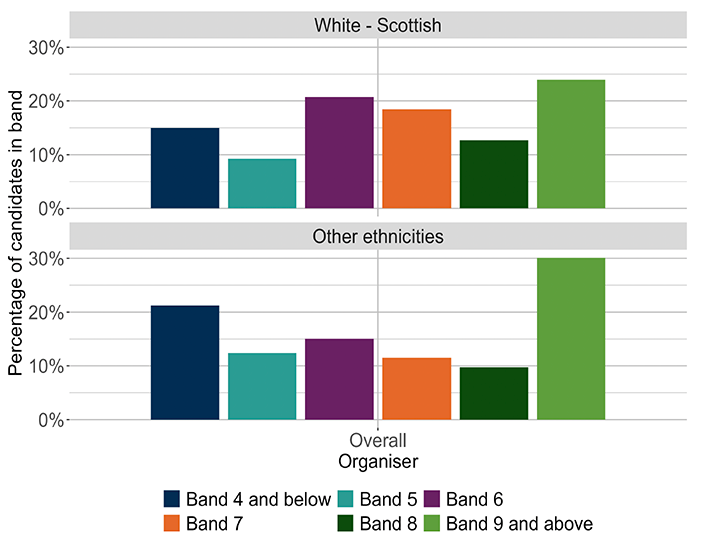
Overall, there were small differences between the proportion of White Scottish and Other ethnicities learners achieving outcomes in bands 4, 6, 7 and 9, with slightly larger proportions of White Scottish learners achieving bands 4, 6 and 7 and larger proportions of Other ethnicities learners achieving outcomes in the highest band, band 9.
Chart 23b. MCNG Reading outcomes distributed by ethnic background for P4 – Finding and using information
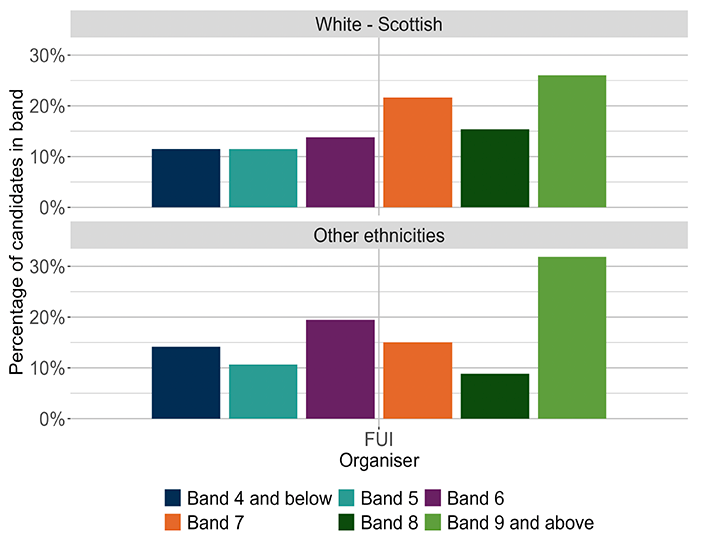
There were small differences between the proportion of White Scottish and Other ethnicities achieving outcomes in bands 6 to 9 for the 'Finding and using information' organiser, with larger proportions of White Scottish learners achieving bands 7 and 8 and larger proportions of Other ethnicities learners achieving outcomes in the bands 6 and 9.
Chart 23c. MCNG Reading outcomes distributed by ethnic background for P4 – Tools for reading
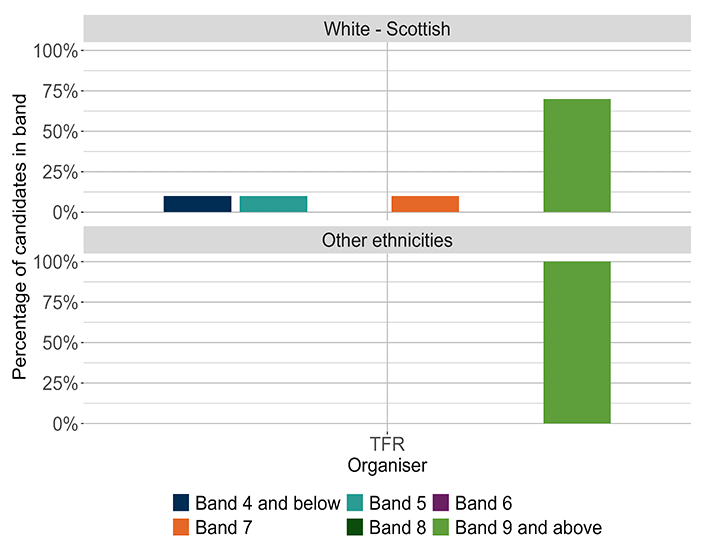
Whilst there were notable differences between the proportion of White – Scottish and Other ethnicities achieving outcomes in band 9 with a greater proportion of Other ethnicities achieving outcomes in the highest band for the 'Tools for Reading' organiser, the number of learners in this category is very low so any inferences regarding ability should be made with caution as this does not represent a significant difference in terms of raw numbers.
Chart 23d. MCNG Reading outcomes distributed by ethnic background for P4 – Understanding, analysing and evaluating
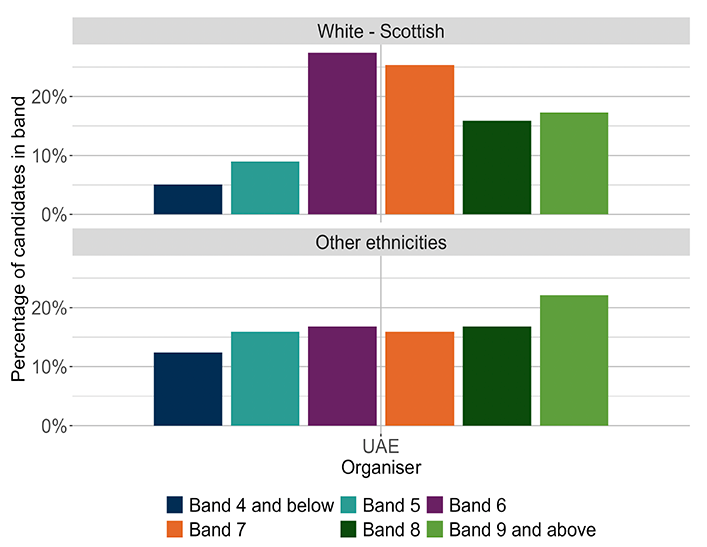
For the 'Understanding, analysing and evaluating' organiser, there were notable differences between the proportion of White Scottish and Other ethnicities achieving outcomes in band 6, with a greater proportion of White Scottish learners achieving this band. There were small differences in band 4, with this band being a more common outcome for the Other ethnicities group, in band 5 with a larger proportion of Other ethnicities learners achieving this outcome and band 7 which was a more frequent outcome for White Scottish learners.
3.3.5 Free School Meal Entitlement
Charts 24a and 24b show reading outcomes of learners according to entitlement to free school meals (FME), distinguishing those with entitlement from all other learners, for P4. Outcomes are given for the overall outcomes and by organiser.
For P4, there was a larger proportion with outcomes in the upper two capacity bands among learners entitled to free school meals than among those not entitled to free school meals. Correspondingly, there were lower proportions of outcomes in the lowest capacity band among learners with FME. This pattern was evident for reading overall and by organiser.
In line with ONS guidelines the data for P1, P7 and S3 is not reported in order to avoid identifying individual learners.
Chart 24a. MCNG Reading outcomes distributed by FME for P4 with the exception of Tools for Reading
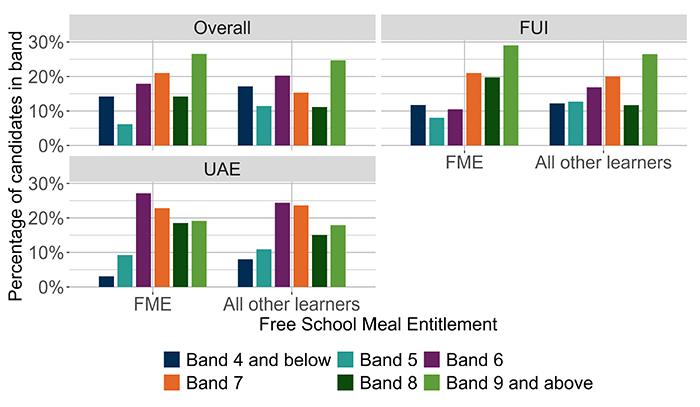
Chart 24b. MCNG Reading outcomes distributed by FME for P4 for Tools for Reading
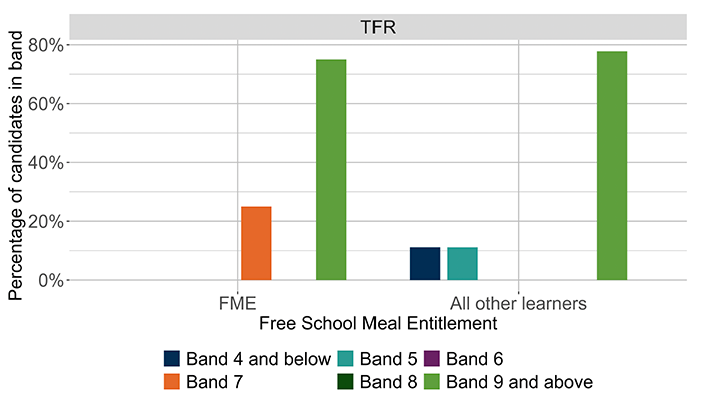
The Tools for Reading organiser has been separated from the overall outcomes and other organisers to allow easier review of the overall outcomes. Please note that these two charts use different scales.
Overall, there were no notable differences between the proportion of all other learners and learners that are entitled to FME achieving outcomes in each band overall and for each organiser. There were small differences between the proportion of all other learners and learners that are entitled to FME achieving outcomes in bands 5 and 7.
Whilst there were notable differences in the proportion of learners achieving outcomes in bands 4,5 and 7 in the Tools for Reading organiser, the number of learners in these categories is very low so any inferences regarding ability should be made with caution as this does not represent a significant difference in terms of raw numbers.
3.4.6 Additional Support Needs
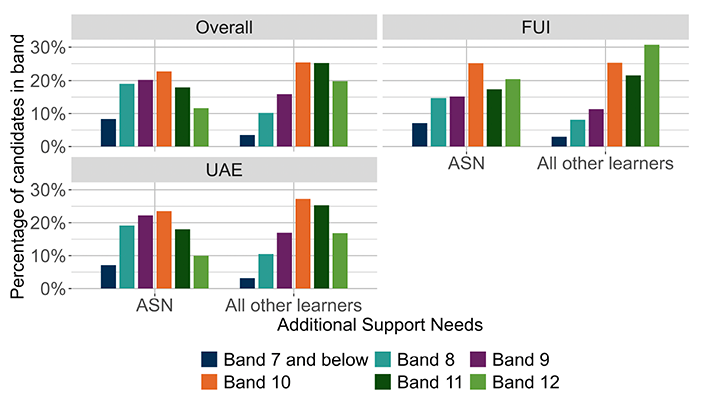
Charts 25a to 25d show reading/literacy outcomes of learners according to whether or not learners were registered as learners with Additional Support Needs (ASN), distinguishing those registered as learners with ASN from all other learners, for P4 and P7. Outcomes are given for the overall outcomes and by organiser.
For each stage, the proportions of learners in the two upper bands were larger among learners without ASN. Similarly, there were relatively larger proportions of learners with ASN in the two lower bands. These differences were similar for reading overall as well as when considering each organiser separately.
In line with ONS guidelines the data for P1 and S3 is not reported in order to avoid identifying individual learners.
Chart 25a. MCNG Reading outcomes distributed by ASN for P4 with the exception of Tools for Reading
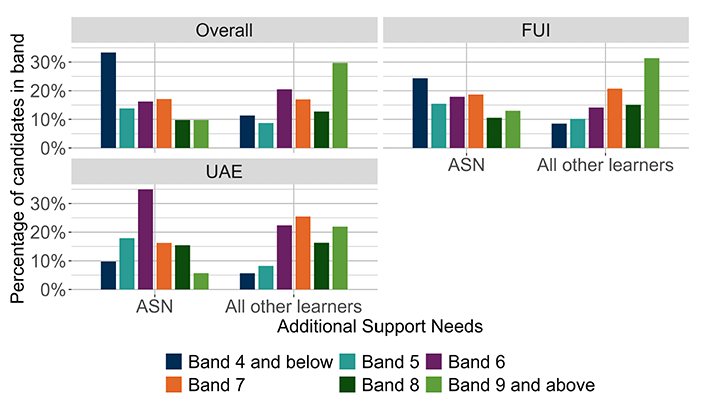
Chart 25b. MCNG Reading outcomes distributed by ASN for P4 for Tools for Reading
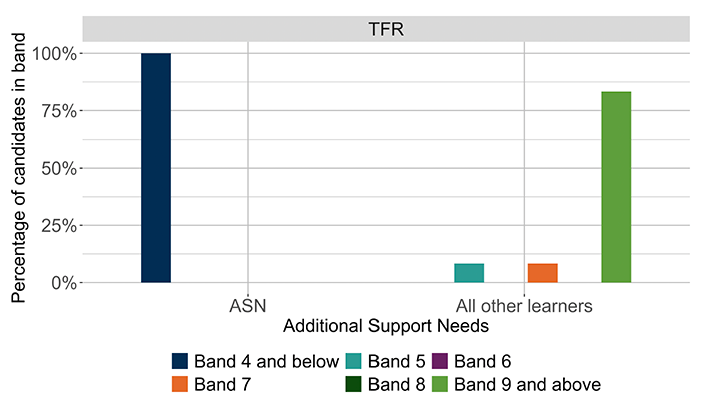
The Tools for Reading organiser has been separated from the overall outcomes and other organisers to allow easier review of the overall outcomes. Please note that these two charts use different scales.
Overall, there were notable differences between the proportion of learners that have ASN and all other learners achieving outcomes in bands 4 and 9 with a greater proportion of learners without ASN achieving outcomes in band 9 and the inverse being true for band 4. There were small differences in band 5 with a greater proportion of learners with ASN achieving outcomes in that band than those without ASN.
Whilst there were notable differences in the proportion of learners achieving outcomes in each of the bands across the organisers, the number of learners in these categories is very low so any inferences regarding ability should be made with caution as this does not represent a significant difference in terms of raw numbers.
Chart 25c: MCNG Reading outcomes distributed by ASN for P7 with the exception of Tools for Reading
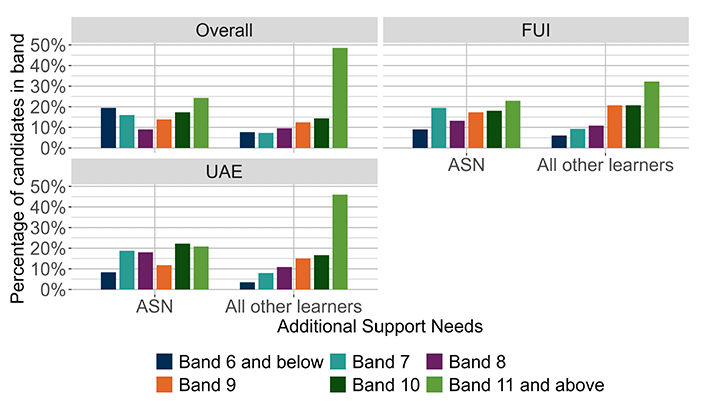
Chart 25d: MCNG Reading outcomes distributed by ASN for P7 for Tools for Reading
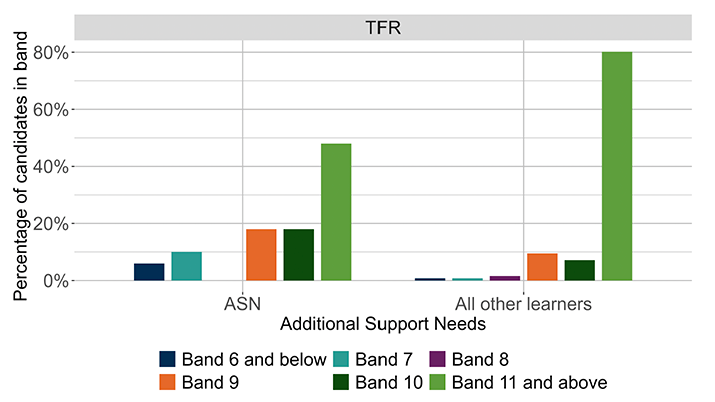
The Tools for Reading organiser has been separated from the overall outcomes and other organisers to allow easier review of the overall outcomes. Please note that these two charts use different scales.
Overall, there were notable differences between the proportion of learners that have ASN and all other learners achieving outcomes in bands 6 and 11 with a greater proportion of learners without ASN achieving outcomes in band 11 and the inverse being true for band 6. There were small differences in band 7 and no difference for all other bands.
Whilst there were notable differences in the proportion of learners achieving outcomes in each of the bands across the organisers, the number of learners in these categories is very low so any inferences regarding ability should be made with caution as this does not represent a significant difference in terms of raw numbers. 3.4.7 Looked After Children
In line with ONS guidelines the data for all stages is not reported in order to avoid identifying individual learners.
3.4.8 English as an Additional Language
In line with ONS guidelines the data for all stages is not reported in order to avoid identifying individual learners.
Contact
There is a problem
Thanks for your feedback