National Trauma Transformation Programme: workforce survey 2024
This report presents the main findings from a survey carried out with the workforce in Scotland exploring awareness and attitudes to psychological trauma and trauma-informed practice. The survey was carried out by the Improvement Service as part of the National Trauma Transformation Programme.
2. Aims and Methods
Aims of the Research
The aim of this research was to measure self-assessed levels of confidence, knowledge, skills and understanding of psychological trauma and trauma informed practice across different sectors of the workforce. In addition, the research aimed to capture uptake of National Trauma Transformation Programme resources, and a measure of the extent to which individuals felt that the key drivers of trauma-informed practice were embedded within their organisation.
The survey also explored changes from a previous survey undertaken in 2021 to assess progress in roll out and awareness of these resources, as well as understanding and confidence of psychological trauma and its impact.
Methods
An online survey was conducted between the 4th and 29th of March 2024. The survey included similar questions to those used in a previous survey conducted in 2021, with some amendments to reflect changes in the available training resources and streamline the responding and analysis process. Changes were kept to a minimum to ensure comparability over time. In total, 13 questions were included in the survey. These questions were developed by the Improvement Service in consultation with NTTP delivery partners. The full list of survey questions is available in Annex A.
The sampling frame for the survey was all employees within Scotland across the public and third sectors, and a small number of responses were also received from those working within the private social care sector. To reach as wide a sample of employees within these sectors as possible, the survey was distributed through a range of networks using several means including email, Teams, X/Twitter, newsletters, and the Improvement Service website. In all local authority areas trauma-leads were asked to distribute the survey directly to their colleagues using their own channels. The variability in responses by council area reflects this.
Weighting Responses
As is outlined in the section below, responses to the survey were not entirely representative of the Scottish workforce, with a particularly high proportions of responses from those working in some council areas, as well as certain service areas and job roles. This is not unexpected, given the networks the survey was distributed to and the likelihood of greater engagement from those familiar with trauma-informed practice or the NTTP. Oversampling from certain groups can introduce bias into results, meaning that results are less likely to accurately reflect views across the whole sampling frame, that is the whole workforce.
In this report, it was decided not to weight responses to correct this potential bias. This is due to no apparent tendency towards a greater familiarity, or lack thereof, with NTTP or trauma related concepts amongst the overrepresented groups. We are also constrained in our ability to correct any errors by the available data on the workforce. Some overrepresentation from certain sectors is expected and may be desirable in any case, particularly from those who would be likely to engage with more advanced concepts and training resources. Throughout the report, we have provided breakdowns of responses by different groups, which offer an insight into the overall picture and how these are made up. Those reading the report should, however, take care in drawing conclusions about the workforce as a whole when considering understanding of concepts related to trauma and uptake of the resources, and particularly in comparing with 2021 results.
Respondent Characteristics
A total of 5,075 responses were received, up from 3,590 responses in 2021. This provided a robust basis for assessing levels of awareness of trauma and trauma-informed practice within the workforce.
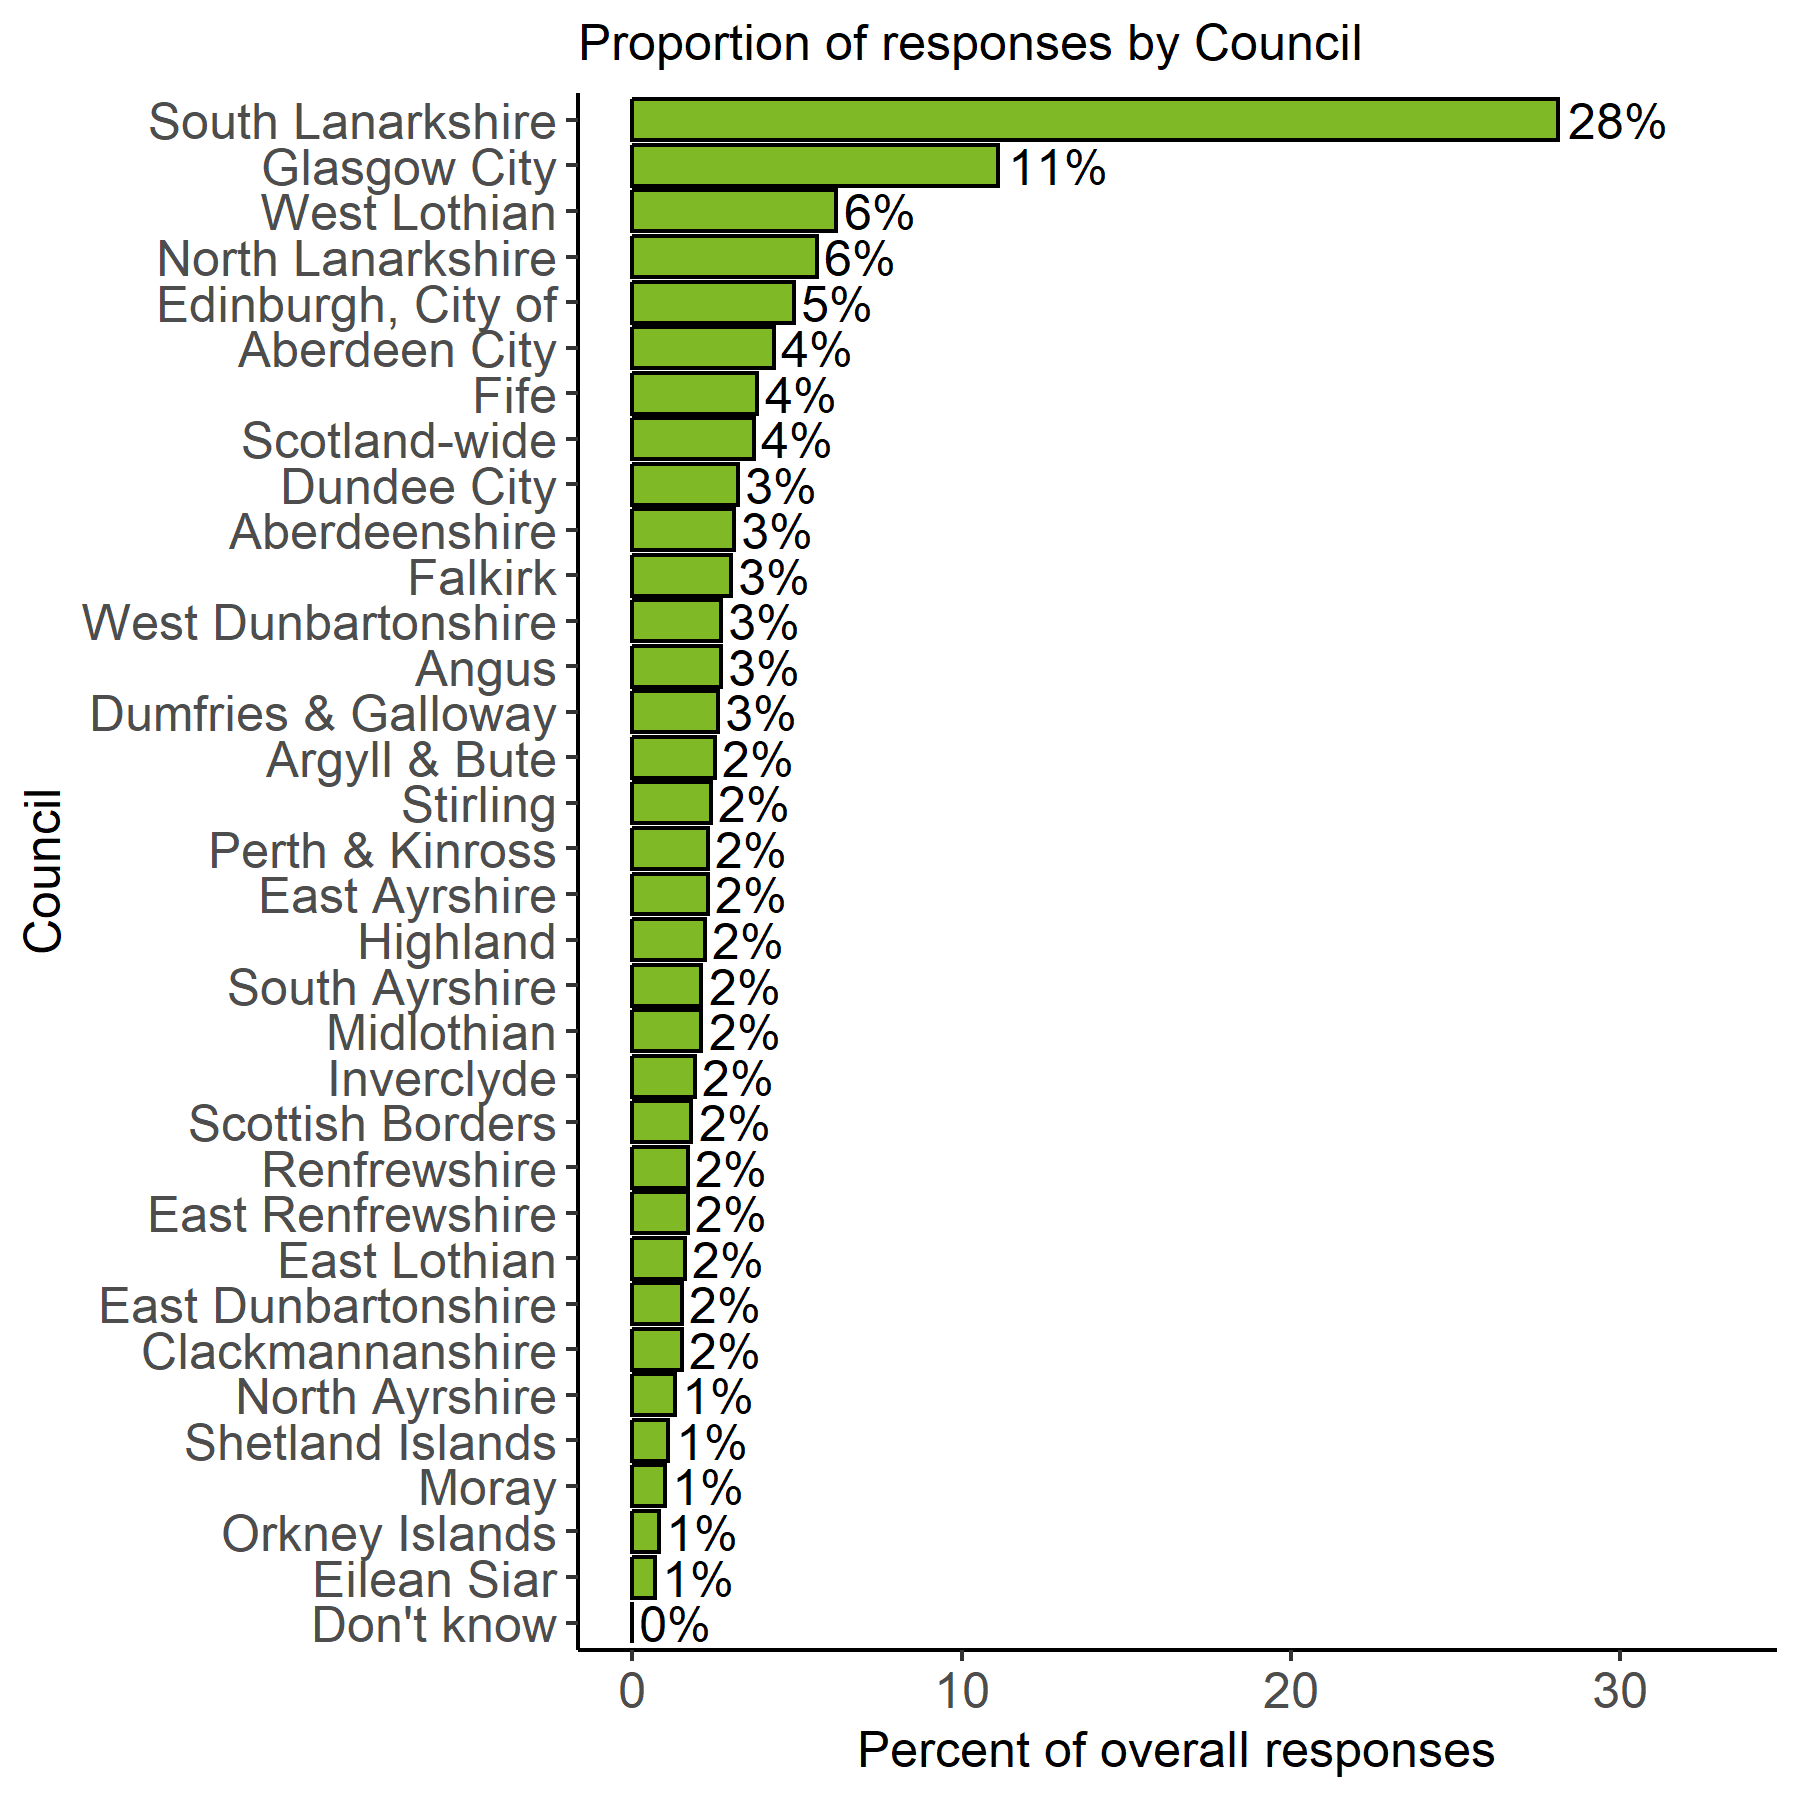
Respondents were initially asked a series of questions about their area of employment including the local authority areas that they worked in, the sector and service areas that they worked within, and their job role. All 32 local authority areas were represented in the responses. It should be noted that responses from those working in South Lanarkshire accounted for 28 percent of all responses, meaning that area is significantly overrepresented. The full breakdown for 2024 by local authority is shown in Figure 1.
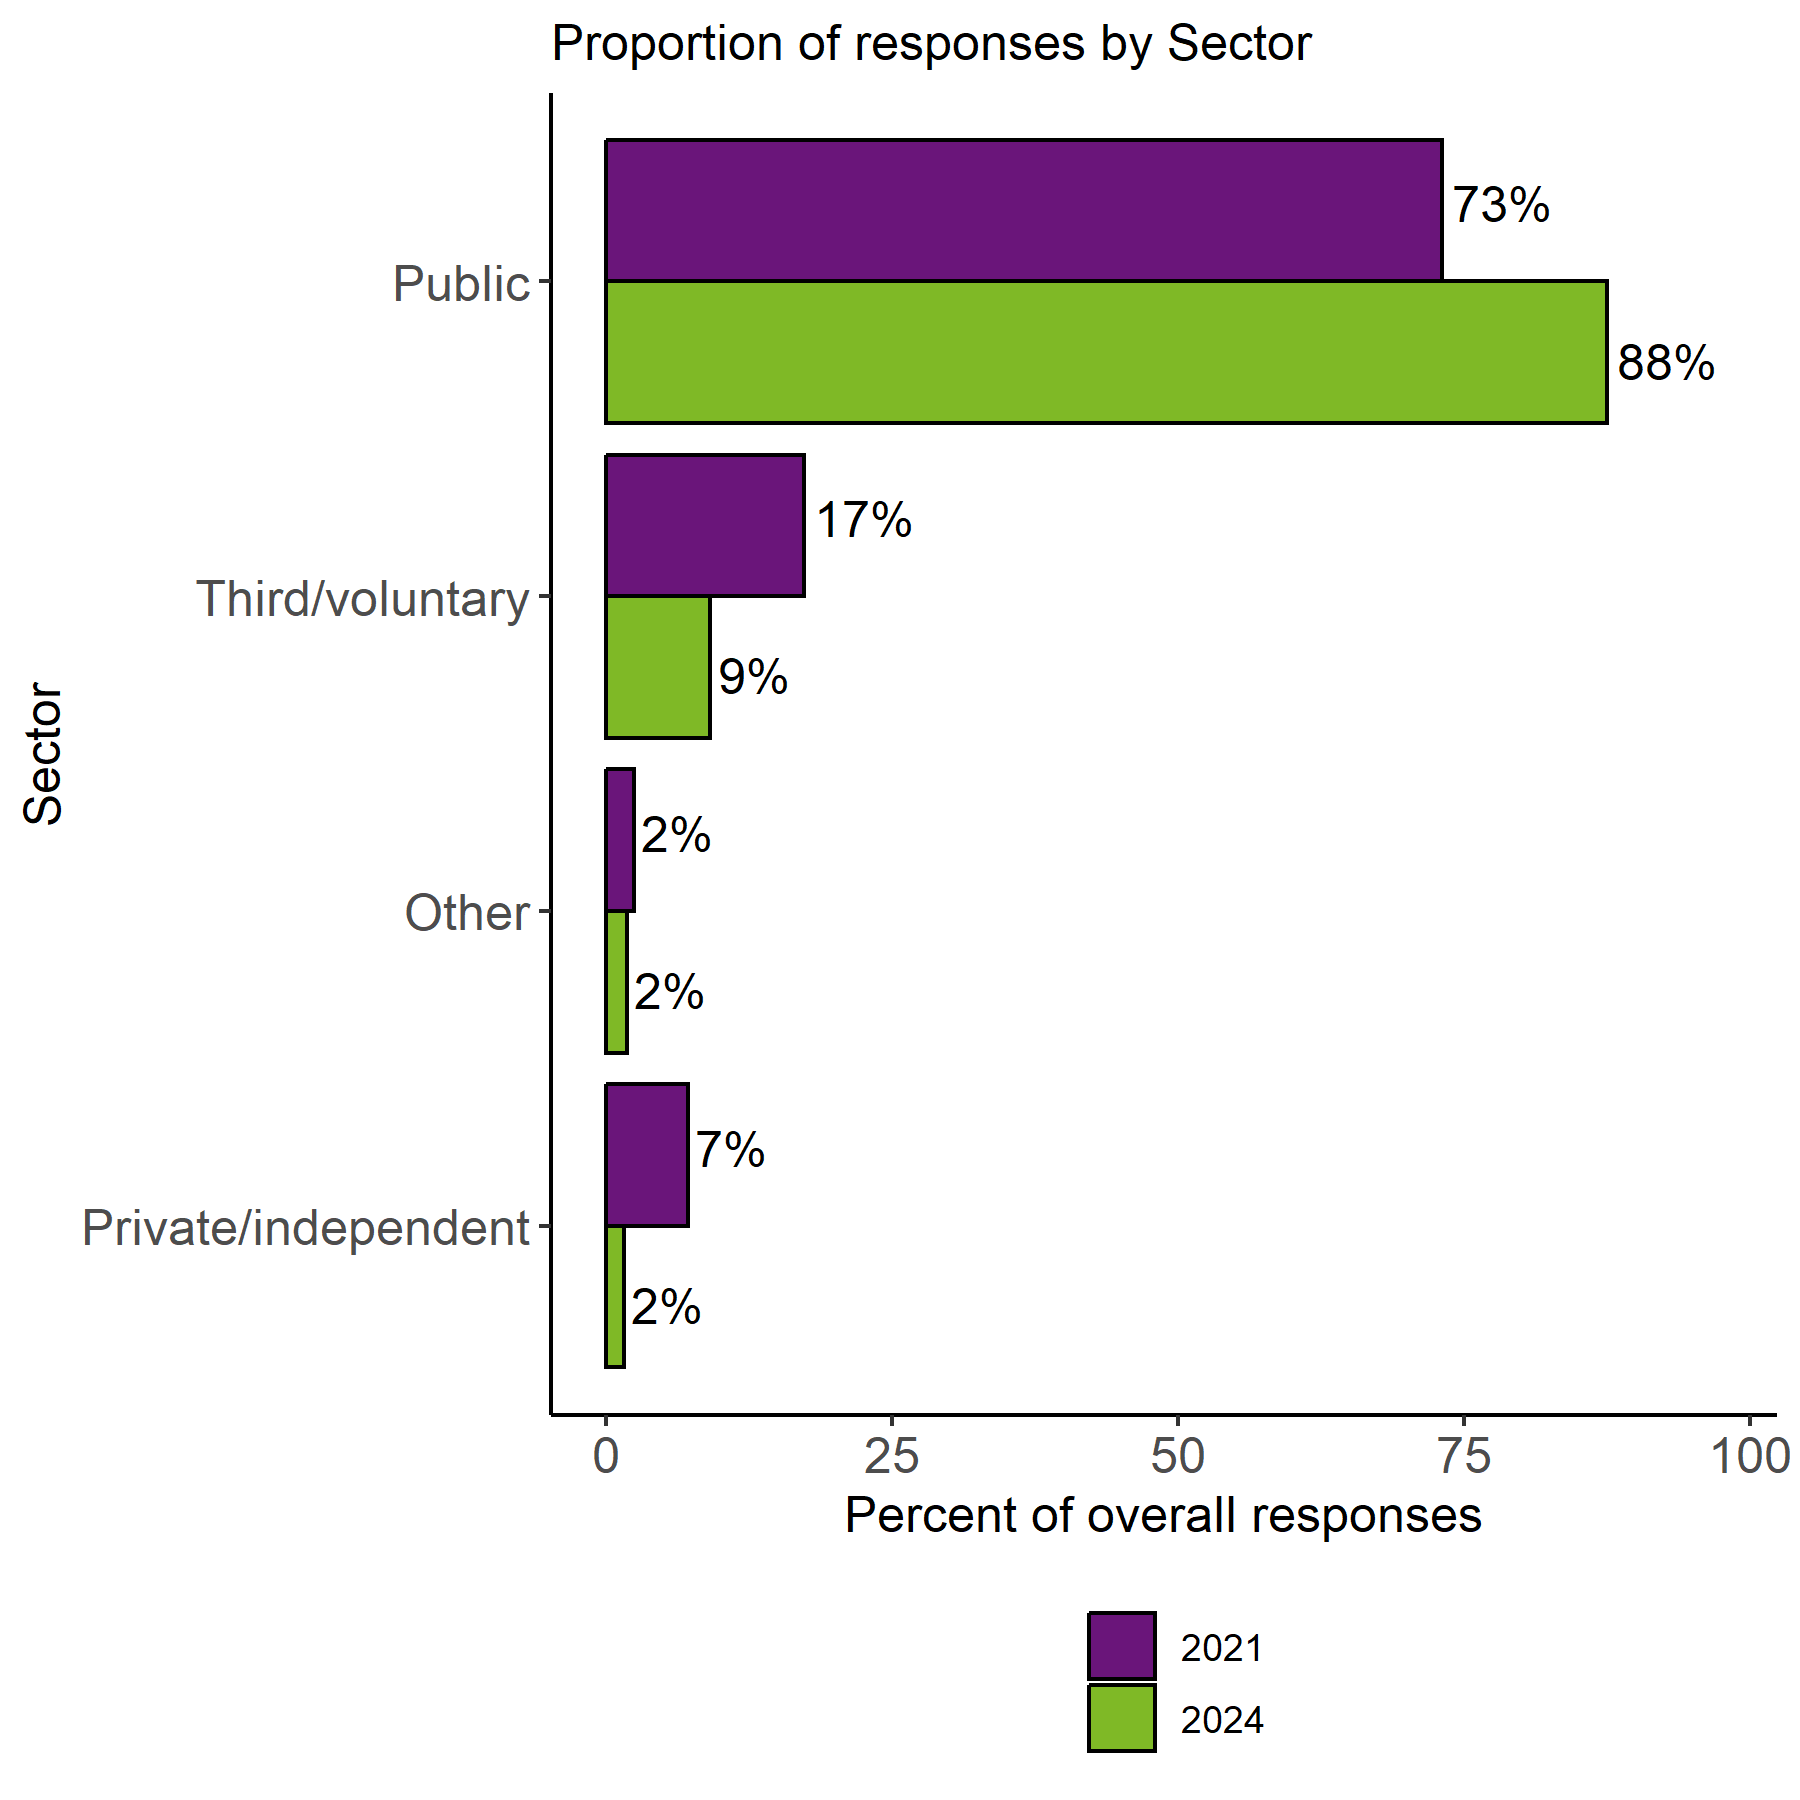
The vast majority of responses were received from the public sector at 87.5 percent. This compared with 73.1 percent of responses in 2021. Just under 9.1 percent of responses were received from individuals working in the third sector, while 1.5 percent were received from the private sector. These were lower proportions than responses to the 2021 survey, which included 17 percent from the third sector and 7 percent from the private sector. This change in respondent type is shown in Figure 2. This is likely to impact overall results and should be considered when examining change over time. Where possible, results in this report are broken down by sector to allow a more meaningful comparison.
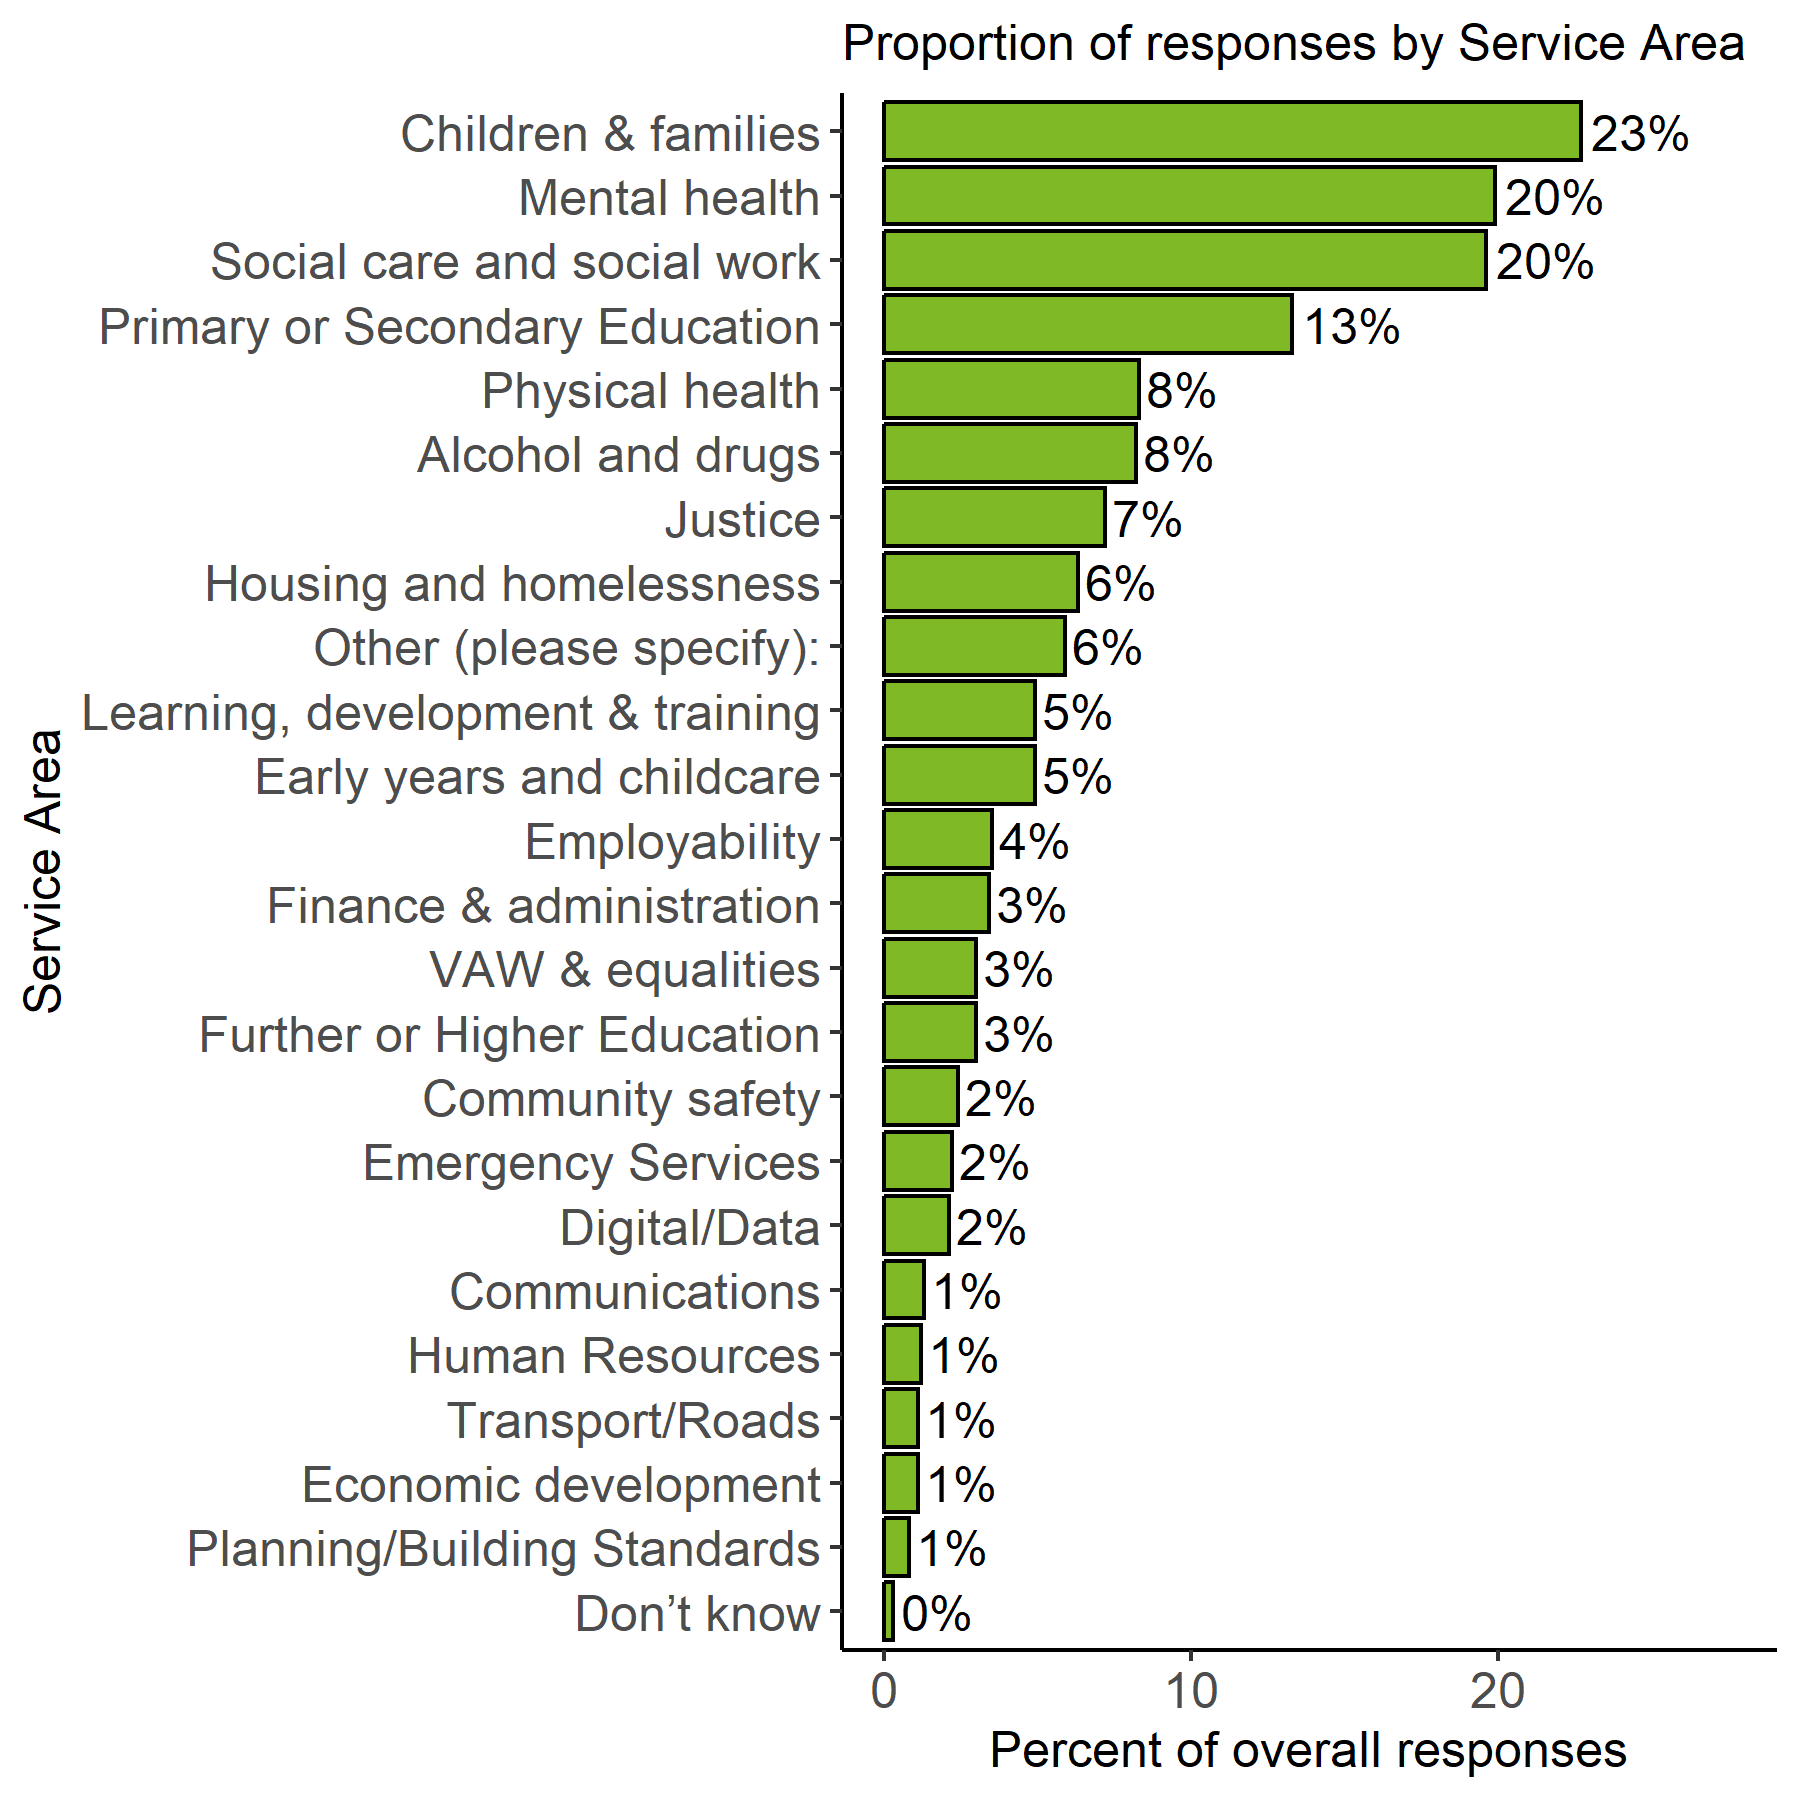
Respondents were also asked to select which service area or areas they currently work in. As shown in Figure 3, the largest proportion of respondents in 2024 worked in the children and families service area (23%). This was closely followed by respondents working in mental health (20%) and those working in social care and social work (20%). Just under 6 percent of responds selected the “other” category. These services included areas such as welfare rights, environmental health, and culture and leisure, as well as other services that did not fall into the list provided. There was little change in the service area of respondents between 2021 and 2024.
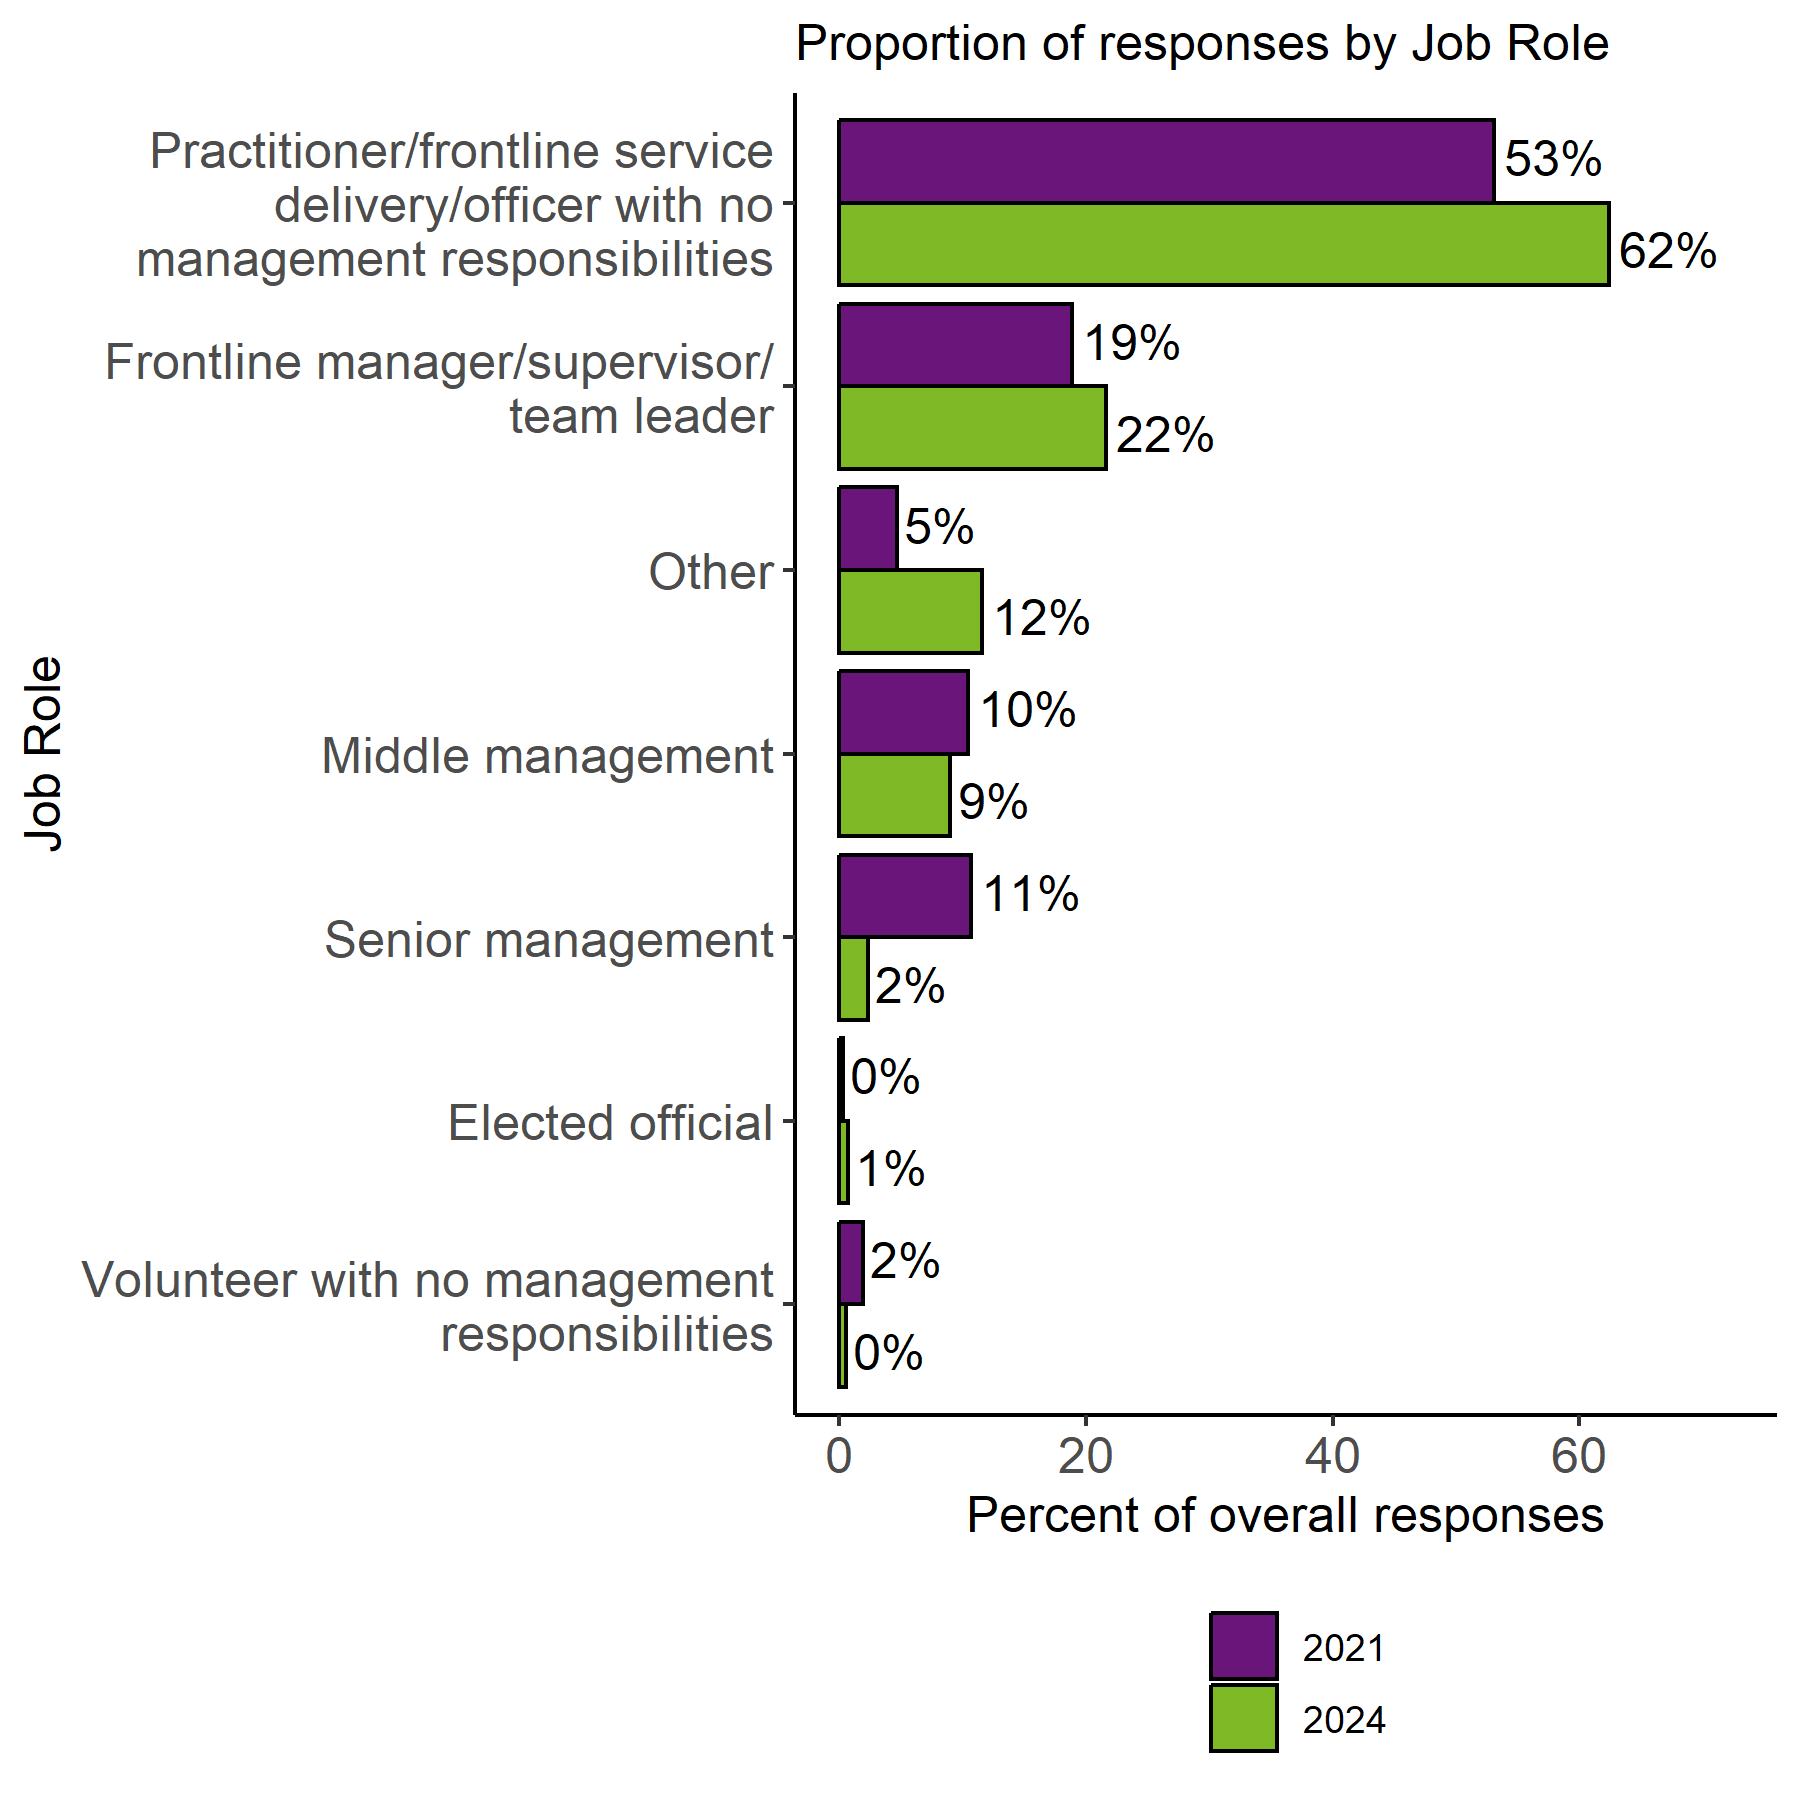
Lastly, respondents also provided their job role. As in 2021, the greatest proportion of respondents were practitioners or frontline service delivery with 62 percent. This was followed by 22 percent in frontline management roles, “other” roles, and middle management. Compared to 2021 there was a decline in the proportion of responses form senior management (2.3% compared to 10.7%) and volunteers with no management responsibilities. These figures are displayed in Figure 4.
Contact
Email: ACEstrauma@gov.scot
There is a problem
Thanks for your feedback