National Trauma Transformation Programme: workforce survey 2024
This report presents the main findings from a survey carried out with the workforce in Scotland exploring awareness and attitudes to psychological trauma and trauma-informed practice. The survey was carried out by the Improvement Service as part of the National Trauma Transformation Programme.
4. Trauma-informed drivers within organisations
Overall agreement
In addition to rating their own confidence and understanding, respondents were also asked to rate how they felt key drivers of trauma-informed practice were embedded within their own organisation or service’s culture. Respondents were asked to state to what extent they agreed with each of the eight statements outlined below.
Trauma-Informed Organisations and Services Statements
1. All staff have the knowledge, skills, confidence, and capacity to recognise and respond to people affected by trauma, through training and implementation support relevant to their job role and service remit.
2. Leaders at all levels understand, drive, and inspire working in a trauma-informed and responsive way.
3. Our organisation’s budget includes a long-term commitment to embedding a trauma-informed and responsive approach.
4. Our policies and processes reflect and understanding of the prevalence and impact of trauma.
5. Staff wellbeing is valued and prioritised.
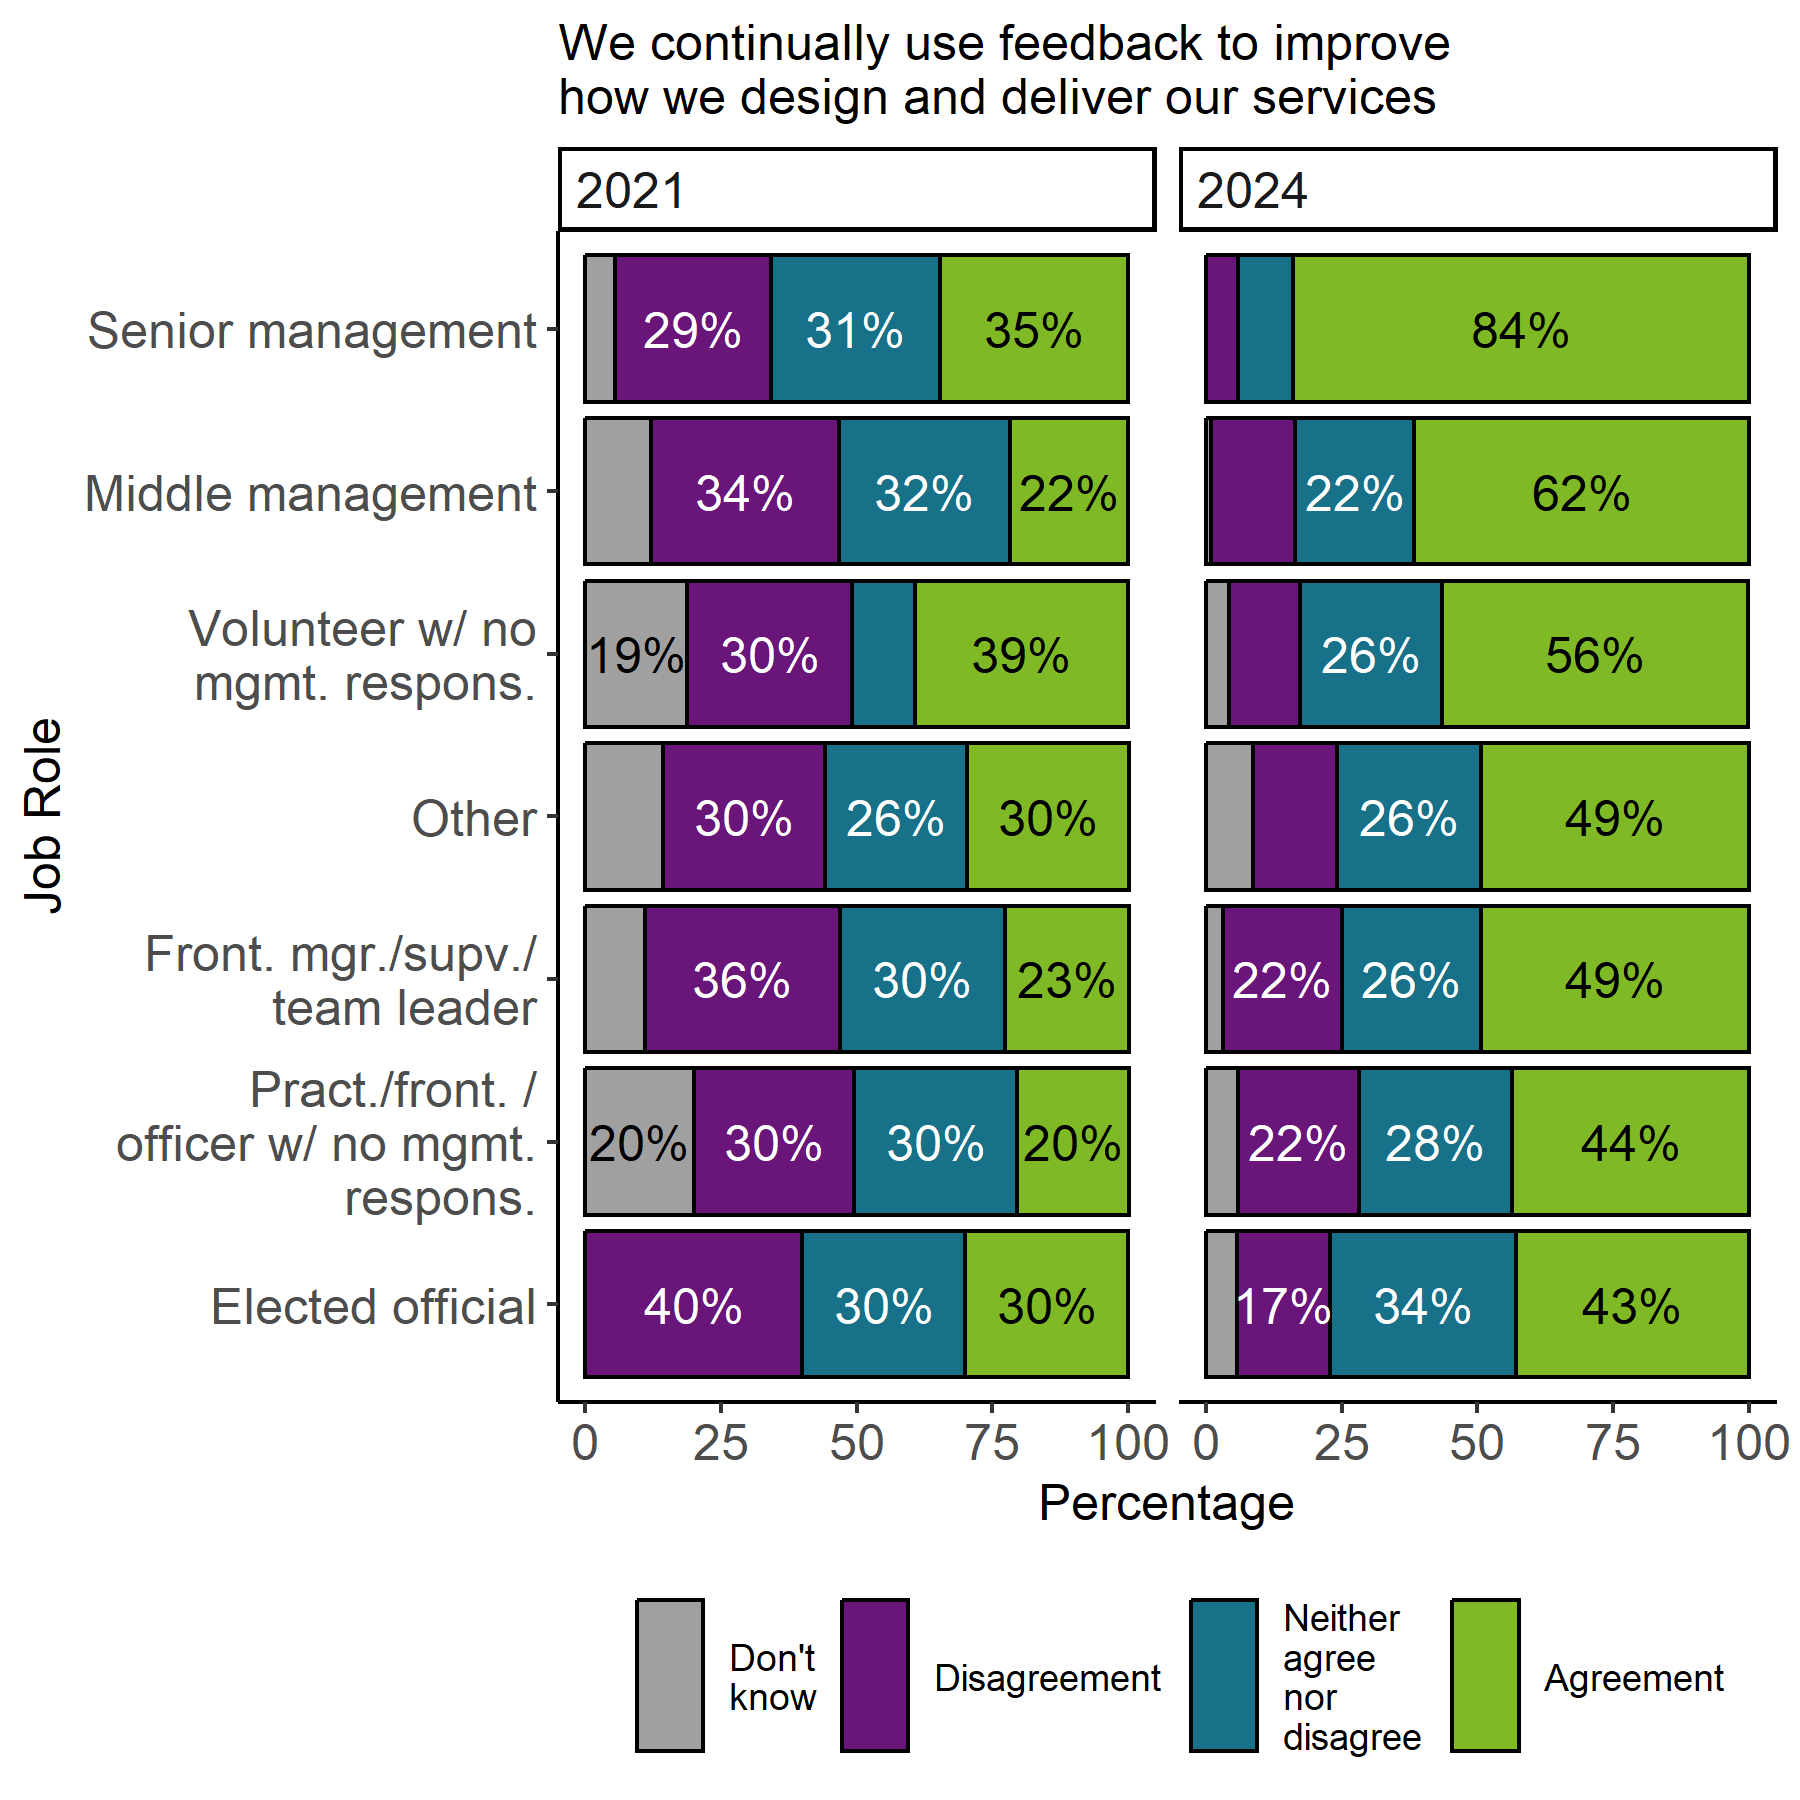
6. We continually use feedback to improve how we design and deliver our services.
7. We routinely create safe and meaningful opportunities to share power with people with lived experience of trauma.
8. Whatever our organisation’s remit, our services are designed and delivered to resist re-traumatisation, recognise people’s resilience, and support people’s recovery.
These statements were selected to reflect those included in “A Roadmap for Creating Trauma-Informed and Responsive Change”, which was launched in 2023. As such, not all of the statements included in this survey were also included in that issued in 2021.
Respondent comments: “Organisations (including public service) continually talk about the need for trauma-informed practice. The conversation has gone on long enough. Instead of continually talking about it, they need to just get on with it and 'be trauma informed'!”
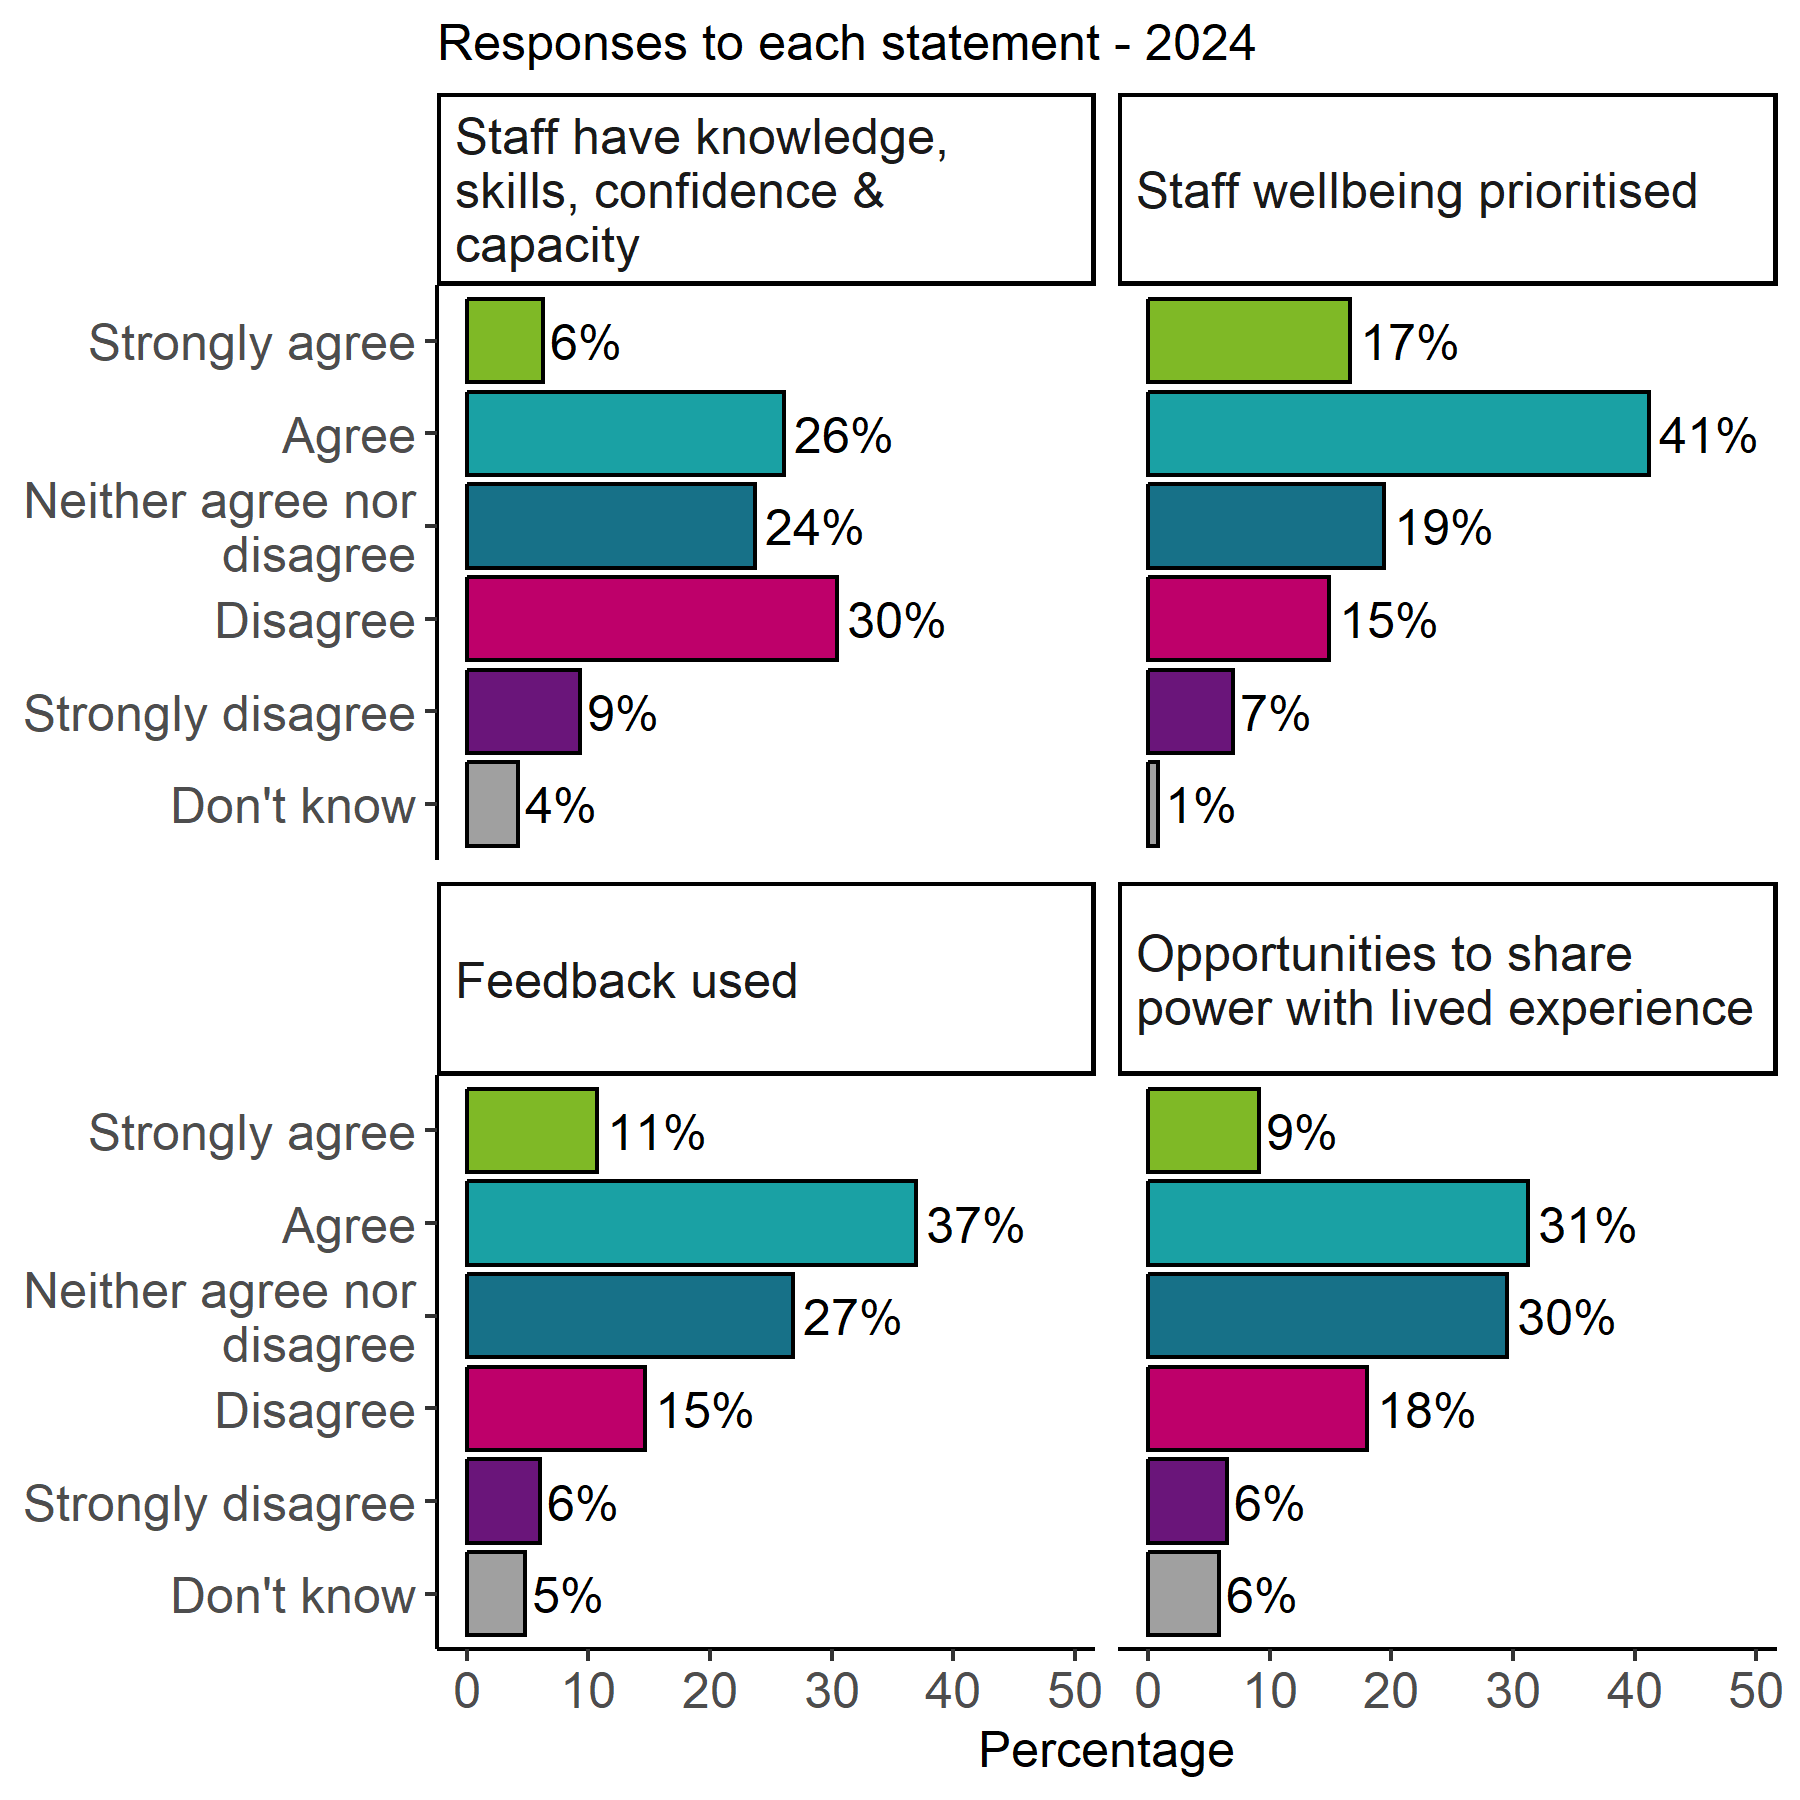
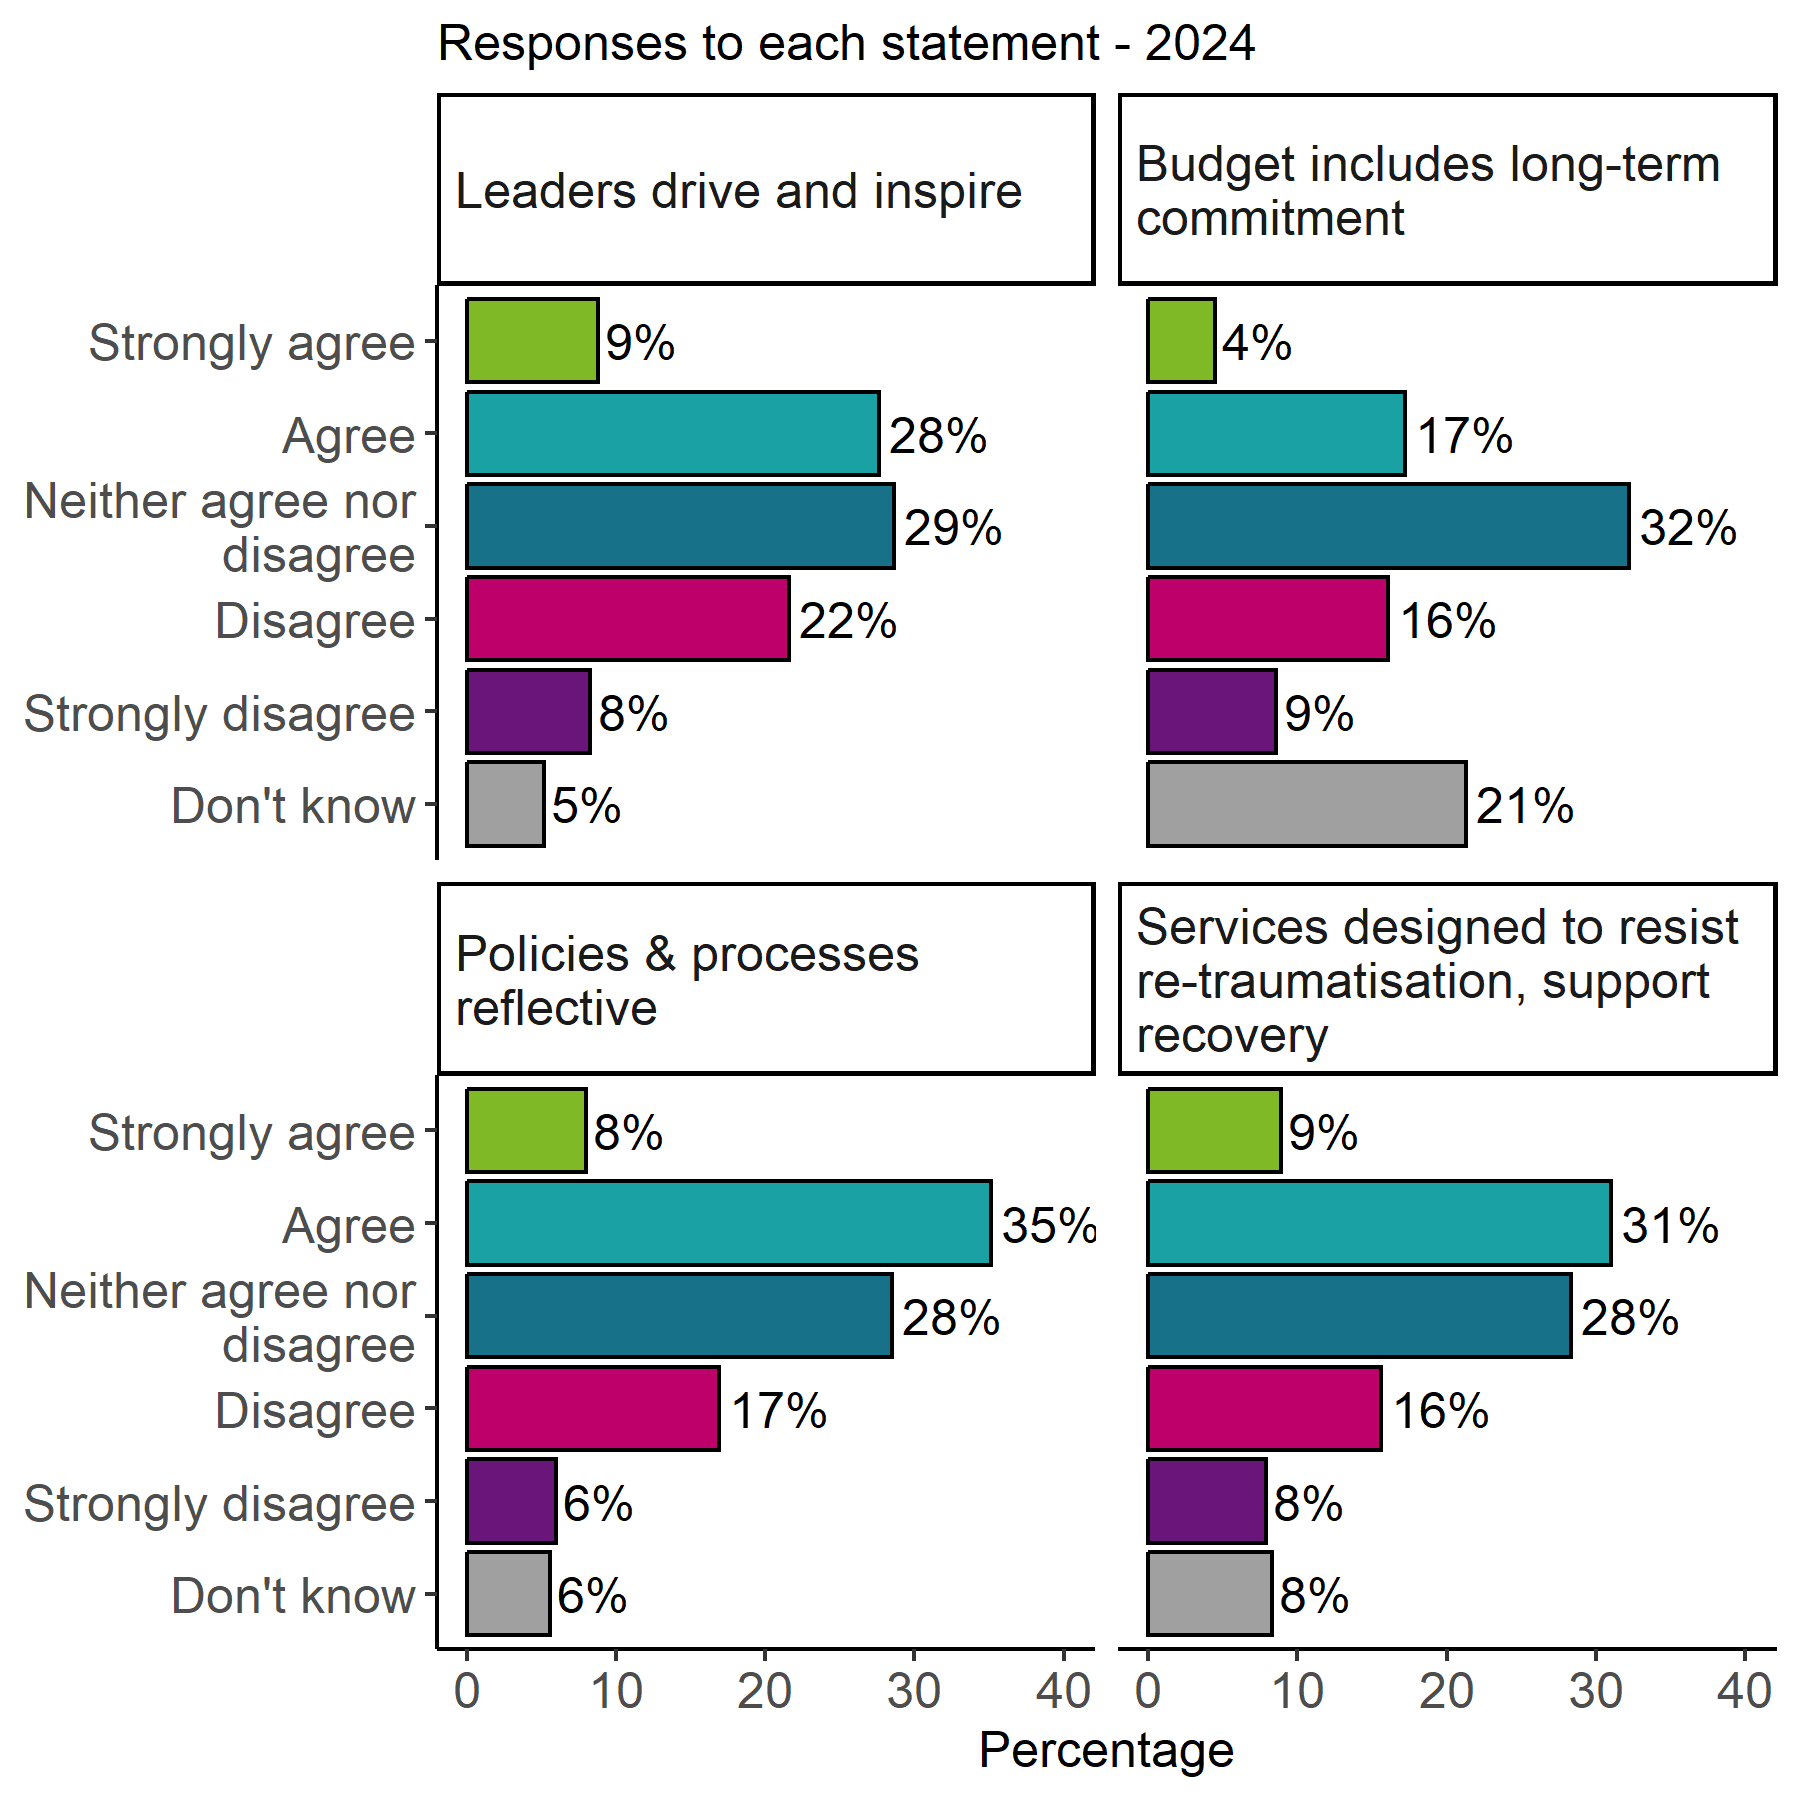
There were varying levels of agreement across the statements. Respondents had the highest ratings of agreement with the statement “Staff wellbeing is valued and prioritised”, with 58 percent stating they agreed or strongly agreed. In contrast, the statement “Our organisation’s budget includes a long-term commitment to embedding a trauma-informed and responsive approach” had much lower agreement with just 22 percent of respondents saying they agreed or strongly agreed compared with 25 percent who disagreed or strongly disagreed. This statement also had a large proportion who responded with “don’t know” suggesting this might be an area where a large proportion of the workforce are not aware of their organisation’s practices.
The statement with the highest level of disagreement was “All staff have the knowledge, skills, confidence and capacity to recognise and respond to people affected by trauma, through training and implementation support relevant to their job role and service remit”. Forty percent of respondents disagreed or strongly disagreed with this statement.
A full breakdown of responses per statement is shown in Figure 12 and Figure 13.
There were four statements comparable to those in the previous survey. Changes in responses to these statements since the previous survey are outlined below.
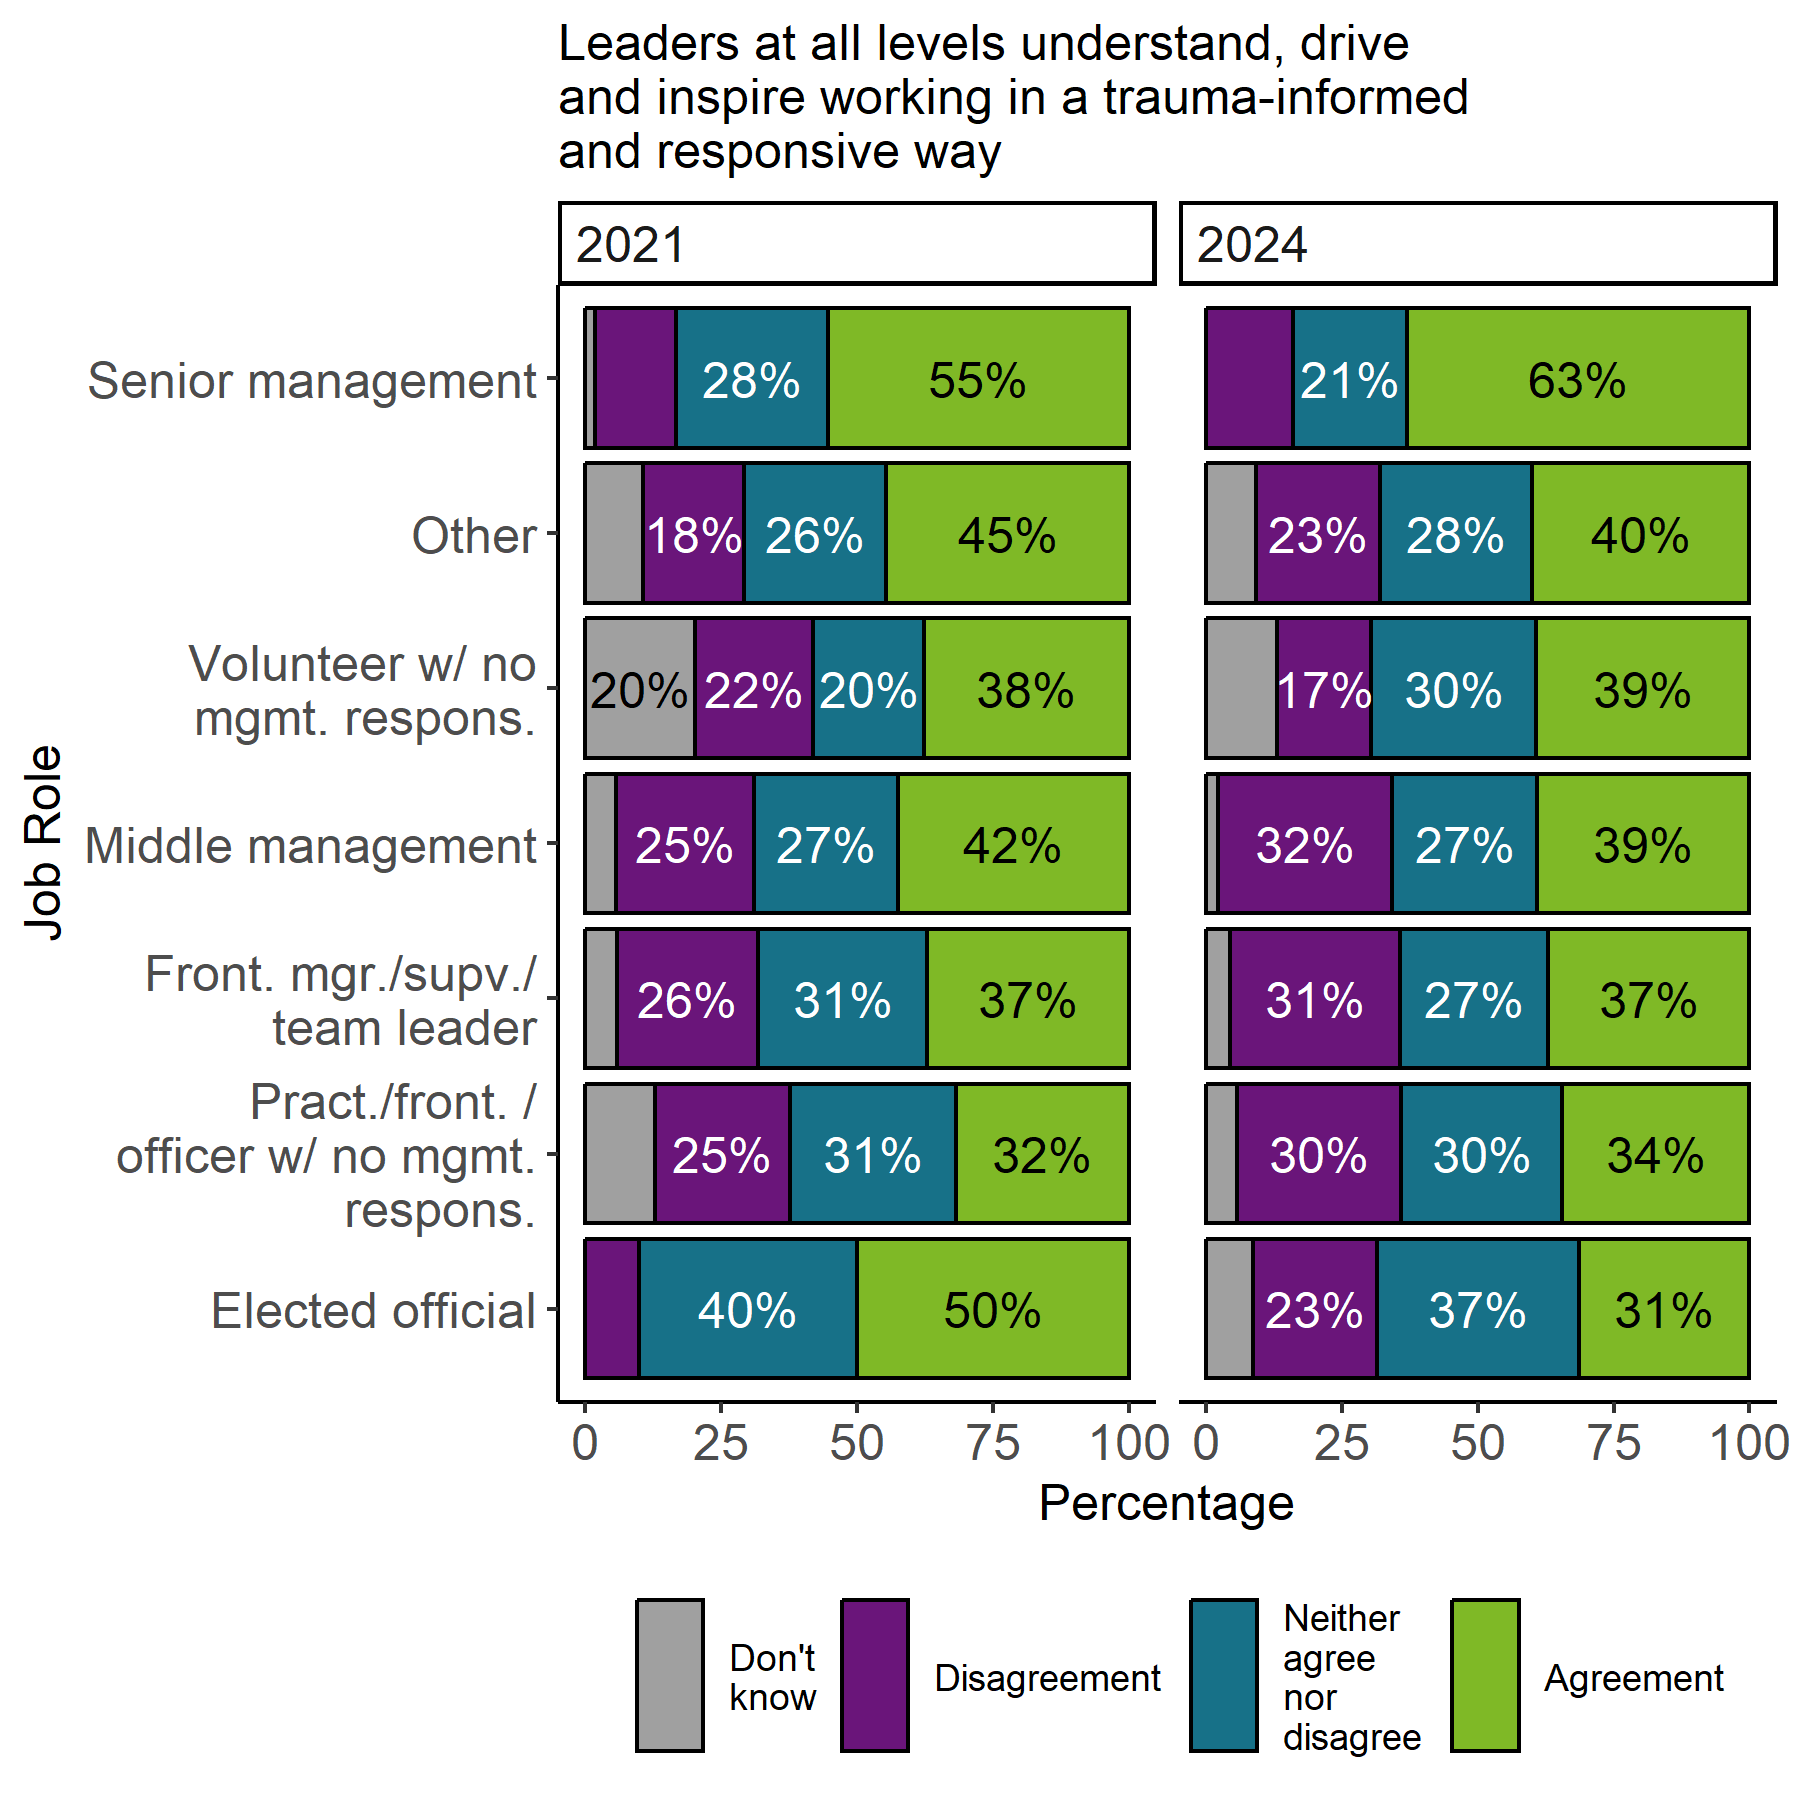
- There has been a slight reduction in the proportion of respondents who agreed that leaders at all levels understand, drive, and inspire working in a trauma-informed and responsive way. The proportion who agreed or strongly agreed reduced from 37 percent in 2021 to 36 percent in 2024, but this change was not statistically significant.
- Levels of agreement were also lower for the statement “Staff wellbeing is valued and prioritised”. Again, this was not a statistically significant change, reducing from 64 percent agreement in 2021 to 58 percent in 2024. Despite this reduction, this statement had the highest proportion of respondents who said they agreed across the eight statements in the current survey.
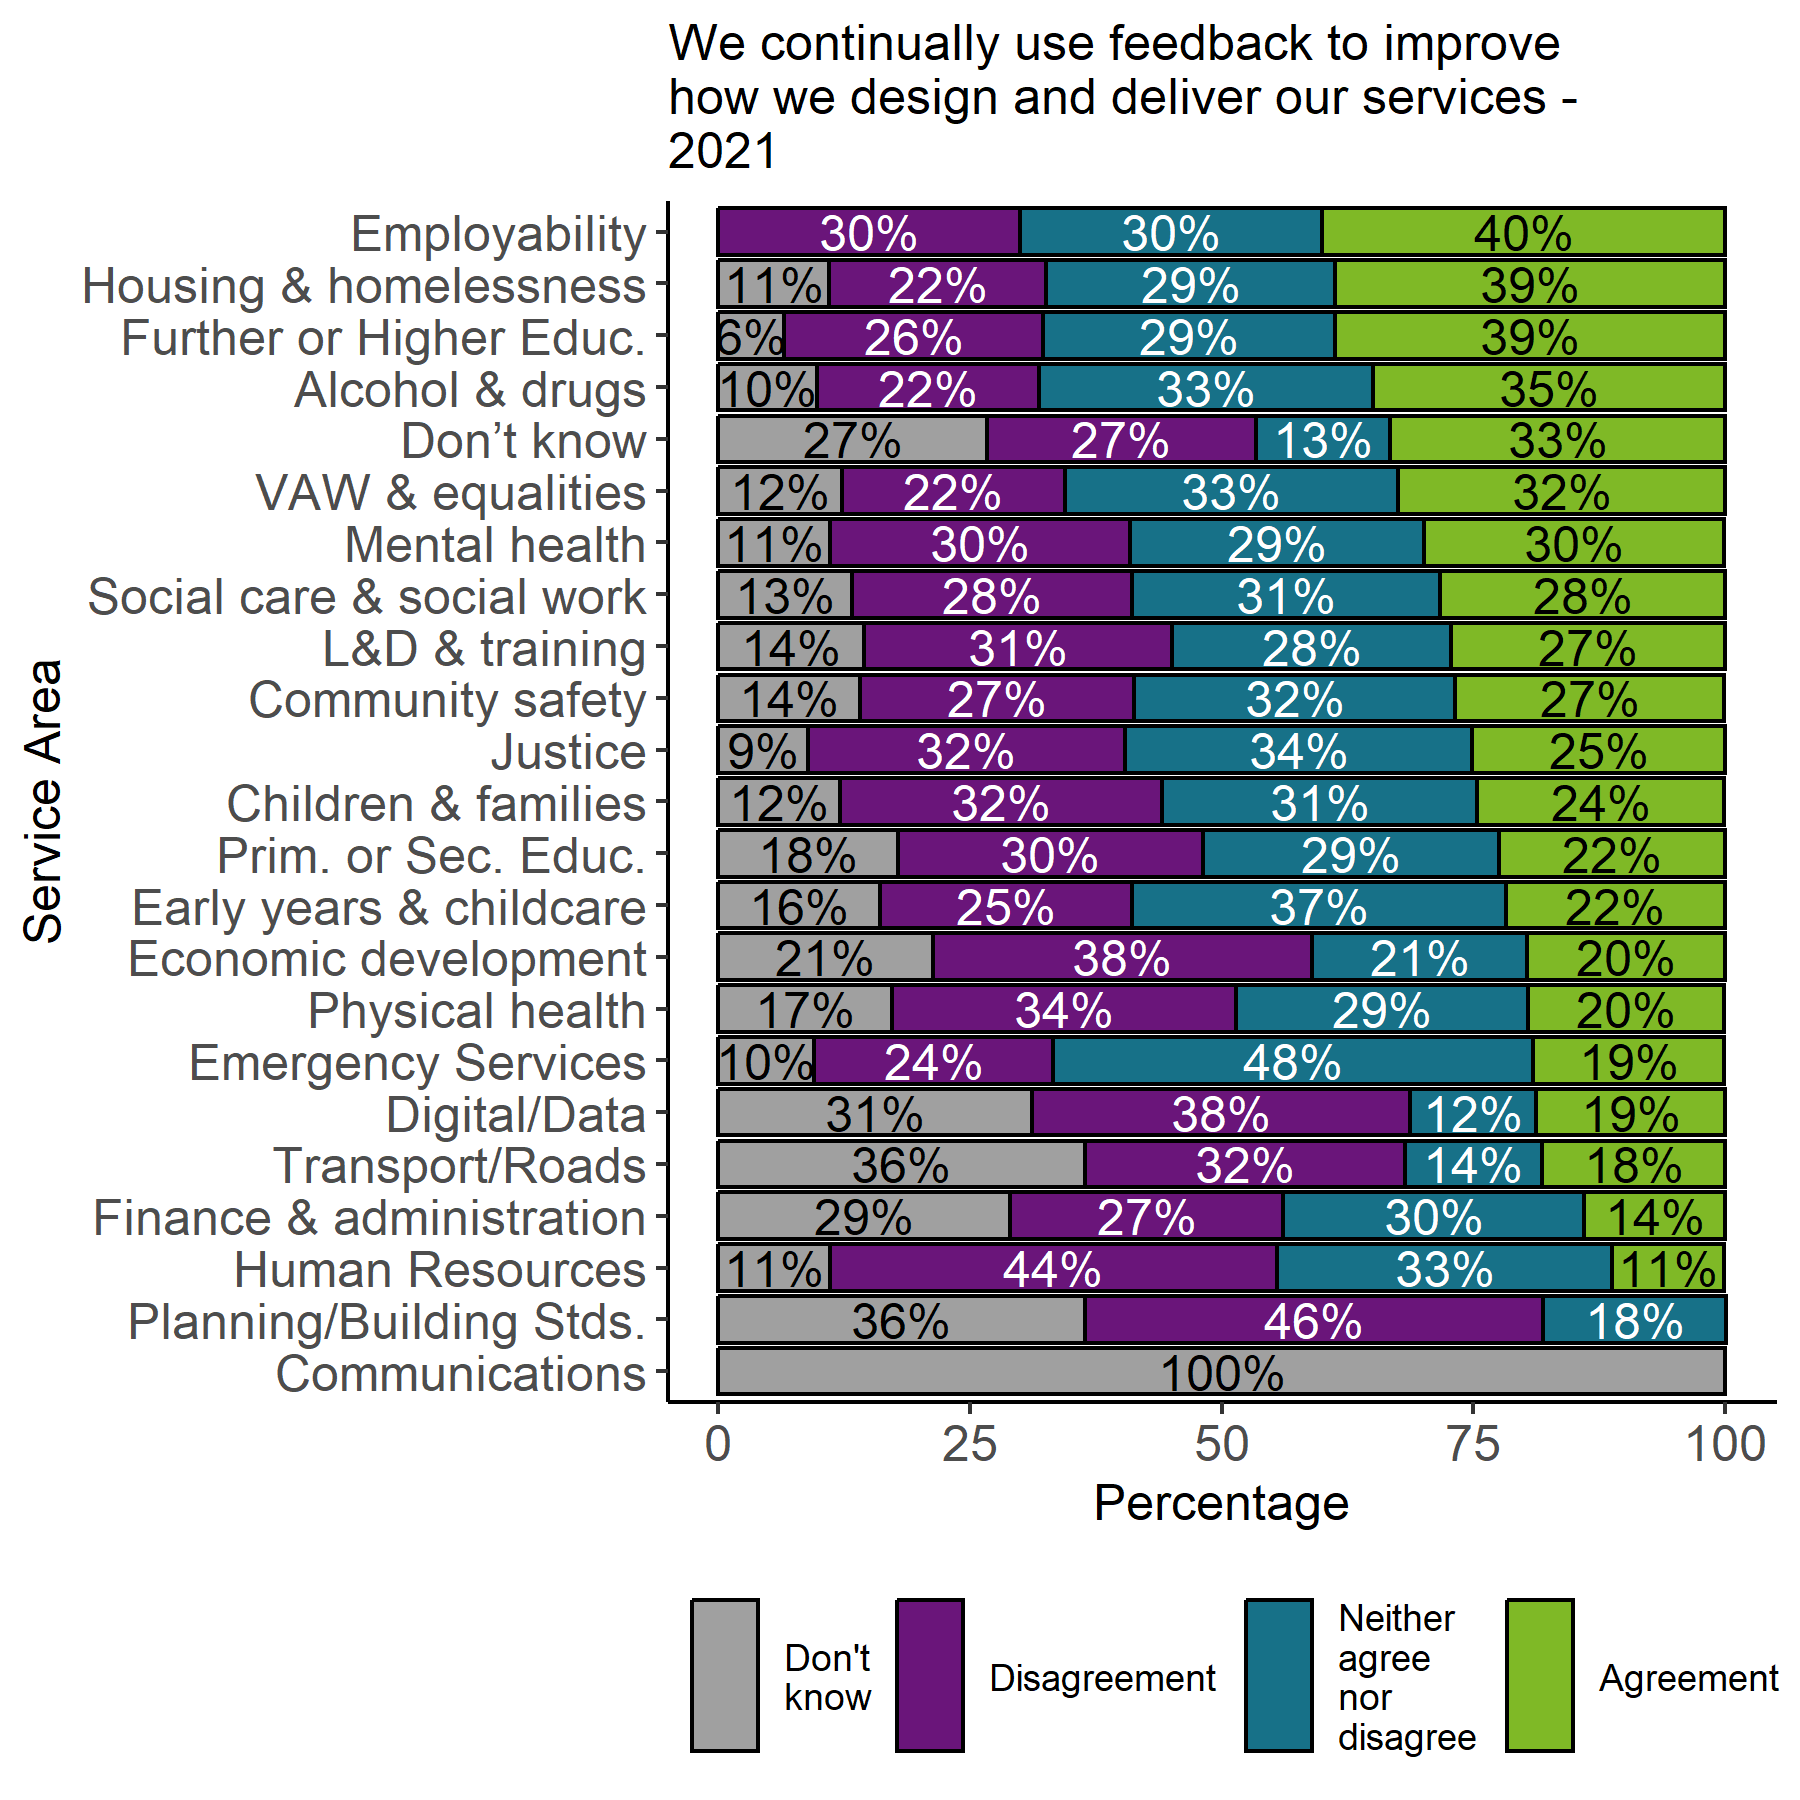
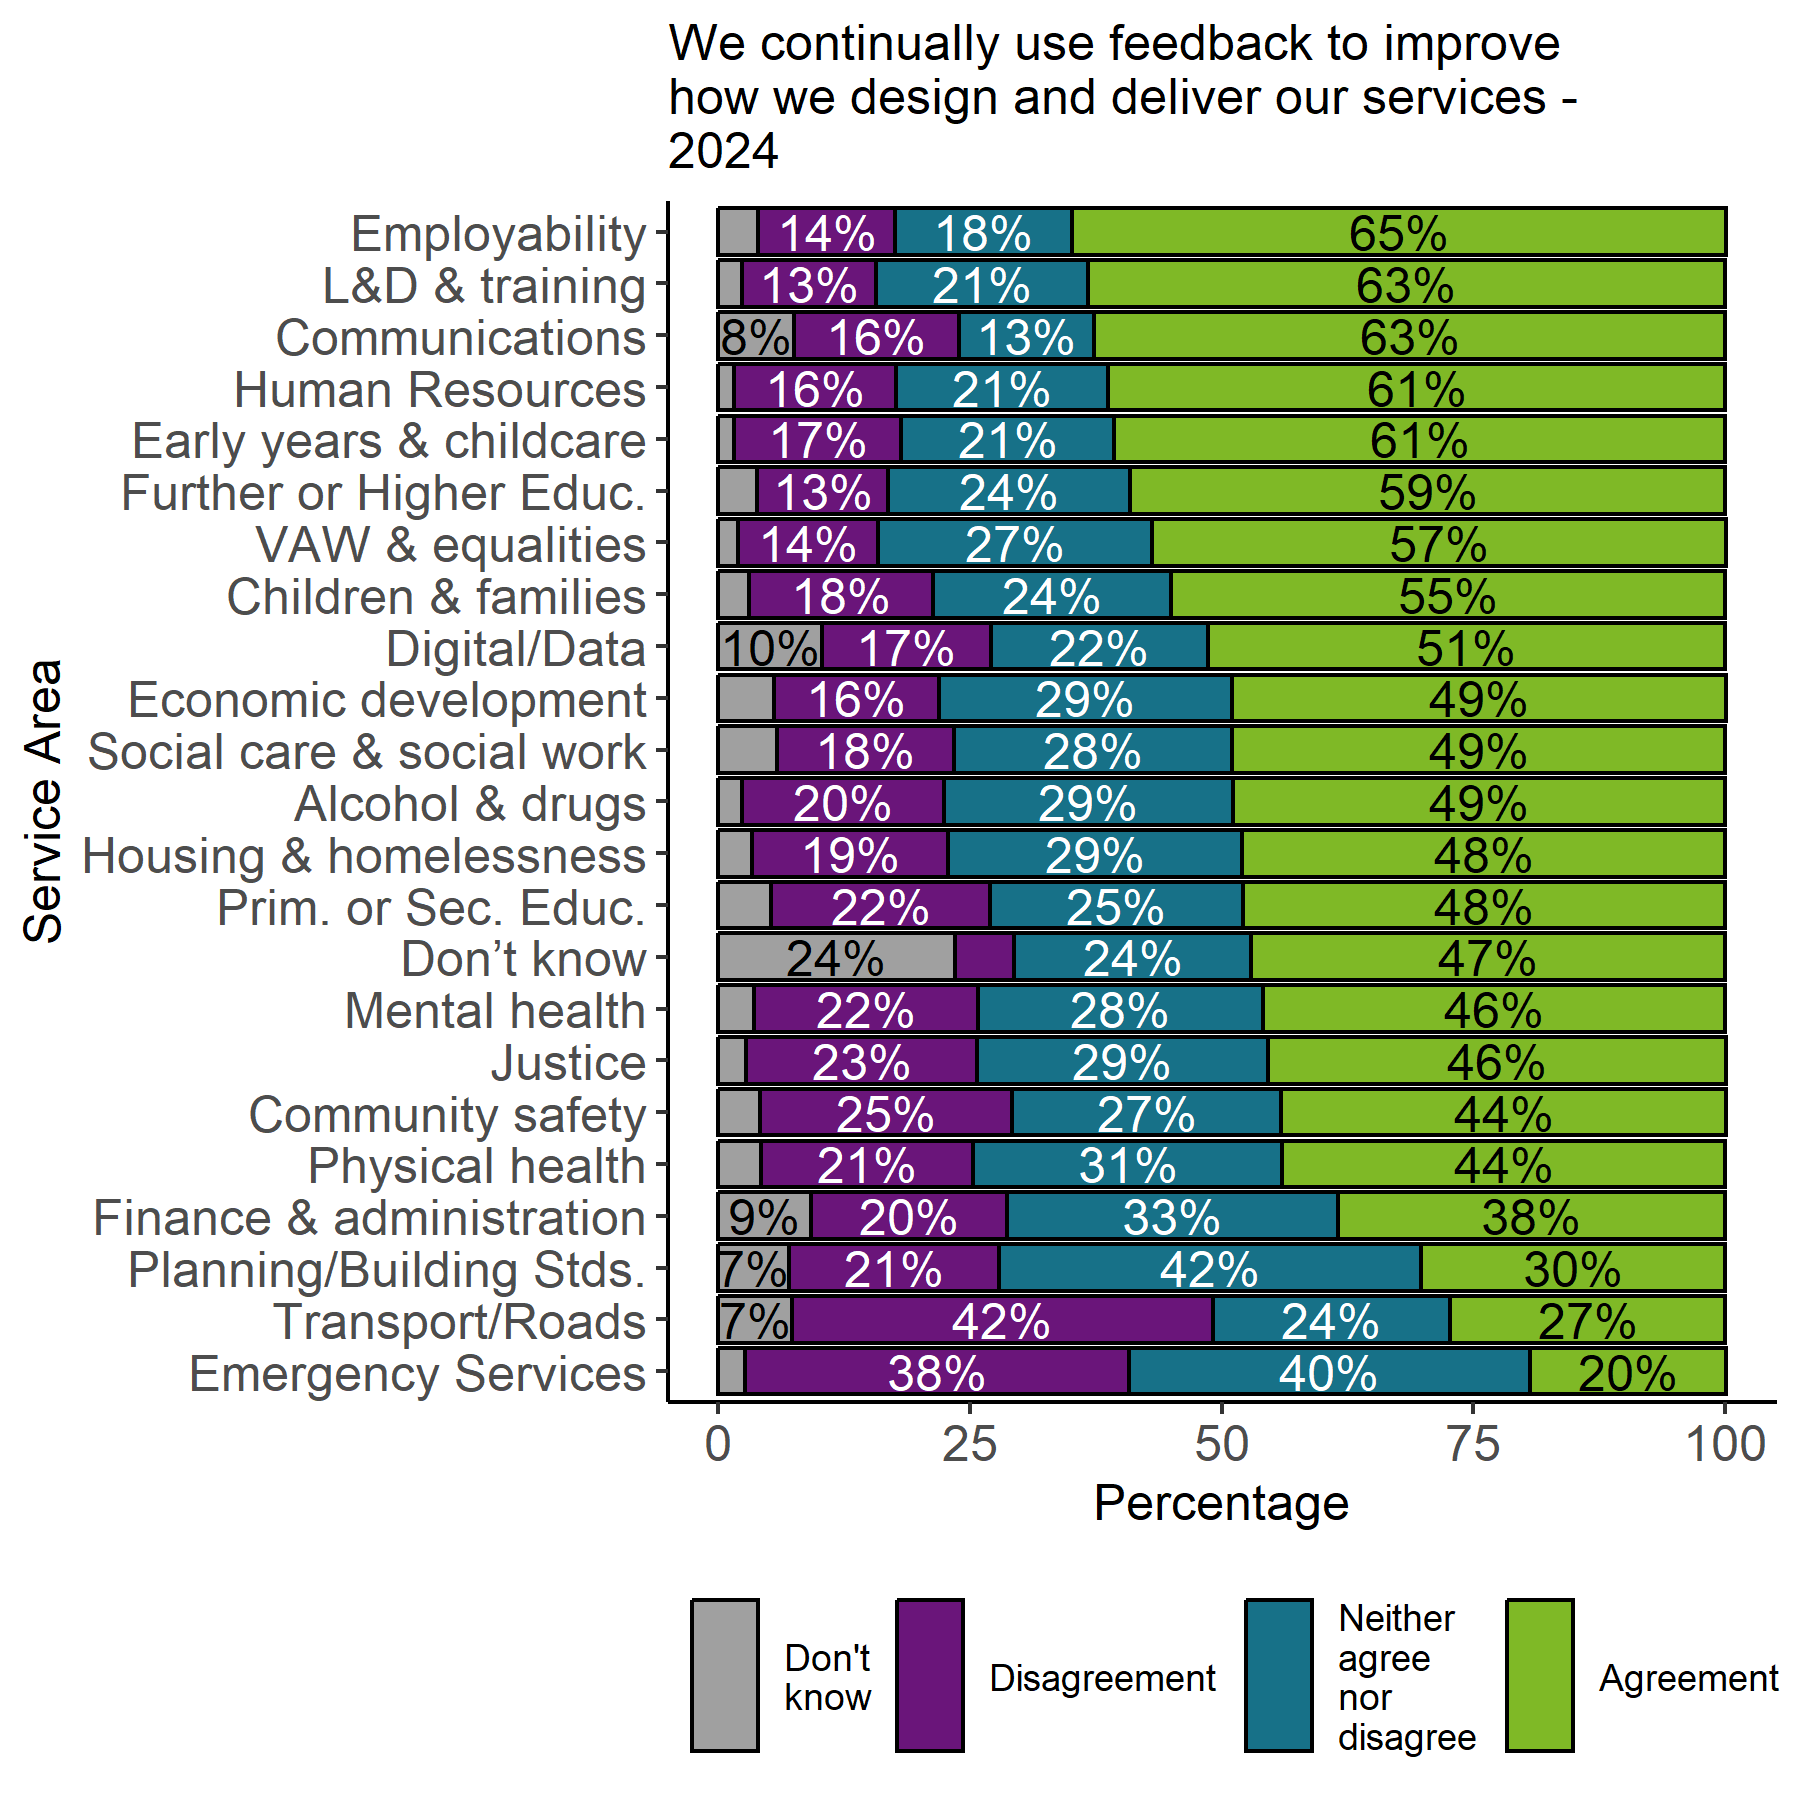
- There was a statistically significant increase in the proportion of respondents who agreed or strongly agreed with the statement “We continually use feedback to improve how we design and deliver our services”. This increased from 23 percent in 2021 to 48 percent in 2024.
- Respondents were also more likely to agree with the statement, “We routinely create safe and meaningful opportunities to share power with people with lived experience of trauma” in the current survey. The proportion who agreed or strongly agreed increased from 28 percent in 2021 to 40 percent in 2024, a statistically significant change.
Figure 14 shows changes over time in responses to the four comparable statements.
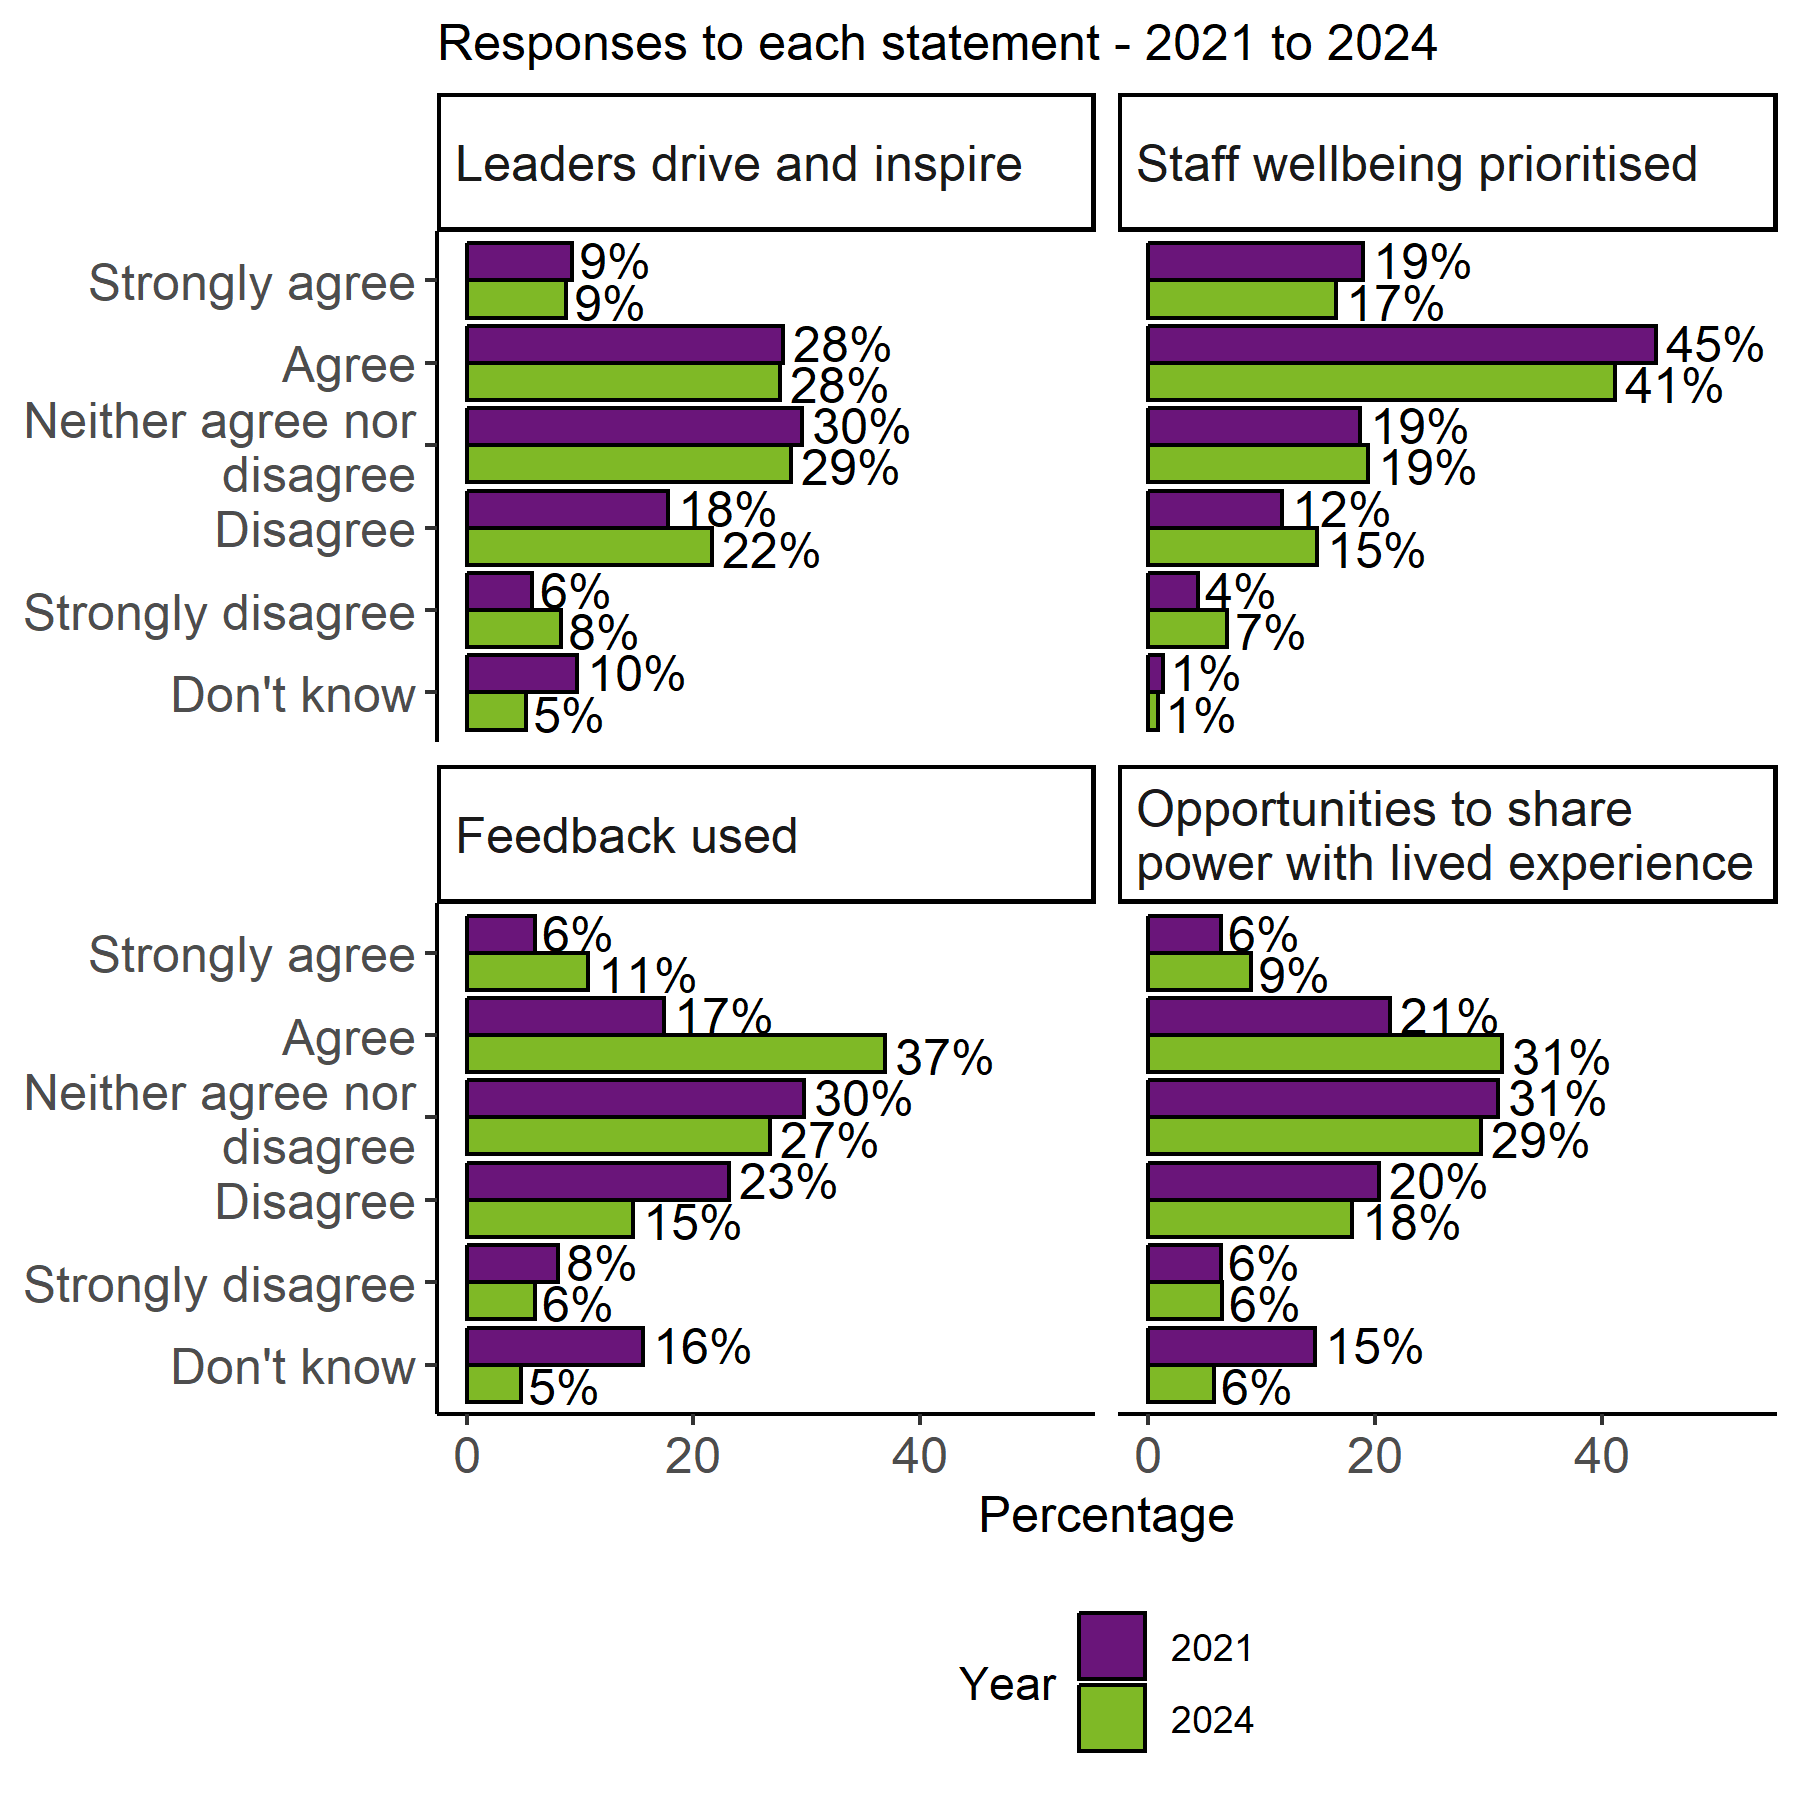
These figures may suggest that there have been improvements in external facing organisational practices linked with service users and clients, whilst internal practices related to leadership and staff wellbeing have shown little change.
While the decrease in the proportion of respondents who said they agreed with the statements “Leaders at all levels understand, drive, and inspire working in a trauma-informed and responsive way” and “Staff wellbeing is valued and prioritised” were not statistically significant, there was a statistically significant increase in the number of respondents who disagreed with these. The proportion of respondents who disagreed or strongly disagreed with the statement “Leaders at all levels understand, drive and inspire working in a trauma-informed and responsive way” increased from 24 percent in 2021 to 30 percent in 2024. For the statement, “Staff wellbeing is valued and prioritised” rates of disagreement increased from 16 percent in 2021 to 22 percent in 2024.
Responses by sector, service area and job role
Sector
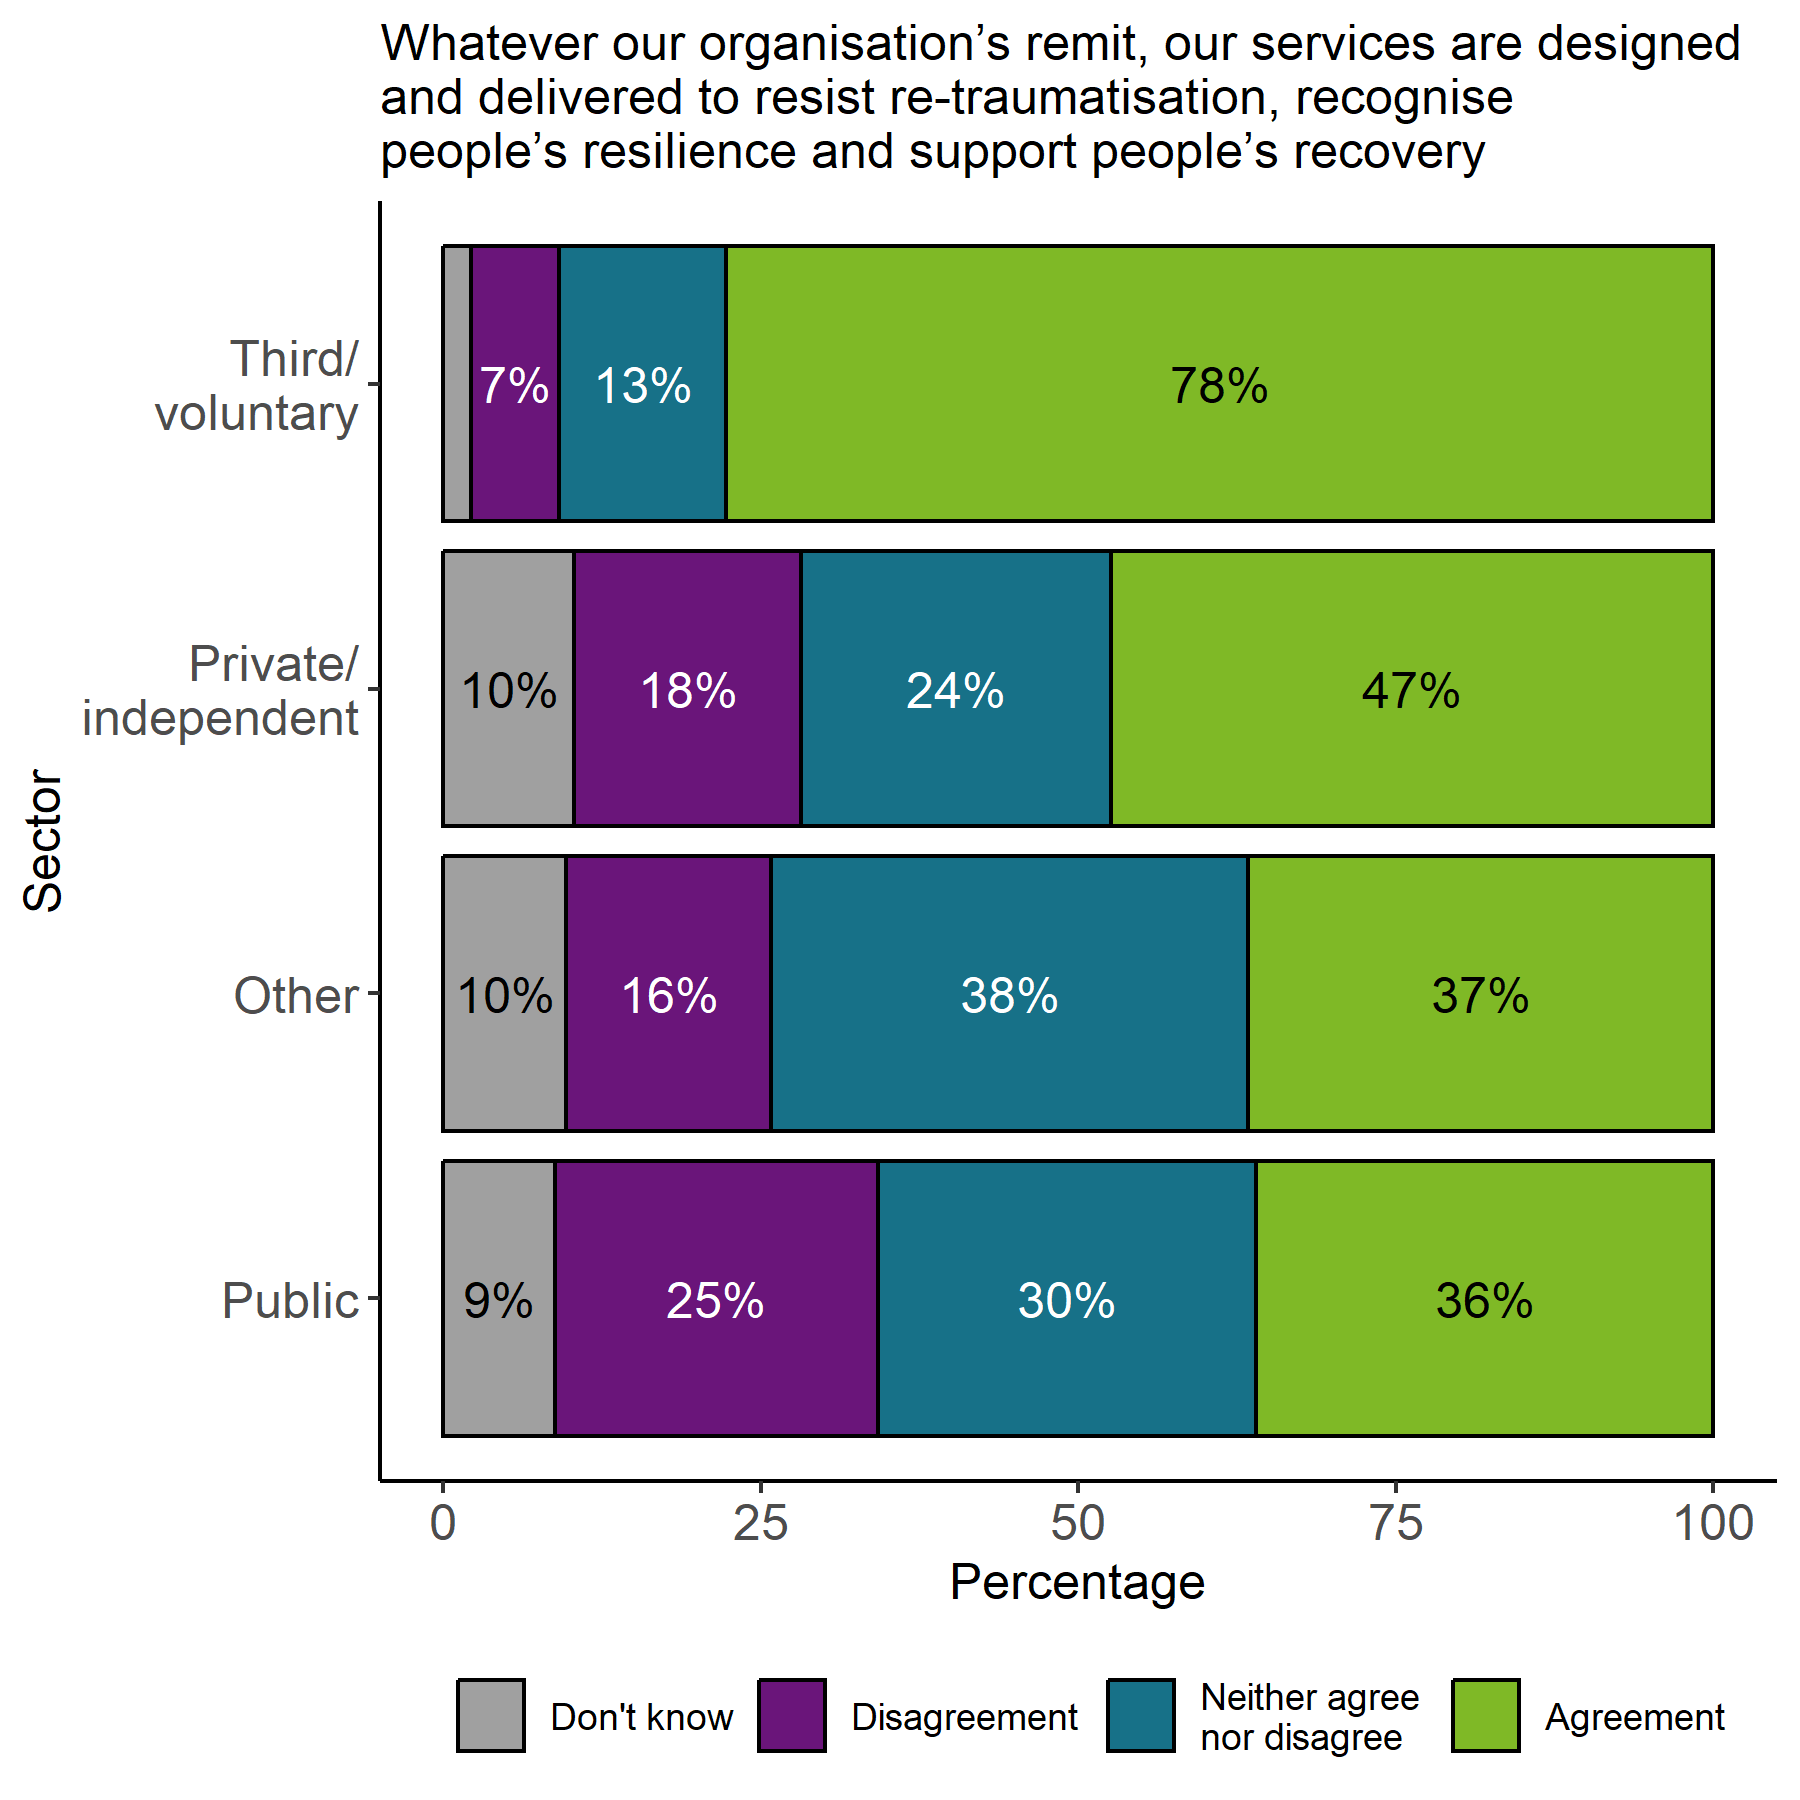
Respondents from the third/voluntary sector generally had higher levels of agreement with the statements. Comparably, public sector respondents had lower levels of agreement.
One of the most notable differences between groups was responses to the statement “Whatever our organisation’s remit, our services are designed and delivered to resist re-traumatisation, recognise people’s resilience and support people’s recovery”. The proportion of third/voluntary sector respondents who agreed or strongly agreed (78%) was statistically significantly higher than the proportion within the public sector respondents (36%). These figures are shown in Figure 15.
In line with the overall trend between surveys, there was a statistically significant increase across all sectors in the proportion of respondents who agreed about the use of feedback in the design and delivery of services. The proportion of third/voluntary sector respondents who agreed increased by more than 35 percent.
For the statement about staff wellbeing, there were only small, non-significant differences over time across most sectors. The rate of agreement for public sector respondents did however show a statistically significant decline from 59 percent in 2021 to 55 percent in 2024.
Table 8 shows the full breakdown of responses by statement broken down by sector for both 2021 and 2024.
| Question | Sector | 2021 | 2024 |
|---|---|---|---|
| Leaders at all levels understand, drive and inspire working in a trauma-informed and responsive way | Third/voluntary | 57% | 68% |
| Other | 40% | 44% | |
| Private/independent | 47% | 40% | |
| Public | 31% | 33% | |
| Staff wellbeing is valued and prioritised | Third/voluntary | 79% | 84% |
| Private/independent | 74% | 63% | |
| Other | 67% | 57% | |
| Public | 59% | 55% | |
| We continually use feedback to improve how we design and deliver our services | Third/voluntary | 42% | 80% |
| Private/independent | 36% | 67% | |
| Other | 31% | 47% | |
| Public | 18% | 44% | |
| We routinely create safe and meaningful opportunities to share power with people with lived experience of trauma | Third/voluntary | 52% | 74% |
| Private/independent | 40% | 50% | |
| Other | 35% | 39% | |
| Public | 21% | 37% | |
| All staff have the knowledge, skills, confidence and capacity to recognise and respond to people affected by trauma, through training and implementation support relevant to their job role and service remit. | Third/voluntary | NA | 59% |
| Other | NA | 37% | |
| Private/independent | NA | 33% | |
| Public | NA | 29% | |
| Our organisation’s budget includes a long-term commitment to embedding a trauma-informed and responsive approach | Third/voluntary | NA | 38% |
| Other | NA | 26% | |
| Private/independent | NA | 23% | |
| Public | NA | 20% | |
| Our policies and processes reflect an understanding of the prevalence and impact of trauma | Third/voluntary | NA | 66% |
| Other | NA | 49% | |
| Private/independent | NA | 46% | |
| Public | NA | 41% | |
| Whatever our organisation’s remit, our services are designed and delivered to resist re-traumatisation, recognise people’s resilience and support people’s recovery | Third/voluntary | NA | 78% |
| Private/independent | NA | 47% | |
| Other | NA | 37% | |
| Public | NA | 36% |
Service Area
As with the individual assessment of confidence and understanding, statements on organisational drivers were also predominately positive for service areas more commonly working in this area day to day, including violence against women and equalities, alcohol and drugs, and mental health.
This trend does differ for some statements. Service areas including employability; learning, development and training; and early years and childcare had high levels of agreement with the statement, “We continually use feedback to improve how we design and deliver our services.” This is the only statement where violence against women and equalities did not have the highest level of agreement. A fell breakdown of responses by service area are shown in Tables 9 to 16, below.
Agreement rates within these sectors has also improved over time in relation to the statement “We continually use feedback to improve how we design and deliver our services”. For example, in 2021, 27 percent of respondents working in learning, development and training agreed or strongly agreed that feedback was used, this increased by 36 percentage points to 63 percent in 2024. Similarly, agreement rates to this statement from respondents working in early years and childcare increased by almost 40 percentage points from 22 percent in 2021 to 61 percent in 2024. The full breakdown of responses to this statement are shown in the following tables and Figure 17 and Figure 17, below.
| Question | Service Area | 2021 | 2024 |
|---|---|---|---|
| Leaders at all levels understand, drive and inspire working in a trauma-informed and responsive way | Violence against women & equalities | 48% | 56% |
| Early years and childcare | 38% | 46% | |
| Alcohol and drugs | 53% | 45% | |
| Children & families | 41% | 44% | |
| Employability | 50% | 42% | |
| Primary or Secondary Education | 40% | 41% | |
| Communications | NA | 39% | |
| Justice | 43% | 39% | |
| Mental health | 45% | 39% | |
| Social care and social work | 36% | 38% | |
| Housing and homelessness | 54% | 37% | |
| Further or Higher Education | 45% | 36% | |
| Learning, development & training | 45% | 35% | |
| Don’t know | 20% | 35% | |
| Community safety | 41% | 35% | |
| Human Resources | 11% | 32% | |
| Finance & administration | 20% | 26% | |
| Physical health | 31% | 26% | |
| Digital/Data | 19% | 24% | |
| Economic development | 20% | 24% | |
| Emergency Services | 24% | 17% | |
| Planning/Building Standards | 18% | 14% | |
| Transport/Roads | 18% | 11% |
| Question | Service Area | 2021 | 2024 |
|---|---|---|---|
| Staff wellbeing is valued and prioritised | Human Resources | 78% | 76% |
| Violence against women & equalities | 60% | 74% | |
| Employability | 70% | 73% | |
| Learning, development & training | 77% | 69% | |
| Economic development | 64% | 69% | |
| Early years and childcare | 69% | 65% | |
| Digital/Data | 69% | 64% | |
| Children & families | 65% | 63% | |
| Physical health | 64% | 61% | |
| Alcohol and drugs | 68% | 61% | |
| Justice | 60% | 60% | |
| Mental health | 68% | 60% | |
| Finance & administration | 64% | 59% | |
| Social care and social work | 64% | 59% | |
| Further or Higher Education | 58% | 59% | |
| Communications | 50% | 58% | |
| Housing and homelessness | 67% | 56% | |
| Community safety | 66% | 55% | |
| Primary or Secondary Education | 65% | 51% | |
| Planning/Building Standards | 73% | 49% | |
| Don’t know | 33% | 47% | |
| Transport/Roads | 55% | 44% | |
| Emergency Services | 48% | 35% |
| Question | Service Area | 2021 | 2024 |
|---|---|---|---|
| We continually use feedback to improve how we design and deliver our services | Employability | 40% | 65% |
| Learning, development & training | 27% | 63% | |
| Communications | NA | 63% | |
| Human Resources | 11% | 61% | |
| Early years and childcare | 22% | 61% | |
| Further or Higher Education | 39% | 59% | |
| Violence against women & equalities | 32% | 57% | |
| Children & families | 25% | 55% | |
| Digital/Data | 19% | 51% | |
| Economic development | 20% | 49% | |
| Social care and social work | 28% | 49% | |
| Alcohol and drugs | 35% | 49% | |
| Housing and homelessness | 39% | 48% | |
| Primary or Secondary Education | 23% | 48% | |
| Don’t know | 33% | 47% | |
| Mental health | 30% | 46% | |
| Justice | 25% | 45% | |
| Community safety | 27% | 44% | |
| Physical health | 20% | 44% | |
| Finance & administration | 14% | 39% | |
| Planning/Building Standards | NA | 30% | |
| Transport/Roads | 18% | 27% | |
| Emergency Services | 19% | 19% |
| Question | Service Area | 2021 | 2024 |
|---|---|---|---|
| We routinely create safe and meaningful opportunities to share power with people with lived experience of trauma | Violence against women & equalities | 38% | 61% |
| Alcohol and drugs | 43% | 57% | |
| Don’t know | 27% | 53% | |
| Children & families | 30% | 50% | |
| Employability | 20% | 49% | |
| Early years and childcare | 30% | 48% | |
| Communications | 50% | 45% | |
| Social care and social work | 33% | 45% | |
| Mental health | 33% | 45% | |
| Justice | 30% | 44% | |
| Housing and homelessness | 46% | 43% | |
| Learning, development & training | 29% | 40% | |
| Further or Higher Education | 42% | 40% | |
| Community safety | 30% | 39% | |
| Human Resources | 11% | 39% | |
| Primary or Secondary Education | 25% | 37% | |
| Economic development | 20% | 33% | |
| Physical health | 25% | 32% | |
| Digital/Data | NA | 28% | |
| Finance & administration | 15% | 27% | |
| Emergency Services | 19% | 20% | |
| Planning/Building Standards | 9% | 19% | |
| Transport/Roads | 18% | 13% |
| Question | Service Area | 2021 | 2024 |
|---|---|---|---|
| All staff have the knowledge, skills, confidence and capacity to recognise and respond to people affected by trauma, through training and implementation support relevant to their job role and service remit. | Violence against women & equalities | NA | 56% |
| Alcohol and drugs | NA | 50% | |
| Don’t know | NA | 41% | |
| Community safety | NA | 41% | |
| Early years and childcare | NA | 40% | |
| Children & families | NA | 40% | |
| Communications | NA | 40% | |
| Justice | NA | 38% | |
| Employability | NA | 37% | |
| Mental health | NA | 37% | |
| Housing and homelessness | NA | 35% | |
| Social care and social work | NA | 35% | |
| Primary or Secondary Education | NA | 33% | |
| Learning, development & training | NA | 29% | |
| Further or Higher Education | NA | 29% | |
| Economic development | NA | 27% | |
| Physical health | NA | 24% | |
| Finance & administration | NA | 23% | |
| Emergency Services | NA | 21% | |
| Human Resources | NA | 21% | |
| Digital/Data | NA | 19% | |
| Transport/Roads | NA | 13% | |
| Planning/Building Standards | NA | 9% |
| Question | Service Area | 2021 | 2024 |
|---|---|---|---|
| Our organisation’s budget includes a long-term commitment to embedding a trauma-informed and responsive approach | Violence against women & equalities | NA | 38% |
| Alcohol and drugs | NA | 31% | |
| Employability | NA | 31% | |
| Don’t know | NA | 29% | |
| Community safety | NA | 29% | |
| Early years and childcare | NA | 29% | |
| Learning, development & training | NA | 29% | |
| Housing and homelessness | NA | 27% | |
| Communications | NA | 27% | |
| Children & families | NA | 27% | |
| Human Resources | NA | 26% | |
| Justice | NA | 26% | |
| Further or Higher Education | NA | 25% | |
| Primary or Secondary Education | NA | 24% | |
| Social care and social work | NA | 23% | |
| Mental health | NA | 21% | |
| Physical health | NA | 15% | |
| Finance & administration | NA | 15% | |
| Digital/Data | NA | 13% | |
| Economic development | NA | 11% | |
| Emergency Services | NA | 11% | |
| Planning/Building Standards | NA | 5% | |
| Transport/Roads | NA | 4% |
| Question | Service Area | 2021 | 2024 |
|---|---|---|---|
| Our policies and processes reflect an understanding of the prevalence and impact of trauma | Violence against women & equalities | NA | 57% |
| Alcohol and drugs | NA | 56% | |
| Children & families | NA | 52% | |
| Early years and childcare | NA | 51% | |
| Communications | NA | 49% | |
| Primary or Secondary Education | NA | 47% | |
| Human Resources | NA | 47% | |
| Social care and social work | NA | 46% | |
| Mental health | NA | 45% | |
| Employability | NA | 45% | |
| Housing and homelessness | NA | 45% | |
| Community safety | NA | 44% | |
| Further or Higher Education | NA | 44% | |
| Justice | NA | 42% | |
| Don’t know | NA | 41% | |
| Learning, development & training | NA | 40% | |
| Physical health | NA | 33% | |
| Emergency Services | NA | 31% | |
| Finance & administration | NA | 30% | |
| Digital/Data | NA | 29% | |
| Economic development | NA | 27% | |
| Planning/Building Standards | NA | 21% | |
| Transport/Roads | NA | 15% |
| Question | Service Area | 2021 | 2024 |
|---|---|---|---|
| Whatever our organisation’s remit, our services are designed and delivered to resist re-traumatisation, recognise people’s resilience and support people’s recovery | Violence against women & equalities | NA | 60% |
| Employability | NA | 56% | |
| Alcohol and drugs | NA | 56% | |
| Communications | NA | 52% | |
| Children & families | NA | 48% | |
| Learning, development & training | NA | 46% | |
| Early years and childcare | NA | 45% | |
| Mental health | NA | 45% | |
| Community safety | NA | 44% | |
| Social care and social work | NA | 42% | |
| Justice | NA | 42% | |
| Don’t know | NA | 41% | |
| Further or Higher Education | NA | 41% | |
| Housing and homelessness | NA | 41% | |
| Primary or Secondary Education | NA | 40% | |
| Human Resources | NA | 35% | |
| Physical health | NA | 30% | |
| Digital/Data | NA | 28% | |
| Finance & administration | NA | 28% | |
| Economic development | NA | 25% | |
| Emergency Services | NA | 16% | |
| Transport/Roads | NA | 13% | |
| Planning/Building Standards | NA | 12% |
Job Role
Respondents from senior management roles were most likely to agree with all trauma-informed organisation statements. A full breakdown of responses by job type is shown in Table 17 and Table 18.
| Question | Job Role | 2021 | 2024 |
|---|---|---|---|
| Leaders at all levels understand, drive and inspire working in a trauma-informed and responsive way | Senior management | 55% | 63% |
| Other | 45% | 40% | |
| Volunteer with no management responsibilities | 38% | 39% | |
| Middle management | 42% | 39% | |
| Frontline manager/supervisor/team leader | 37% | 37% | |
| Practitioner/frontline service delivery/officer with no management responsibilities | 32% | 34% | |
| Elected official | 50% | 31% | |
| Staff wellbeing is valued and prioritised | Senior management | 89% | 90% |
| Middle management | 71% | 79% | |
| Elected official | 70% | 69% | |
| Frontline manager/supervisor/team leader | 68% | 64% | |
| Other | 68% | 60% | |
| Volunteer with no management responsibilities | 67% | 52% | |
| Practitioner/frontline service delivery/officer with no management responsibilities | 55% | 51% | |
| We continually use feedback to improve how we design and deliver our services | Senior management | 35% | 84% |
| Middle management | 22% | 62% | |
| Volunteer with no management responsibilities | 39% | 57% | |
| Other | 30% | 49% | |
| Frontline manager/supervisor/team leader | 23% | 49% | |
| Practitioner/frontline service delivery/officer with no management responsibilities | 20% | 44% | |
| Elected official | 30% | 43% | |
| We routinely create safe and meaningful opportunities to share power with people with lived experience of trauma | Senior management | 45% | 62% |
| Volunteer with no management responsibilities | 41% | 48% | |
| Middle management | 29% | 46% | |
| Frontline manager/supervisor/team leader | 26% | 44% | |
| Other | 33% | 40% | |
| Elected official | 30% | 40% | |
| Practitioner/frontline service delivery/officer with no management responsibilities | 24% | 37% |
| Question | Job Role | 2021 | 2024 |
|---|---|---|---|
| All staff have the knowledge, skills, confidence and capacity to recognise and respond to people affected by trauma, through training and implementation support relevant to their job role and service remit. | Senior management | NA | 51% |
| Other | NA | 36% | |
| Practitioner/frontline service delivery/officer with no management responsibilities | NA | 32% | |
| Frontline manager/supervisor/team leader | NA | 32% | |
| Middle management | NA | 32% | |
| Volunteer with no management responsibilities | NA | 26% | |
| Elected official | NA | 23% | |
| Our organisation’s budget includes a long-term commitment to embedding a trauma-informed and responsive approach | Senior management | NA | 40% |
| Middle management | NA | 28% | |
| Volunteer with no management responsibilities | NA | 26% | |
| Other | NA | 26% | |
| Frontline manager/supervisor/team leader | NA | 21% | |
| Elected official | NA | 20% | |
| Practitioner/frontline service delivery/officer with no management responsibilities | NA | 20% | |
| Our policies and processes reflect an understanding of the prevalence and impact of trauma | Senior management | NA | 62% |
| Other | NA | 45% | |
| Middle management | NA | 44% | |
| Frontline manager/supervisor/team leader | NA | 43% | |
| Practitioner/frontline service delivery/officer with no management responsibilities | NA | 42% | |
| Elected official | NA | 40% | |
| Volunteer with no management responsibilities | NA | 39% | |
| Whatever our organisation’s remit, our services are designed and delivered to resist re-traumatisation, recognise people’s resilience and support people’s recovery | Senior management | NA | 68% |
| Volunteer with no management responsibilities | NA | 52% | |
| Middle management | NA | 45% | |
| Frontline manager/supervisor/team leader | NA | 39% | |
| Other | NA | 39% | |
| Practitioner/frontline service delivery/officer with no management responsibilities | NA | 38% | |
| Elected official | NA | 29% |
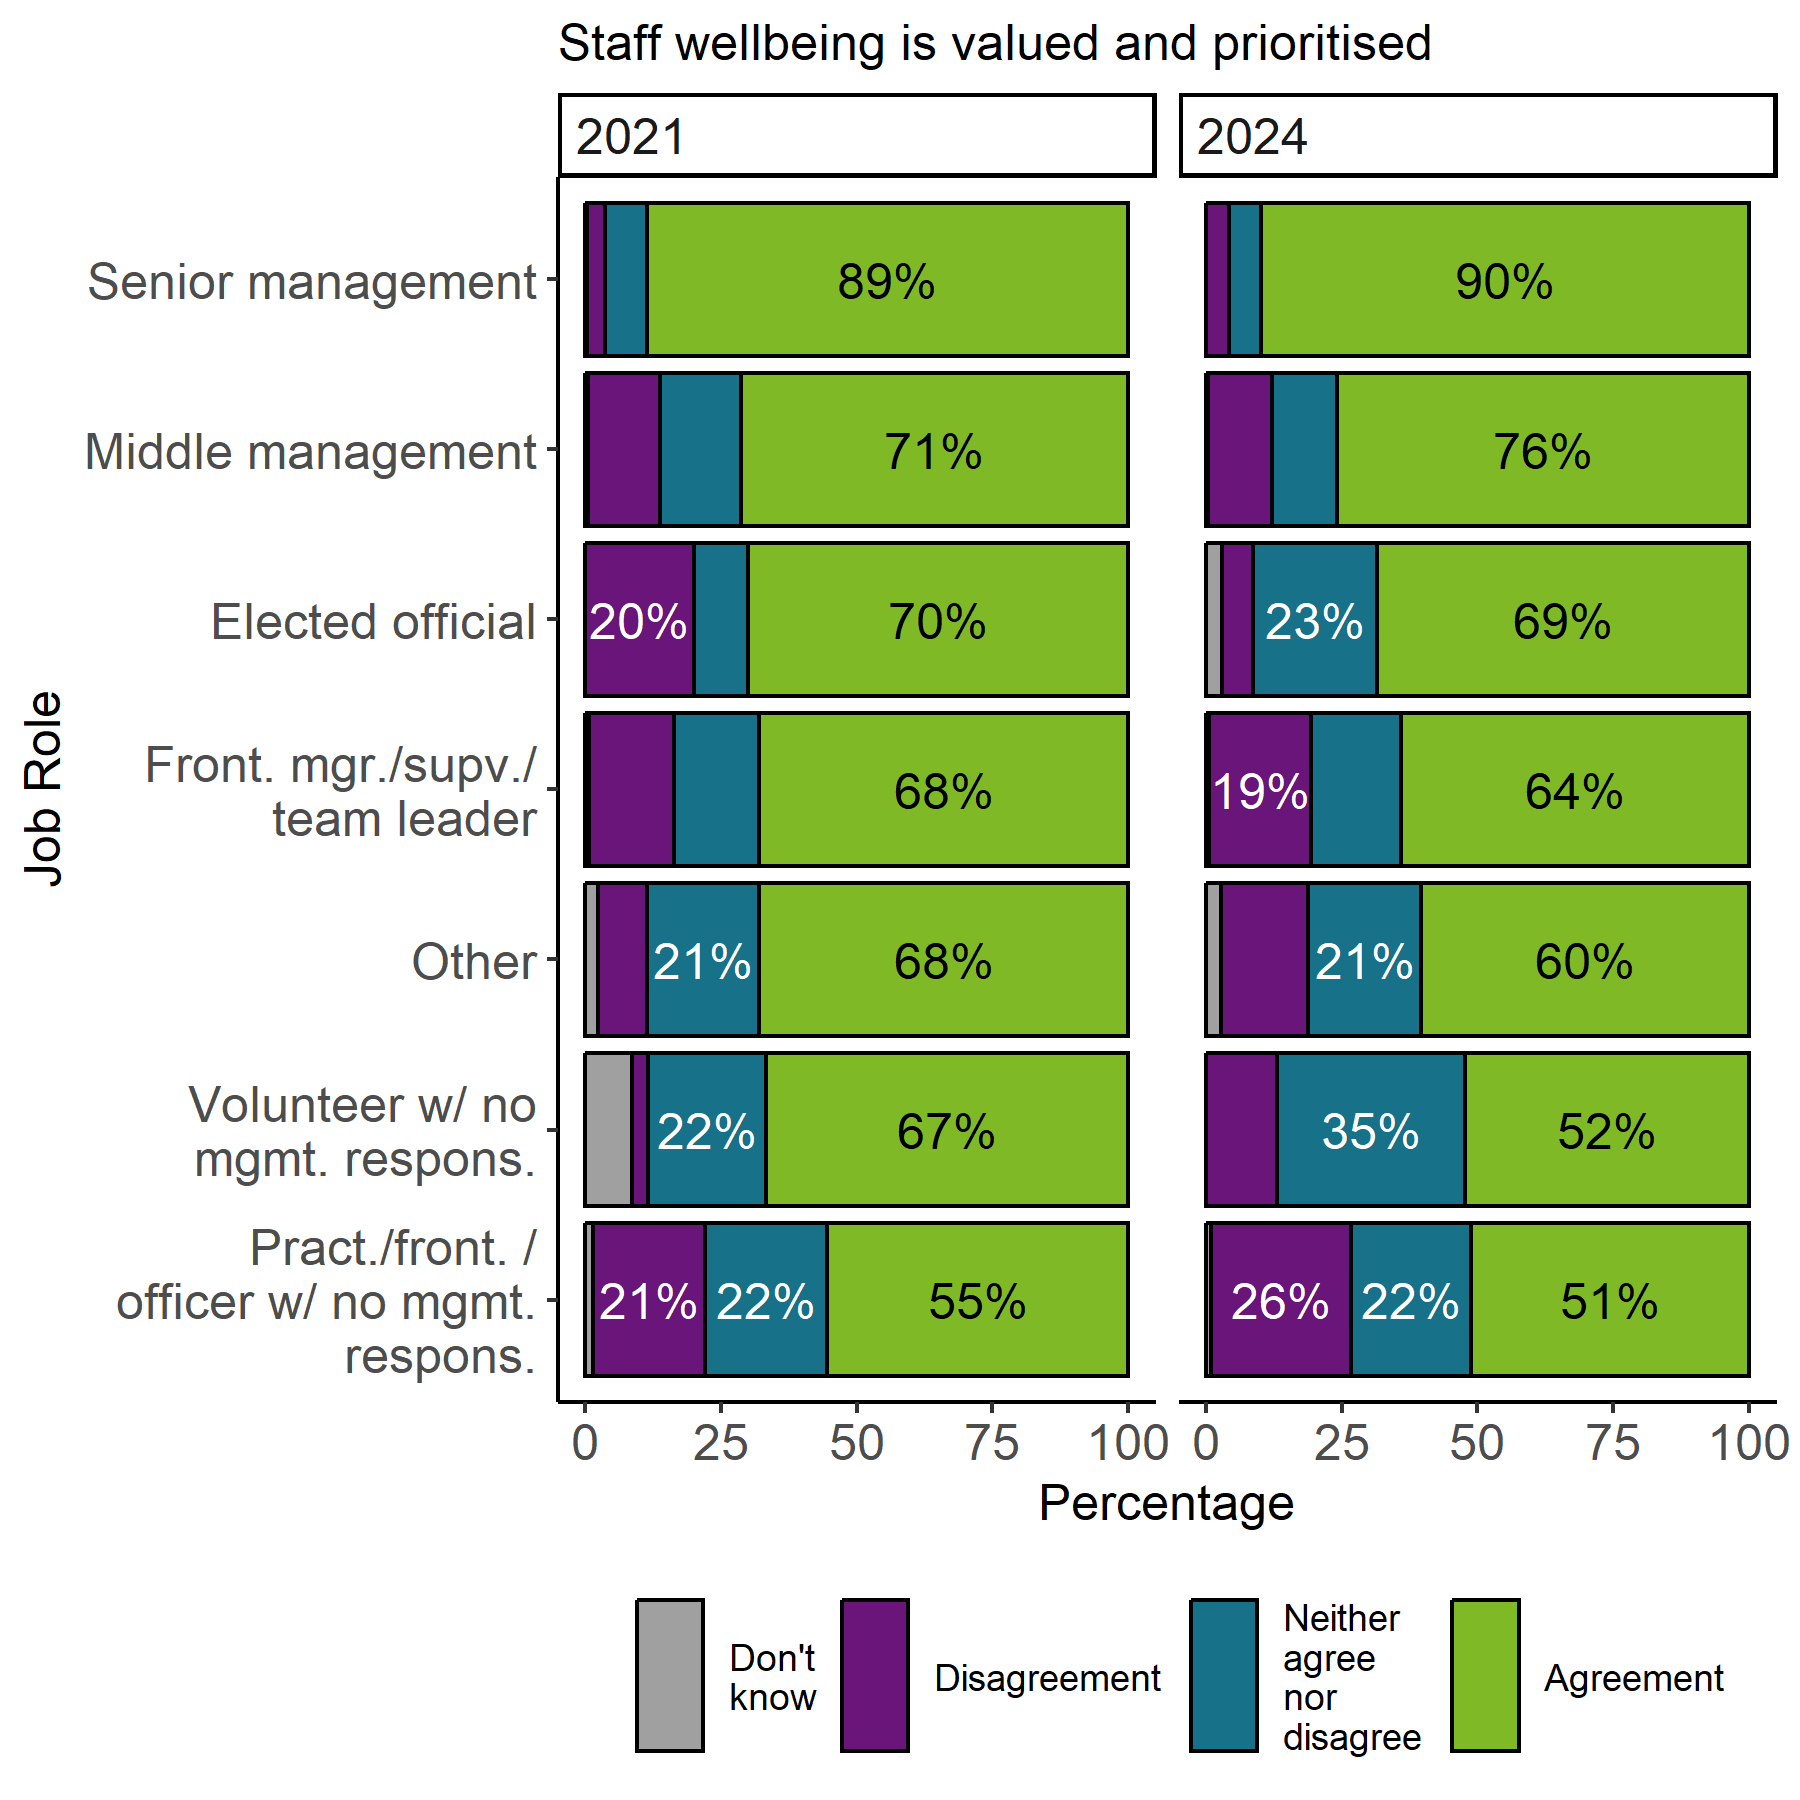
A large difference in responses between senior management and practitioner level was seen in the statement “Staff wellbeing is valued and prioritised”. Ninety percent of senior management respondents stated that they agreed or strongly agreed with this statement, compared with 51 percent of respondents working as practitioners/frontline service delivery or officers with no management responsibilities. The rates of disagreement for this staff wellbeing statement also increased over time for practitioners from 21 percent in 2021 to 26 percent in 2024. The full breakdown for this statement by job role is displayed in Figure 18.
Respondent comments: “All managers undertake trauma informed practice training, as well as all front-line staff. Managers then use toolbox talks to cascade this learning. Limited time to ensure this is embedded properly, but we are trying!”
The proportion of respondents who disagreed with the statement “Leaders at all levels understand, drive and inspire working in a trauma-informed and responsive way” increased across all job roles, aside from volunteers where the sample size was very small. The increase in disagreement was statistically significant for middle management, frontline management, and practitioners. A breakdown for this statement is shown in Figure 19.
However, for the statement “We continually use feedback to improve how we design and deliver our services”, agreement rates significantly increased between surveys for all job roles, except volunteers and elected officials where the sample sizes were small. This is shown in Figure 20.
Contact
Email: ACEstrauma@gov.scot
There is a problem
Thanks for your feedback