Neighbourhoods and communities 2023: Scottish Household Survey findings
This report provides insights into neighbourhoods and communities in Scotland. It draws on key data from the Scottish Household Survey (2023) to explore neighbourhoods and communities both at a national level in Scotland and for different subgroups and different places.
Communities
In 2023 people were more positive about the people-based features of their neighbourhood (such as kindness and trust) and less positive about the physical aspects of their neighbourhoods (such as the availability of places to socialise and meet new people). However, there have been improvements since 2022 in these physical aspects of neighbourhoods (Table 1).
Eighty-five percent agreed with the statement that “this is a neighbourhood where people are kind to each other” (Table 2.11 in the supporting Excel workbook), a slight fall from 87% in 2022. Nearly three quarters (74%) agreed that “this is a neighbourhood where people from different backgrounds get on well together” (unchanged from 2022), and 81% agreed that “this is a neighbourhood where most people can be trusted” (stable from 82% in 2022). Sixty-one percent agreed that “there are places where people can meet up and socialise” (an increase from 57% in 2022). Fifty-six percent agreed that “there are welcoming places and opportunities to meet new people”, an increase from 53% in 2022 ( Table 1).
| Statements | 2022 | 2023 | Change |
|---|---|---|---|
| Improved | |||
| Welcoming places and opportunities to meet new people | 53% | 56% | 3 p.p |
| Places to meet and socialise | 57% | 61% | 4 p.p |
| Worsened | |||
| Rating of neighbourhood as a ‘very good’ place to live | 57% | 55% | -3 p.p |
| Neighbourhood kindness | 87% | 85% | -2 p.p |
| Neighbours would keep an eye on home | 87% | 85% | -1 p.p |
| Would help neighbours in an emergency | 91% | 89% | -1 p.p |
In 2023, 82% of adults felt a ‘very strong’ or ‘fairly strong’ sense of belonging to their community (Table 2.21 in the supporting Excel workbook), this is stable from 83% in 2022.
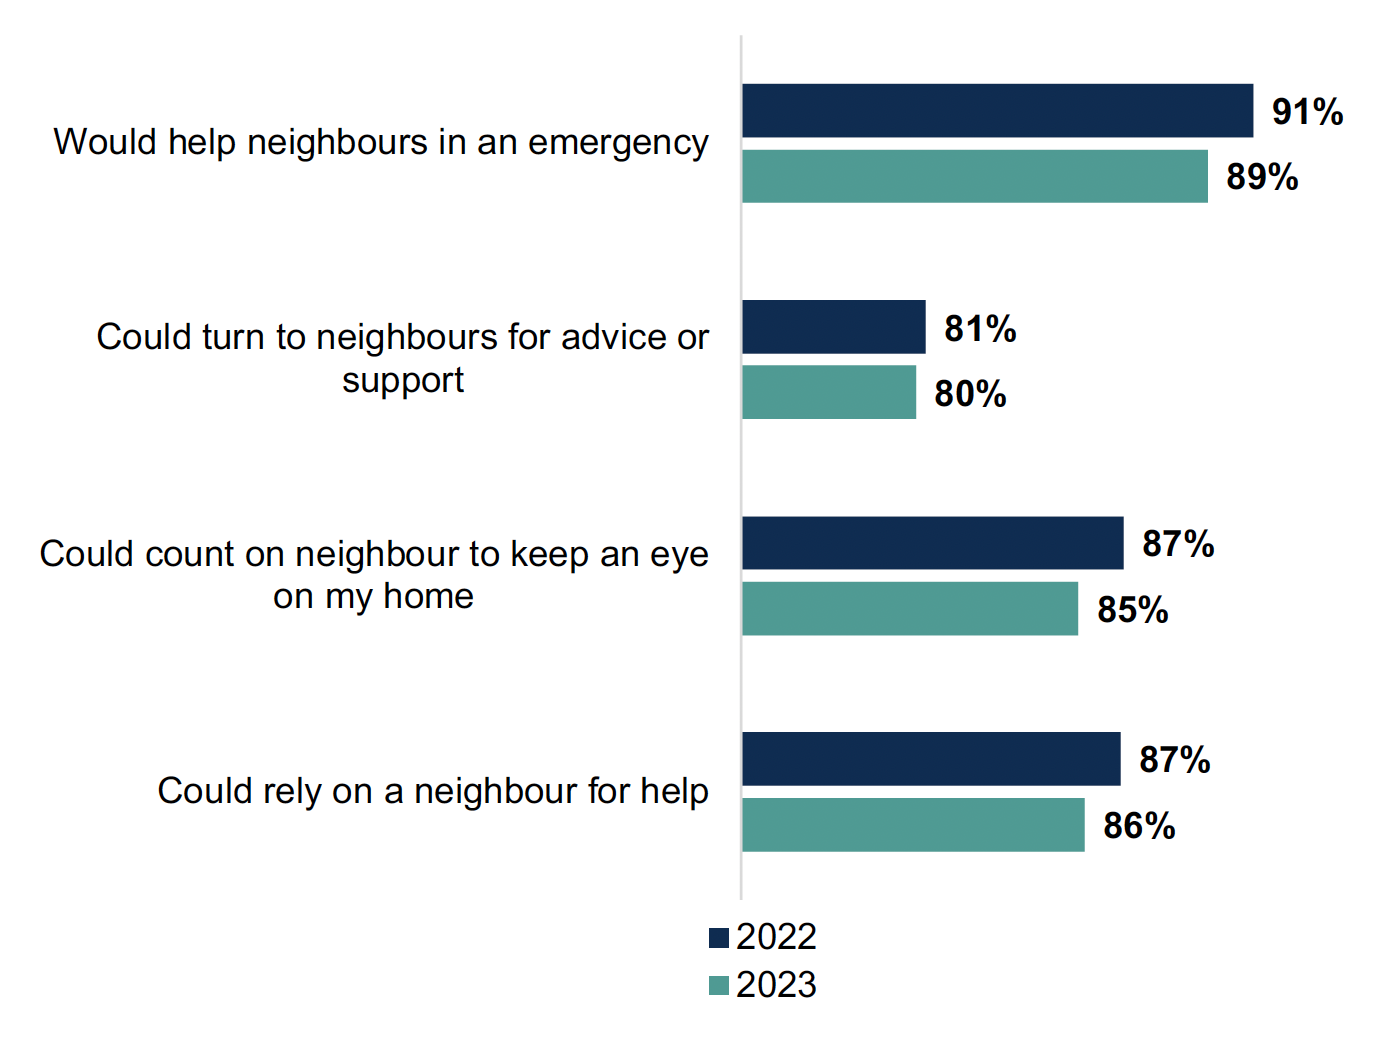
In 2023, 89% of adults agreed that “In an emergency, such as a flood, I would offer to help people in my neighbourhood who might not be able to cope well”, this is a slight decrease from 91% in 2022 (Table 1 and Figure 3). There was also slightly lower agreement that “If my home was empty, I could count on someone in the neighbourhood to keep an eye on my home”, reducing from 87% in 2022 to 85% in 2023 (Table 2.28 in the supporting Excel workbook).
In 2023, eighty percent of adults agreed with the statement “I feel I could turn to someone in this neighbourhood for advice or support”, and 86% agreed that “If I was alone and needed help, I could rely on someone in this neighbourhood to help me” (Table 2.28 in the supporting Excel workbook). Both have remained stable from 2022 (Figure 3).
Percentage of adults agreeing with statements about their involvement with other adults in the neighbourhood, 2022 and 2023, Scotland

There are differences in people’s experiences depending on where people live, and for different subgroups of the population. This includes differences in more and less deprived areas, between urban and rural settings, by housing tenure and by characteristics such as age, disability, and ethnicity (Tables 2.12 to 2.20 in the supporting Excel workbook).
This section of the report will explore how these perceptions of people-based features of the neighbourhood (such as kindness and trust) and physical aspects of their neighbourhoods (such as the availability of places to socialise and meet new people) differ across these characteristics.
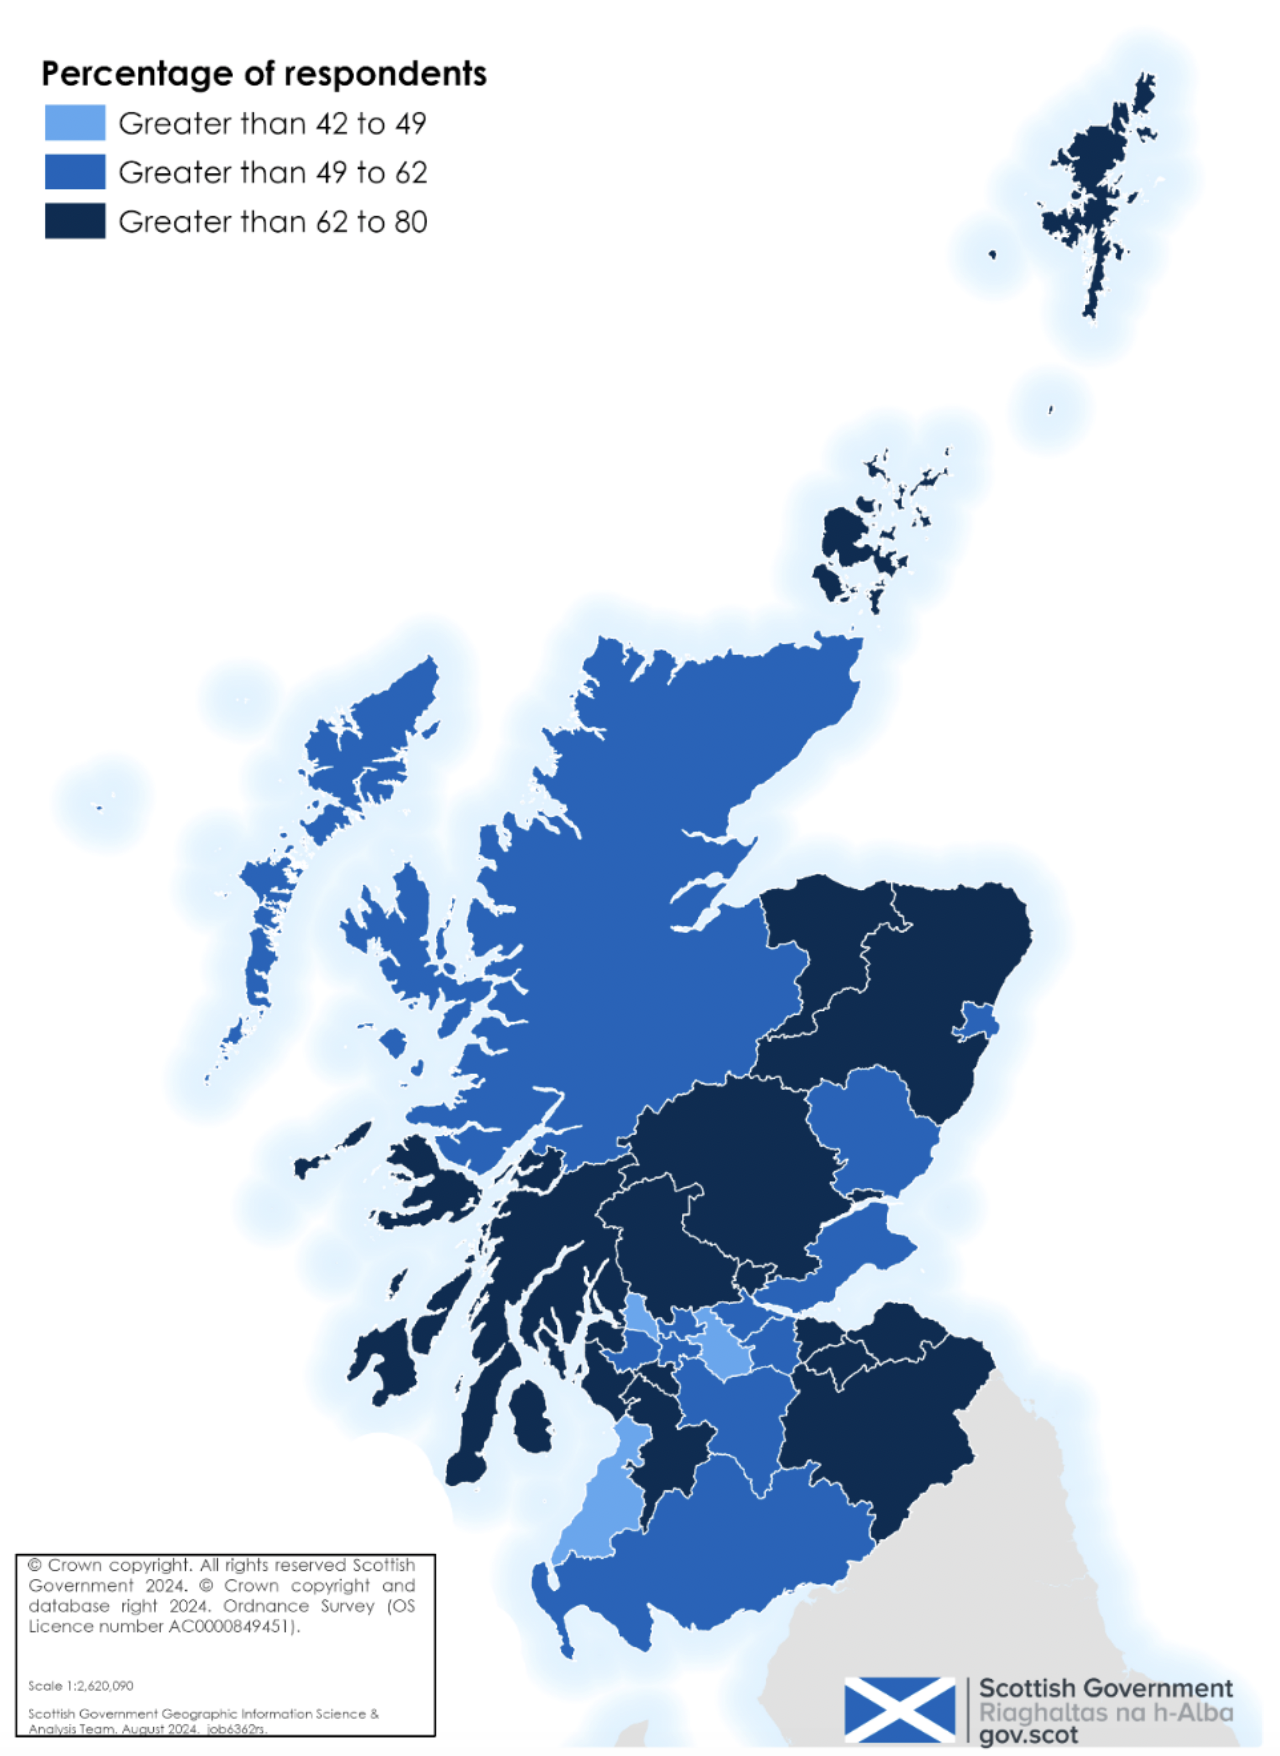
There is wide variation between Local Authorities in agreement that there are places to meet and socialise in the neighbourhood (Figure 4). Local Authorities with the highest agreement (shaded in dark blue on the map[8]) include Shetland Islands (80%), Stirling (76%), and Perth and Kinross (73%).
Percentage of adults who ‘agreed’ or ‘strongly agree’ there are places to meet and socialise, by Local Authority, 2023, Scotland[9]

In the 20% most deprived areas, just under two thirds (65%) agreed that “this is a neighbourhood where most people can be trusted” (Table 2.16 in the supporting Excel workbook), stable from 64% in 2022. This compares to 93% of adults in the 20% least deprived areas (stable from 91% in 2022). Forty-one percent of people in the most deprived areas agreed that “this is a neighbourhood where local people take action to help improve the neighbourhood”, compared with 78% in the least deprived areas.
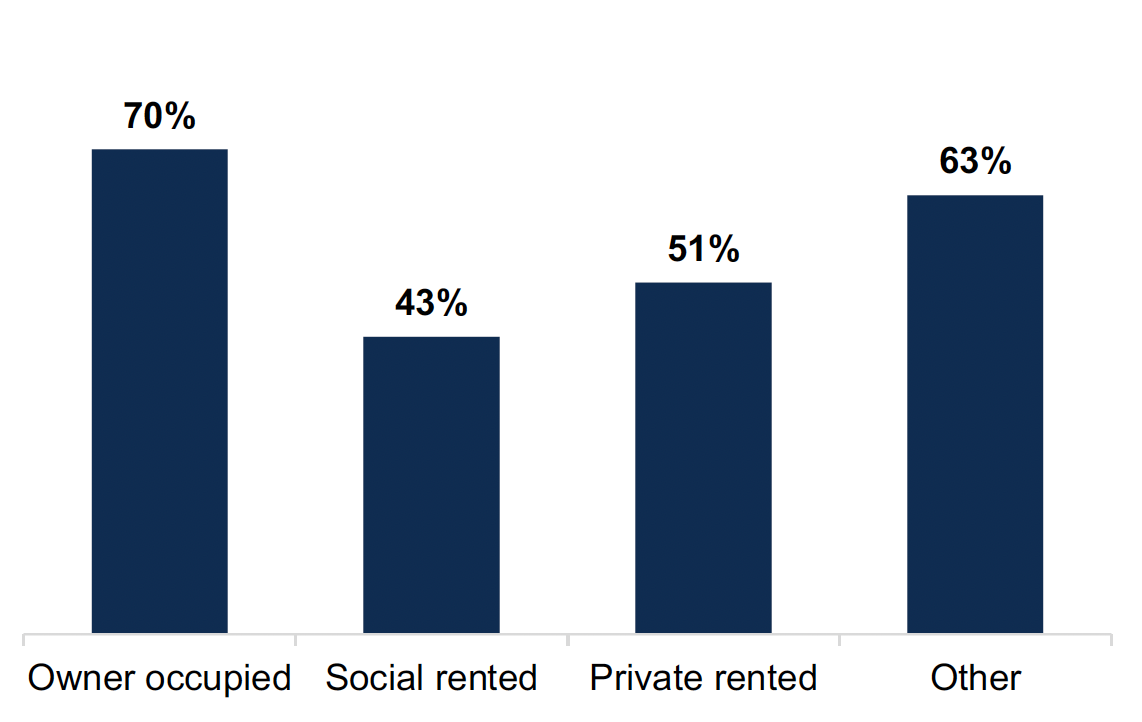
Owner occupiers felt more positively about their neighbours, and neighbourhoods, than people who socially or privately rent (Table 2.17 in the supporting Excel workbook). In 2023, 64% of people who rent socially agreed that “this is a neighbourhood where most people can be trusted”, compared to 88% of owner occupiers. 70% of owner occupiers agreed that “this is a neighbourhood where local people take action to improve the neighbourhood”, compared to 43% of people who socially rent and 51% of private renters (Figure 5).
Percentage of adults who agree that local people take action to improve the neighbourhood by housing tenure, 2023, Scotland

In 2023, 91% of owner occupiers agreed “this is a neighbourhood where people are kind to each other”, compared to 74% of private renters and 72% of social renters (Table 2.17 in the supporting Excel workbook). Perceptions of kindness have declined for social renters (from 78% in 2022) and stayed stable for private renters and owner occupiers.
Perceptions of kindness and trust increase with age. Seventy-five percent of 16 to 24 year olds agreed that others are kind to each other in their neighbourhoods, compared to 91% of those aged 75 and over. Since 2022 perceptions of kindness have fallen for 16 to 24 year olds, from 86% in 2022 to 75% in 2023 (Table 2.13 in the supporting Excel workbook).
Since 2022, there has been an increase in people aged 25 to 34 years old, 45 to 59, and 75 and over, who agree that there are places to meet and socialise in their neighbourhoods (to 61%, 63% and 63% respectively). For other age groups, agreement has stayed stable, at 60% for 16 to 24 year olds, 61% for 35 to 44 year olds, and 59% for 60 to 74 year olds (Table 2.12 in the supporting Excel workbook).
There have been improvements for other groups in the availability of places to meet and socialise in their neighbourhoods. In 2023, 61% of people living in large urban areas agreed “there are places where people can meet up and socialise” (Table 2.14 in the supporting Excel workbook), an increase of five percentage points from 2022, and 58% of those in other urban areas agreed (an increase of six percentage points from 2022). In the most deprived 40% of areas (SIMD Quintiles 1 and 2), agreement that there are places to meet improved (from 48% in 2022 to 54% in Quintile 1, and from 52% to 59% in Quintile 2). In the least deprived 20% areas this has remained stable, at 69% (Table 2.16 in the supporting Excel workbook).
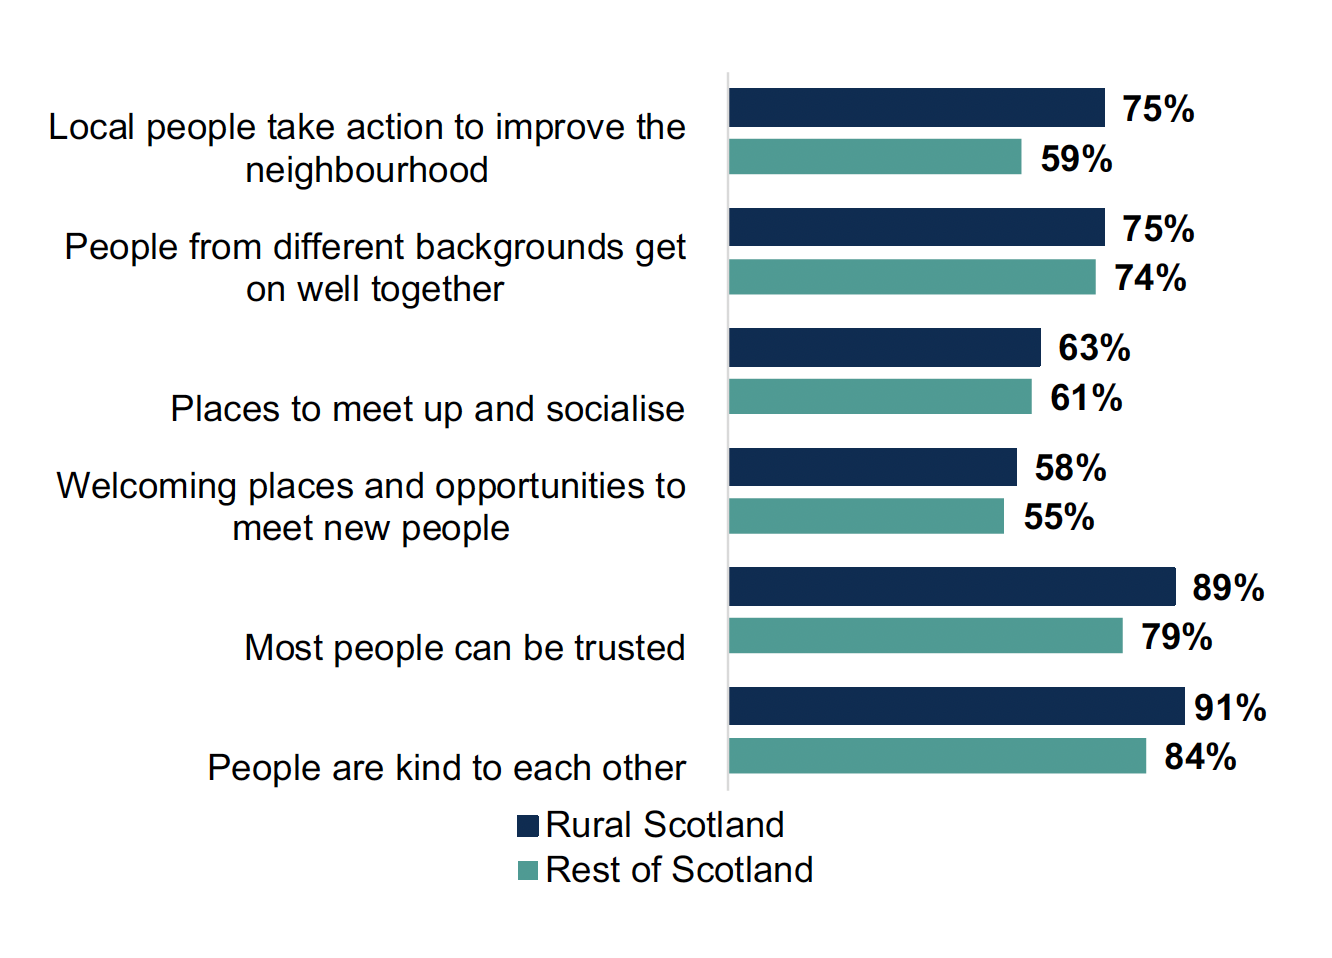
In 2023, people living in rural areas[10] tended to score higher than those in more urban settings on people based features such as neighbourhood trust and kindness (Figure 6, Table 2.15 in the supporting Excel workbook). Eighty-nine percent of people in rural Scotland agreed that “this is a neighbourhood where most people can be trusted”, compared to 79% of the rest of Scotland.
Percentage of adults agreeing with statements about their neighbourhood strengths by two-fold Urban Rural Classification, 2023, Scotland

Since 2022, however, there have been some declines for people in ‘remote rural’ settings, including agreement on neighbourhood trust (from 94% in 2022 to 90% in 2023), that people from different backgrounds get on well together (from 84% to 79%), and that local people take action to improve the neighbourhood (from 81% to 75%) (Table 2.14 in the supporting Excel workbook).
Since 2022, people in remote small towns are more likely to agree that local people take action to improve the neighbourhood, increasing from 62% to 71% in 2023 (Table 2.14 in the supporting Excel workbook). In accessible small towns, there has been a five percentage point fall in perceptions of kindness, with 87% in 2023 agreeing this is a neighbourhood where people are kind to each other.
There are differences by ethnicity and disability. In 2023, 63% of ‘White’ people agreed that “local people take action to improve the neighbourhood”, compared to 46% of ‘Other Ethnic Groups’ (Table 2.20 in the supporting Excel workbook) (stable for both groups from 2022). Eighty-two percent of ‘White’ people agreed that “this is a neighbourhood where most people can be trusted” (a decrease from 83% in 2022), compared with 67% of ‘Other Ethnic Groups’ (stable from 2022). Sixty-six percent of disabled people agree “this is a neighbourhood where people from different backgrounds get on well together”, compared to 77% of non-disabled people (Table 2.19 in the supporting Excel workbook).
Agreement on the ability to rely on neighbours increases with age (Table 2.28 in the supporting Excel workbook). Seventy-five percent of 16 to 24 year olds agreed with the statement “If I was alone and needed help, I could rely on someone in this neighbourhood to help me”. This rises to 93% of adults aged 75 and over. 16 to 24 year olds are less likely to agree they would offer to help others. Eighty-three percent of 16 to 24 year olds agreed “In an emergency, such as a flood, I would offer to help people in my neighbourhood who might not be able to cope well”, compared to 93% of 45 to 59 year olds.
Since 2022, 16 to 24 year olds are less likely to agree that “If my home was empty, I could count on someone in this neighbourhood to keep an eye on my home”, declining from 81% in 2022 to 73% in 2023. For all other age groups this has remained stable. Since 2022, there has been a decrease in adults in remote small towns who agreed they would offer to help neighbours in an emergency, from 98% in 2022 to 92% in 2023 (Table 2.29 in the supporting Excel workbook). In other urban-rural settings, agreement on offering help to neighbours has remained stable.
Sense of belonging varied by age, ethnic group, disability, deprivation, urban and rural settings, and tenure (Tables 2.21 to 2.27 in the supporting Excel workbook). In 2023, there were no differences in sense of belonging between males and females. 82% of males, and 81% of females, had a ‘very’ or ‘fairly strong’ sense of belonging (Table 2.21 in the supporting Excel workbook). This is a change from 2022, when women[11] were more likely to feel a ‘very strong’ or ‘fairly strong’ sense of belonging than men (84%, compared to 81%).
Contact
Email: socialresearch@gov.scot
There is a problem
Thanks for your feedback