Neighbourhoods and communities 2023: Scottish Household Survey findings
This report provides insights into neighbourhoods and communities in Scotland. It draws on key data from the Scottish Household Survey (2023) to explore neighbourhoods and communities both at a national level in Scotland and for different subgroups and different places.
Neighbourhood problems
In 2023, 57% of adults had personally experienced ‘any’ neighbourhood problems in the past 12 months (Table 2.39 in the supporting Excel workbook), an increase from 55% in 2022. The neighbourhood problems that were perceived as most common were ‘rubbish or litter lying around’ (33%) and ‘animal nuisance’ (31%) (Table 2.39 in the supporting Excel workbook). Since 2022, experiences of ‘rubbish or litter lying around’ have increased, from 35% to 37% (Table 2).
| Statements | 2022 | 2023 | Change |
|---|---|---|---|
| Improved | |||
| Abandoned or burned out vehicles as a common neighbourhood problem | 2% | 2% | -1 p.p |
| Experience of seeing abandoned or burned out vehicles | 2% | 2% | -1 p.p |
| Worsened | |||
| Personal experience of ‘any’ listed neighbourhood problems in past 12 months | 55% | 57% | 2 p.p |
| Experience of vandalism or graffiti or other deliberate damage to property | 7% | 8% | 1 p.p |
| Experience of rubbish or litter lying around | 35% | 37% | 3 p.p |
| Seeing drug misuse or dealing | 10% | 11% | 1 p.p |
| Personal experience of none of the listed neighbourhood problems in past 12 months | 45% | 43% | 2 p.p |
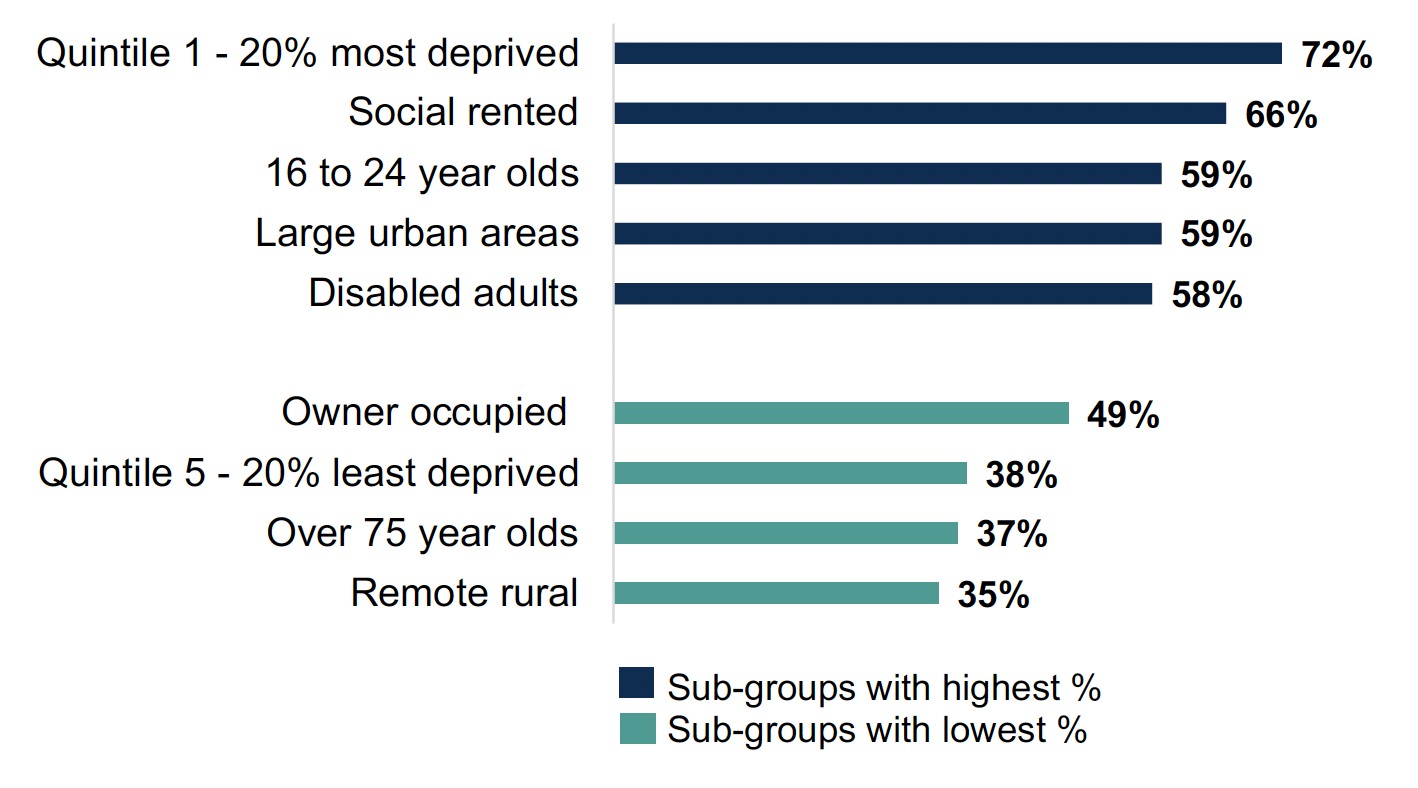
There are differences across geographic locations and subgroups of the population. Figure 7 shows the population sub-groups with the highest and lowest percentages saying neighbourhood problems are common. Those living in the 20% most deprived areas were more likely to say neighbourhood problems were common than those in the least deprived (72%, compared with 38%) (Table 2.33 in the supporting Excel workbook). These differences have stayed the same since 2022. Disabled people were more likely to say that ‘any’ neighbourhood problems were common (58%, compared to 51% of non-disabled people) (Table 2.38 in the supporting Excel workbook).
Two thirds (66%) of adults who socially rent report ‘any’ problems in their neighborhoods, compared with 54% of private renters and 49% of owner occupiers (Table 2.34 in the supporting Excel workbook). Perceptions of neighbourhood problems decreased with age, with 59% of 16 to 24 year olds, and 58% of 25 to 34 year olds, reporting ‘any’ problems in their neighbourhoods, compared with 37% of adults aged 75 and older (Table 2.35 in the supporting Excel workbook).
Thirty-eight percent of adults living in remote rural areas had experienced neighbourhood problems, compared to 63% of those living in large urban areas (Table 2.42 in the supporting Excel workbook). Since 2022, personal experience of ‘any’ neighbourhood problems has increased for 25 to 34 year olds (from 56% in 2022 to 61% in 2023).
Percentage of adults saying 'any' problem is very/fairly common in their neighbourhood, by the highest and lowest % for different sub-groups, 2023, Scotland

In terms of the types of problems that were perceived as being most common, there was a decrease from 2022 to 2023 among people in remote small towns who perceived problems with rubbish or litter (from 39% in 2022 to 29% in 2023) but an increase in those who perceived drug misuse or dealing to be a problem (from 15% in 2022 to 24% in 2023) (Table 2.36 in the supporting Excel workbook).
Contact
Email: socialresearch@gov.scot
There is a problem
Thanks for your feedback