Overcoming barriers to the engagement of supply-side actors in Scotland's peatland natural capital markets - Final Report
Research with landowners and managers in Scotland to better understand their motivations and preferences to help inform the design of policy and finance mechanisms for high-integrity peatland natural capital markets.
3 Methods overview
3.1 Our approach to this research
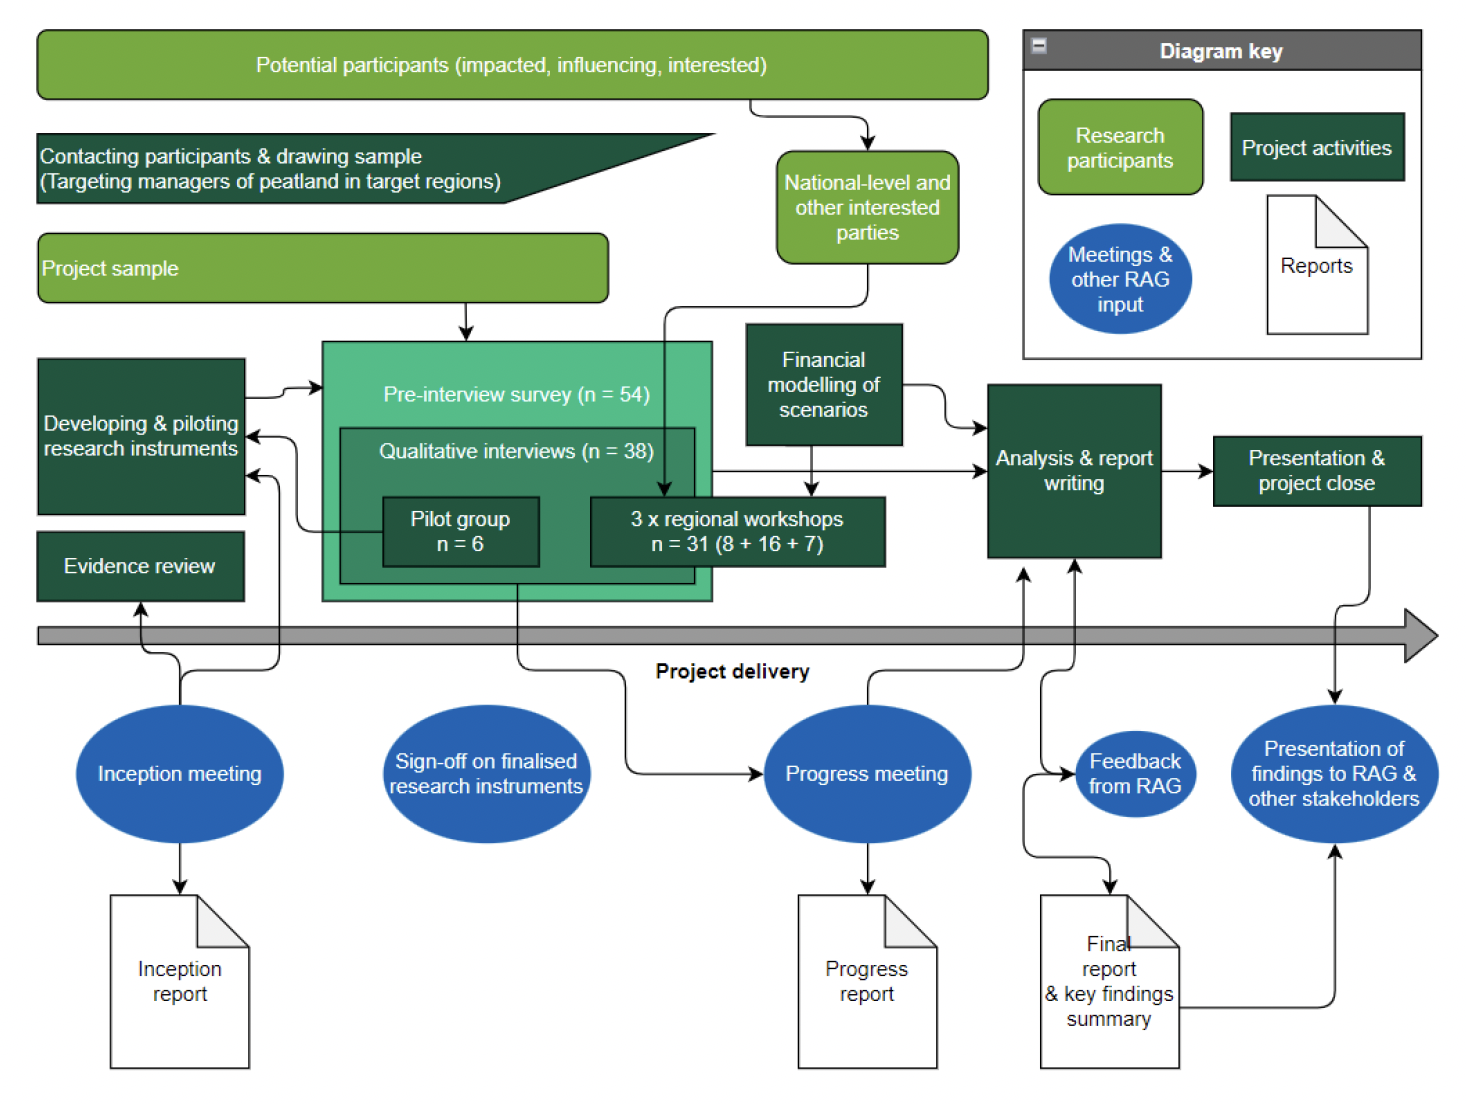
Empirical data collection for this project was undertaken using three methods: (i) a mixed methods survey; (ii) qualitative interviews; and (iii) workshops. These data collection methods were structured to make them complementary, with each step adding more detail and insight. The pre-interview online survey focused on capturing background information about participants and their views, the interviews aimed to dig deeper to understand the drivers underpinning participants' perspectives and the workshops were designed to augment and synthesise insights in a discussion format. These findings were then supplemented with financial modelling (Figure 2). Appendix 2 provides further information on the three data collection methods used.
This research design was aimed at gathering complementary insights from the different methods, including quantitative and qualitative elements, to address the research objectives, triangulate findings and add depth and detail to the findings (see Table 3). The primary focus was the qualitative interview data. The data analysis is therefore mostly qualitative in focus, with descriptive statistics provided for context. Methods were agreed in collaboration with the project Research Advisory Group (RAG), which was made up of Scottish Government and NatureScot officials. The RAG input and gave feedback on the design of the survey and interview questionnaire in the early phases of the project.
| Research objective | Methods to address |
|---|---|
| 1) Better understand the motivations and preferences of supply-side actors in Scotland's peatland natural capital markets for market participation, perception of risks, barriers, opportunities, and solutions. 2) Engage a core group of land managers in an in-depth way and identify case-specific examples of barriers/opportunities for peatland natural capital markets in the future. | Pre-interview surveys (n=54) and interviews (n=38, all of which completed survey) |
| 3) Incorporate a geographic focus to include a diverse range of peatland natural capital market supply-side actors in terms of owner type, ownership scale and regional socio-economic and environmental context. | Sample recruitment was focussed in three target regions which were chosen to represent the full range of Scottish peatland contexts: (i) South of Scotland; (ii) Loch Lomond and the Trossachs National Park area; and (iii) Skye. We constructed a sample frame and categorised respondents to ensure representation across different land manager types. |
| 4) Emphasize large private estate owners / managers, to include (where feasible) estates with different core objectives. | During multiple rounds of sample recruitment, we reviewed the stakeholder groups of those that we confirmed would attend an interview against our sample frame. We then targeted further calls for participation towards groups and networks to round out our sample for the desired representation from each stakeholder group. We were striving to have 50% of our sample be made up of large, private estates and achieved 12/38 interviewees (31.6%), although some other categories could also give good insight on motivations of estate owners (e.g. land agents, advisors, project developers). |
3.2 Achieving a relevant sample of peatland managers
This project sought to include a representative range of supply-side actors to peatland restoration projects. Although the main focus of this research was the qualitative interviews, all interview participants completed pre-interview surveys. Ultimately, however, there were more survey respondents (n=54) than interview participants (n=38) as time and logistical constraints limited some participants' ability to contribute to both the survey and interview. The workshops offered those involved in interviews as well as additional participants an opportunity to contribute.
3.2.1 Target regions
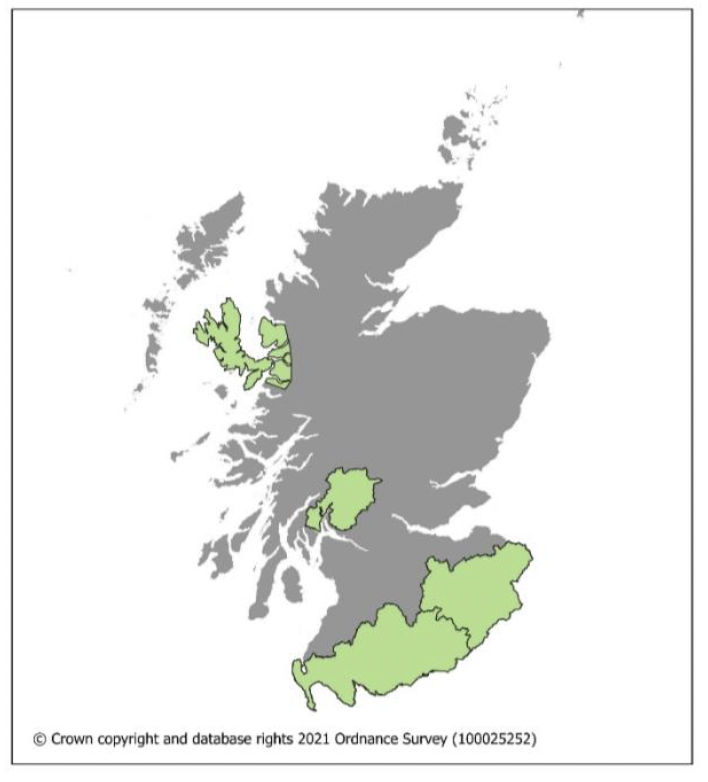
The sampling procedure was based around three target regions, with modest expansion beyond these regions to complete the sample. Sampling focussed on three case study regions of Scotland to make the sample size feasible to collect the depth of qualitative data required, while achieving a representative mix of perspectives across different Scottish peatland contexts. The following regions were chosen in collaboration with the RAG:
- Loch Lomond and the Trossachs National Park (LLTNP);
- South of Scotland Region (SoS); and
- Skye and Lochalsh (Highland).
These regions were chosen based on the following criteria:
- Good coverage of the land ownership types being investigated (private estates, farms, community ownership, tenancies, and crofts);
- Distinctiveness in their regional profiles, representing the diversity of regional and geographic contexts across Scottish peatlands; and
- Contain a significant amount of degraded peatland that could be restored under the Peatland Code (i.e., actively eroding or drained).
3.2.2 Participant recruitment
To recruit participants, key organisations across Scotland were asked to help and distribute our invitation to join the study. Participation requests were distributed via email through existing contacts lists via:
- The environmental NGO (eNGO) community (including the John Muir Trust, Scottish Wildlife Trust, National Trust for Scotland, RSPB Scotland, Scottish Futures Trust and Nourish Scotland);
- The land management community (NFUS, Moorland Forum, Scottish Land & Estates, Galbraiths, Savills, Bidwells, Forestry & Land Scotland, Scottish Tenant Farmers Association, Borders Forest Trust, Scottish Water, Tillhill, CONFOR, Scottish Woodlands, Crown Estates and Community Land Scotland); and
- Rural communities (Scottish Rural Action, Crofting Commission or Scottish Crofters Federation, Scottish Community Alliance, Community Woodlands Association, Community Land Trust Network and the Rural Youth Project).
In addition, participation requests were distributed through existing contacts and relationships developed through previous, relevant projects.
There was difficulty recruiting the desired sample size (aiming for 40-50 interview participants). After making multiple calls for participation among the networks above, the scope was broadened beyond the original three target regions.
During this time, we reviewed the stakeholder groups of those that we confirmed would attend an interview against our sample frame. We then adjusted each successive call for participation, targeting groups and networks to round out our sample for the desired representation from each stakeholder group, with the goal of having 50% of our sample be made up of large, private estates. By working with representative organisations (e.g., Scottish Land and Estates), local SAC consultants and other networks, we achieved 12 out of 38 interviewees (31.6%), supplemented by others with good insights on motivations of estate owners (e.g. land agents, advisors, project developers).
3.2.3 Pre-interview survey sample
Through the pre-interview survey, a detailed portrait of the participants in this research was obtained. This is presented below to clarify who was consulted for this research. While most of the profile information came from the survey data, these respondents also comprised the interview sample. Many of the survey questions for this section were 'tick all that apply', meaning that a respondent could select more than one response for these questions. In these questions, counts are references using the shorthand f for frequency rather than n for number of people. Other survey questions were only presented under certain conditions, depending on a respondent's prior answers. This was done to ensure the relevance of survey questions. This also means that the sample base varies across different survey questions.
The survey sample (n=54; f=67)[2] included several types of landowner and manager. The category with the largest number of responses was Owner, with nearly half of the respondents (48%, f=26) self-identifying with this category. Further detail about this Owner category specified the type of ownership[3]. Private estate owners constituted 54% of the Owner responses (f=14), while 50% identified as a Farm owner (f=13). Three of these respondents reported being a Farm owner on a contract farming agreement and one each self-identified as Landlord for a crofting estate and Community estate respectively.
The next largest group in the sample was made up of those who self-identified as Land agent, advisor, broker, project developer, comprising 26% of the total responses (f=14). Factor/estate manager was the third most frequent category, with 22% of respondents (f=12) indicating they belong to this group. Those who identified as Crofter made up 15% of the respondents (f=8). Within the Crofter category, the survey further specified the nature of the respondents' roles: All 8 identified as Crofting tenants and one of those also identified as a Crofting owner occupier.
Fewer respondents classified themselves as Common grazings user, representing 7% (f=4) of the sample. The Common grazings user category was divided into more specific classifications: One indicated being part of a Sheep Stock Club, three identified as a Common Grazing Shareholder and three respondents reported being part of a Common Grazing Committee[4].
Finally, 6% (f=3) of the overall sample identified as tenant farmers. Within this category, two reported having a Secure Tenancy and one respondent each indicated that they hold a Short Limited Duration Tenancy and a Grazing Let.
The survey also provided an Other option for respondents to specify how they categorise themselves, if they felt the predefined categories did not cover their situation. Respondents in this category identified as an 'investor', a 'representative of a community land owner', 'staff at a government-supported peatland restoration project', a 'conservation manager of a private estate', a 'head of agriculture / natural capital' and someone working at a nature reserve run by a non-governmental organisation.
3.2.4 Qualitative interview sample
The survey was designed to feed into the interview process, meaning that all interview participants completed a pre-interview survey. Therefore, it is unsurprising that the interview sample is very similar to the larger, overlapping pre-interview survey sample. Among those who completed the interview (n=38)[5], there was a very similar spread of respondent categories represented, matching the larger set of survey responses reported above. These similarities between the full sample and the interview sub-sample offer reassurance that there was not a problematic distortion in who stayed with the study to complete an interview after the survey.
3.2.5 Workshop sample
For the workshops, we invited those who had participated in interviews and sent invitations to the networks we had initially contacted, in particular inviting representation from national-level organisations and other sectors that might have broad perspectives and key insights on peatland natural capital markets, including:
- Land agents, advisors and brokers to the land management community;
- Nature-based solutions project developers; and
- Financial advisors and brokers to natural capital investors and policymakers (Table 4).
Workshops included 12 people who had been involved in surveys and interviews and 19 people participating in the research for the first time.
| Stakeholder group | Highland | LLTNP / online | SoS | Total |
|---|---|---|---|---|
| Private estates | 1 | 2 | 1 | 4 |
| Farm owners | - | 1 | 1 | 2 |
| Crofters | 3 | 1 | - | 4 |
| Gov agencies & NGOs | 1 | 5 | 3 | 9 |
| Community groups | 1 | - | - | 1 |
| Land agents, advisory, developers etc. | 2 | 4 | 2 | 8 |
| Academia | - | 2 | - | 2 |
| Total | 8 | 16 | 7 | 31 |
3.3 Sample limitations
Significant time and effort was spent in trying to secure a representative sample of peatland owners and managers, in addition to other relevant actors. The sample achieved was diverse and generated a great depth of data and wealth of perspectives on this complex topic. However, it is important to make note of several key limitations and biases in the group of participants represented in the sample. Because the opportunity to this engage with the research was advertised through networks of people interested and involved in peatland restoration, the participants are likely to be better informed and may regard restoration more positively than other peatland owners. Although a number of crofters were included, we were not able to engage with any tenant farmers, another key group who are less likely to benefit directly from peatland carbon markets than their landlords, but who may be able to play a role in developing and sharing benefits from projects in future.
3.4 Scenarios tested in the research
Four peatland restoration finance scenarios were developed iteratively with the RAG. The detailed financial assumptions and outputs of each scenario are available in the "Financial modelling" section of the report.
Current scenario A: Peatland ACTION only
- Capital costs: 100% capital grant from Peatland ACTION covers the capital works costs of restoration only (typically around £1500 per hectare, based on figures from Peatland ACTION and corresponding to the estimated cost of restoration for an area of peat made of 15% 'Actively Eroding: Hagg/Gully', 45% 'Drained: Artificial' and 40% 'Modified' as per the Peatland Code's condition categories, highly degraded peat would likely be more expensive to restore but also generate more carbon).
- Maintenance costs: Long-term maintenance costs are covered by a project's own funds (estimated at around £15-20 per ha per year, based on estimates from Peatland ACTION but could raise or fall depending on a range of factors).
- Carbon revenue: No revenue from the sale of carbon units.
Current scenario B: Peatland ACTION and Peatland Codea
- Capital costs: Peatland ACTION capital grant covers up to 100% of works costs of restoration (typically around £1500 per hectare).
- Maintenance costs: Long-term maintenance costs are covered by a project's own funds (estimated at around £15-20 per ha per year but could risk and fall depending on a range of factors).
- Carbon revenue: Revenue from the sale of verified carbon units (PCUs) via the Peatland Code.
- To meet the Peatland Code's additionality criteria, at least 15% of the project's lifetime costs (capital + ongoing maintenance and monitoring) must be covered by carbon revenues.
- Financing requirement: Financing need is limited because Peatland ACTION can fund 100% of upfront capital costs.
- Profit: Any carbon revenues not needed to cover capital investment, maintenance costs, and Peatland Code costs would be profit.
Potential scenario C: Peatland ACTION and Peatland Code with public support for maintenance costs
- Capital costs: Grant from Peatland ACTION covers 50% of the capital works costs (typically £1500 per hectare) the remaining £750 per ha must be met through private finance or forward sale of peatland carbon units (Pending Issuance Units or PIUs).
- Maintenance costs: Maintenance costs fully met for the first 10 years by grant funding in the region of £15-20 per hectare per year. The maintenance costs after 10 years are the responsibility of the project owner.
- Carbon revenue: Revenue from the sale of verified carbon units via the Peatland Code.
- Financing requirement: Upfront finance required to meet the 50% of capital costs not covered by Peatland ACTION can be met by the forward sale of peatland carbon units (PIUs) or by accessing a private finance facility (potentially supported or managed by Scottish Government). Liability for 50% of initial capital costs (typically £750 per ha, known at outset) and Peatland Code costs must be covered by project owner.
- Profit: Any carbon revenues exceeding capital investment, maintenance costs, and Peatland Code costs would be profit, to be shared between the landowner and investors (if the project is financed by investors).
Potential scenario D: Peatland Code with price floor guarantee and public support for maintenance costs
- Capital costs: 100% of capital costs met by a private finance facility (potentially supported or managed by Scottish Government).
- Maintenance costs: Maintenance costs to be fully met for the first 10 years by grant funding in the region of £15-20 per hectare per year at current prices. Beyond 10 years, the cost of maintenance to ensure permanence, required by the Peatland Code and the overall financial viability of the project, are the responsibility of the project owner. The project owner will need to put in place adequate monitoring, reporting and verification (MRV) systems, as well as carry out required maintenance works, to ensure that the project generates the projected number of PCUs.
- Carbon revenue: Revenue from the sale of verified carbon units via the Peatland Code.
- Carbon price guarantee: The Scottish Government guarantees a minimum price paid for peatland carbon units to cover project costs and ensure the project's economic viability. If carbon prices are above the minimum carbon price guarantee, the project can benefit from the upside by selling its carbon credits directly in the market.
- Financing requirement: Upfront finance required to meet 100% capital cost can be met by accessing a private finance facility (potentially supported or managed by Scottish Government – see Scotland Carbon Fund, section 7.2.4).
- Profit: Any carbon revenues exceeding capital investment, maintenance costs, and Peatland Code costs would be profit, to be shared between the landowner and investors (if the project is financed by investors). A minimum level of revenue is guaranteed by the price floor guarantee for the duration of the project. For the first 10 years, the combined maintenance grant and price floor guarantee will guarantee profit to the project. After 10 years, the project owner would need to pay maintenance costs, but should be better able to predict and budget for these based on 10 years of experience.
3.5 Financial modelling
To demonstrate the potential financial implications of each of the four tested scenarios, indicative financial models were created for financing peatland restoration activities. Note that each of the four scenarios are not designed as like-for-like in terms of the cost to Scottish Government. For instance, potential scenario C has a lower cost because the 10 years of maintenance payments (NPV = £14,000 under modelling assumptions) is lower than 50% of upfront Peatland ACTION grant (NPV = £54,000) that the newly introduced maintenance payments replace. Further analysis will be required to define the payment rates and associated conditions for any new funding mechanism.
A number of core model assumptions were chosen to remain constant across each scenario (Table 5). These assumptions were selected based on inputs from the RAG, Peatland Code published statistics and Finance Earth observed market data. The purpose of these assumptions is to demonstrate the impact varying the key scenario components can have, allowing for more simple and consistent comparisons to be made between scenarios.
Only strategies involving the sale of verified carbon units (rather than PIUs) were modelled. Selling only verified credits creates space for upfront private finance (given the absence of upfront revenues from the sale of PIUs) and avoid risks associated with the upfront sale of PIUs, such as:
- Underfunding of future peatland operation and maintenance costs if the proceeds from the sale of PIUs are not sufficient and/or not managed appropriately;
- Forgoing the potential of projects to benefit from higher prices that can potentially be achieved upon verification; and
- Selling more PIUs than the number of PCUs that a project can generate (for instance because the project is underperforming carbon generation projections based on PC emission factors or has been subject to a reversal event), thereby creating a future liability (assuming that the risk is not borne by the PIU buyer and that the project must replenish its Peatland Code buffer[6]).
| Category | Model input | Assumption | Source of assumption |
|---|---|---|---|
| Project | Area | 100ha | Based on average registered Peatland Code project size of 136 hectares as of 31 August 2023; typically projects are downsized on validation. |
| Duration | 50 years | Based on average registered Peatland Code project duration of 81 years as of 31 August 2023; typically project duration reduced on validation. | |
| Carbon revenues | Carbon prices | Peatland Carbon Unit (PCU) price of £30 +2% real annual growth[7] (equivalent to £81 in 2073 in real terms) | PIU price of £20 + 50% verification premium (i.e. £30 starting PCU price) |
| Sales strategy | Verified carbon (i.e. sale of PCUs) | See explanation on sales strategy above the table. | |
| Project registration, validation and verification costs | £2,000 (one-off validation fee) £2,000 verification fee incurred every 5 years) £400 one-off Land Carbon Registry registration | In line with average Peatland Code and Land Carbon Registry fees. | |
| Peatland Code baseline condition (% of project area) | Actively Eroding: Hagg/Gully (17.7 tCO2e/ha annual emissions) | 15% | Illustrative baseline condition mix |
| Drained: Artificial (3.3 tCO2e/ha annual emissions) | 45% | ||
| Modified (2.5 tCO2e/ha annual emissions) | 40% | ||
| Costs | Long-term inflation rate | 2.5% | In line with Office of Business Responsibility (OBR) RPI long-term inflation forecast |
| Restoration | £1,500/ha | Finance Earth assumptions based on discussion with Peatland ACTION | |
| Maintenance | £20/ha/year | Peatland ACTION |
3.6 Data Collection
An interlocking series of data collection activities were undertaken to address the research questions for this project. Both the survey instrument and interview questions were piloted with 6 participants and further refined (addressing some technical difficulties with the survey software and clarifying question wording).
3.6.1 Pre-interview survey
The full survey design is available in Appendix 2. The clarity of the peatland restoration financing scenario descriptions was assessed first by respondents, using a 0-100 sliding scale, with 0 signifying 'not at all clear' and 100 signifying 'extremely clear'. Then, the attractiveness of each of these scenarios was assessed on the same scale, where 0 represents 'not at all attractive' and 100 stands for 'extremely attractive'.
A series of Likert-type level of agreement measures were used to evaluate the views of supply side actors in a way that could be compared across finance scenarios. These items addressed a range of variables, including value alignment ('This scenario aligns with my personal values') and risk assessment ('This scenario is too risky for me'). Responses were gathered using a standard seven-point scale, ranging from strongly agree to strongly disagree (with a neutral midpoint, and a 'don't know / no opinion' option).
Throughout the pre-interview survey, open-ended follow-up questions were used after the quantitative items to probe for greater detail or to clarify the rationale for a quantitative response.
3.6.2 Qualitative interviews
After completing the pre-interview survey, the next stage for participants was the qualitative interview. The research team developed a schedule of interview questions (see Appendix 2 for the full interview guide), building on findings from the Evidence Review (see Appendix 1) and feedback from the RAG, exploring the following themes:
1. Motivations to restore peatland
a. Participants were asked why they have or have not restored their peatland and, if they had restored, which barriers they had to overcome.
2. Consultation on current and potential peatland restoration finance mechanisms
a. After talking through each of the four scenarios with the interviewer, participants were asked how each scenario fitted with their personal priorities, views and values.
b. Follow-up questions asked participants to elaborate on perceptions of risk and whether they thought other land managers would be interested.
3. Future developments
a. Participants were asked about their experience accessing information about peatland restoration and if more information would be helpful.
b. Finally, participants were asked to share their views on the interaction of peatland carbon markets with agricultural support schemes, the potential for a tax on unrestored peatlands, and other types of credits, for example biodiversity or flood mitigation.
In addition, the interviews were designed to allow for other topics to be raised where participants felt they were relevant. Interviews were completed by a total of 38 participants, with an average duration of around 50 minutes. 27 were conducted remotely via Microsoft Teams call and 11 were conducted face-to-face. All interviews were conducted by Brady Stevens.
3.6.3 Regional Workshops
A workshop was held for each of the three study regions (and expanded areas) and included a mix of participants (i.e., those within the survey/interviews samples) and other key stakeholders to ensure a balanced representation of interests. Workshops were attended by 31 total participants, 12 people who had been involved in surveys and interviews and 19 people participating in the research for the first time. An overview of findings was presented from the evidence review and interviews at the outset of each workshop. These were discussed in professionally-facilitated, small groups to ensure a high quality of deliberation, around the following prompts:
1. What role should private finance play in restoring Scottish peatlands?
2. How would you like to engage with private finance to restore your peatlands, if at all?
3. Which of the risks identified in this research is most important to you?[8]
4. Are there other barriers or enablers to peatland restoration not covered in these slides?
In addition to triangulating results, this provided an opportunity to fill gaps and enrich the data, providing a robust source of evidence.
In the second part of each workshop, Finance Earth presented detail on the four scenarios. A subsequent small group discussion reflected on these, focusing on the following prompts:
1. How do the core assumptions in these scenarios compare to your circumstances?
2. Now that you have seen more detailed budgets (i.e., financial figures) for these scenarios, did these surprise you at all?
3. Which (if any) of these would be a viable way to restore your peatlands?
Finally, workshop participants engaged in a strengths, weaknesses, opportunities and threats (SWOT) exercise, and wrote down their key take-away messages for Scottish Government. Writing on paper gave participants time to reflect on the entire workshop and clearly communicate their thoughts. Sticky notes were collected and incorporated into workshop data collection.
Workshops were held the week of 10 July 2023. The Highland and South of Scotland workshops were held in person, while the LLTNP workshop was held online and opened to all participants who were unable to attend an in-person meeting. Each workshop ran for three hours. Workshops were chaired by Brady Stevens, with at least two facilitators (including Brady) present for each workshop.
3.7 Data management and analysis
Data management and analysis procedures were designed to efficiently address the research objectives for this project while adhering to established ethical guidelines.
Informed consent was confirmed by participants through online forms. Informed consent was obtained for all participants, who are anonymised within all reports. This work is covered by a formal ethics clearance from SRUC's Ethics Committee.
Survey data were collected using the GDPR-compliant platform, Qualia Analytics (qualiaanalytics.org). Quantitative survey data were analysed with descriptive statistics using the software IBM SPSS. Qualitative survey data were analysed using a thematic analysis to identify patterns and representative quotations.
All interviews (face-to-face and virtual) were recorded and transcribed, and then analysed using a thematic analysis, supported by NVivo qualitative analysis software. The coding rationale was a combination of deductive and inductive coding. Codes were created a priori for each of the four scenarios, including codes for the 'fit' (good fit or bad fit), positive and negative aspects, risks, improvements and preferred choice. Following the interview schedule, codes were also created a priori for 'attitudes to restoration', 'sources of guidance', 'clash with agricultural support' and 'tax or financial penalties'. All of the other codes emerged during the analysis and followed a thematic analysis rationale (see Appendix 2 for a full list of coding categories).
Project team members took detailed notes and parts of workshops were recorded and transcribed. Data analysis was aimed at identifying relevant insights that had not already been covered by existing information from the pre-interview survey and qualitative interviews. This means that points from the workshop were selected with the goal of augmenting and clarifying the results presented in this report.
Contact
Email: peter.phillips@gov.scot
There is a problem
Thanks for your feedback