International competitiveness: overview
This paper considers Scotland’s competitiveness, with a particular focus on Scotland’s attractiveness for inward investment. It sets out measures and international comparisons of competitiveness and considers key drivers. It includes a focus on Scotland’s financial services sector.
Key empirical evidence on the competitiveness of the Scottish and UK economies
15. While the paper as a whole considers a range of factors which can drive competitiveness, this section has a particular focus on tax and inward investment. Scotland’s differential approach to income tax has received considerable attention, while inward investment is an important contributor to the Scottish economy that, along with movement of labour, might be affected by changes in taxation.
Inward investment
16. In relation to inward investment, the conclusions previously set out about competitiveness being a package are consistent with the reasons given for choosing specific investment locations. Research conducted by EY for their Attractiveness Survey[9] asked respondents what was important to them when considering investing in the UK outwith London. The findings illustrate the nuances in attitudes: while costs, including labour costs, feature, other aspects within the control of the Scottish Government and reliant on tax revenues, such as skills, support from economic advisory bodies, grants/incentives, and transport/digital infrastructure, also feature prominently. An evaluation of inward investment support in Scotland presented a similar picture, with businesses again most likely to cite support and availability of skills among the most important factors, with taxation cited by a smaller share.[10]
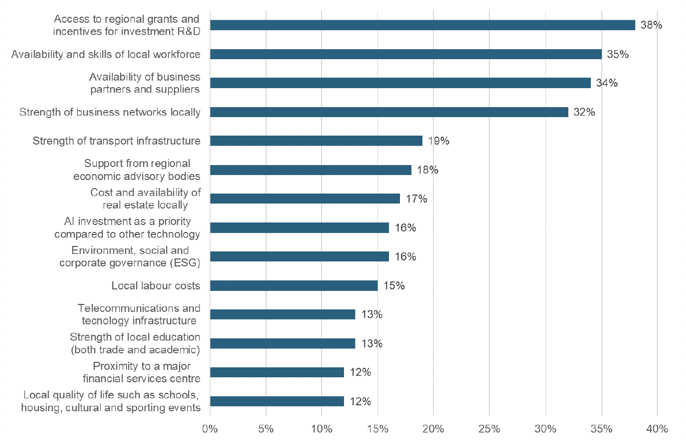
Source: EY UK Attractiveness Survey 2024
17. In the Europe-wide survey[11] investors were asked about factors influencing which country to invest in. Responses included factors such as availability of capital, costs, and the tax environment but also aspects such as skills and infrastructure which rely on tax revenues.
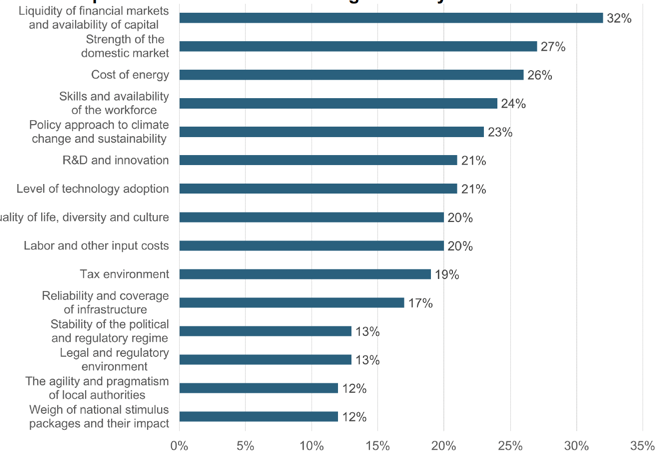
Source: EY Europe Attractiveness Survey (June 2024)
18. Focussing on taxes, it is clear that these can play a role in influencing a country’s competitiveness, including with respect to inward investment. The US Inflation Reduction Act offers investors significant sums in subsidies and tax credits. Ireland has successfully used lower corporation tax to attract investment; indeed this has been a long-term cornerstone of its economic policy framework. The introduction of a global minimum tax of 15% on multinational companies in January,[12] and recent EU court decisions suggest that there is increasing pressure to reduce the extent of this kind of tax competition.[13] However, tax is only one element of Ireland’s offer, which also includes skills and a business-friendly environment,[14] links with the diaspora and membership of the EU/Single Market. Ireland has a National Productivity and Competitiveness Council.[15]
19. Specific evidence on attitudes toward tax among inward investors also shows that, while rates are important, other factors are given more prominence (figure 3).[16]
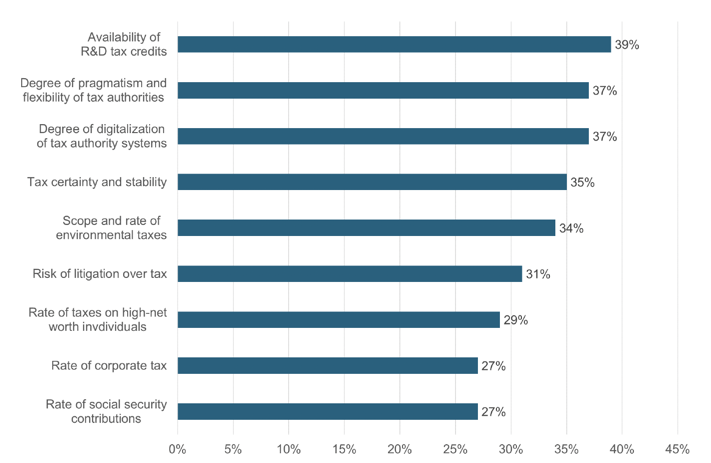
Source: EY Attractiveness Survey Europe (June 2023)
20. Econometric analysis has found that foreign direct investment is sensitive to tax rates[17] but research largely focusses on corporation tax. Other research which strips out investment undertaken for the reasons of tax and regulation finds that tax is not a factor in ultimate investment decisions.[18]
21. Anecdotal evidence from Scottish Development International highlights the importance to investors of the balance between costs (e.g. labour/utility costs, corporation tax) and the quality of the country’s offering, including factors such as skills, infrastructure and incentives, and the overall quality of life on offer. The composition of current FDI into Scotland[19] is different from that in the 1980s-90s which served as a production base to export from, and which tended to be more cost sensitive.
Tax and income tax
22. Analysis of OECD economies over the long-term suggests that income inequality has a negative impact on economic growth and suppresses skills development.[20] Taxing high earners who tend to save more and redistributing to those on low incomes (for example, through the Scottish Child Payment), who tend to spend any additional income, can boost consumption and therefore growth.[21] [22]
23. However, Scotland’s position as part of the larger UK state means that labour and capital is relatively mobile, so that intra-UK flows of people and investment can be sensitive to factors such as taxes and regulation, but also to the general cost of living, quality of life, and aspects reliant on public spending such as infrastructure, health and education. While incremental changes in taxes may not affect these flows, there is a risk increasing divergence could drive changes in behaviour – from tax planning to decisions about hours worked or where to live.
24. With respect to taxation, Scotland diverges from the rest of the UK (rUK) primarily in relation to Income Tax – with higher rates for higher bands and marginally lower rates for some lower bands. Average Council Tax for a band D property is lower in Scotland, and there are some other smaller differences in terms of property taxes and relief on Non-Domestic Rates for retail, leisure, and hospitality sectors (available in England and Wales but not in Scotland). Corporate taxes are not devolved.
Scotland Band |
Scotland Band name |
Scotland Rate (%) |
rUK Band |
rUK Band name |
rUK Rate (%) |
|---|---|---|---|---|---|
£12,571*- £14,876 |
Starter rate |
19 |
£12,571*- £50,270 |
Basic rate |
20 |
£14,877 - £26,561 |
Scottish Basic rate |
20 |
|||
£26,562 - £43,662 |
Intermediate rate |
21 |
|||
£43,663 - £75,000 |
Higher rate |
42 |
£50,271 - £125,140 |
Higher rate |
40 |
£75,001 - £125,140** |
Advanced rate |
45 |
|||
| Above £125,140** | Top rate |
48 |
Over £125,140 |
Additional rate |
45 |
*Assumes individuals are in receipt of the Standard UK Personal Allowance.
**Those earning more than £100,000 will see their Personal Allowance reduced by £1 for every £2 earned over £100,000.
25. Recent survey evidence has highlighted concern among senior business leaders about the differential between Scotland and rUK with respect to higher Income tax bands, particularly in relation to skilled talent attraction.[23] However, the most recent Business Insights and Conditions Survey suggests it is the main concern for only a relatively small proportion of businesses at the moment.[24] The Fraser of Allander Institute’s latest Scottish Business Monitor found that 57% of Scottish businesses surveyed have experienced little to no impact from Scottish Government Income Tax policy, with some firms recognising the role of higher taxes in funding public services in Scotland, although a sizeable minority, 34%, reported experiencing a larger impact.[25]
26. Scotland and the UK are particularly reliant on Income Tax in terms of the sources of overall tax revenues. Analysis by the Institute for Fiscal Studies (IFS)[26] suggests that the biggest difference between the UK and most higher-tax countries is the amount of revenue raised through social security contributions.
27. Although Scotland raises relatively more from its taxes than if policies had not been devolved from the UK,[27] estimates of the tax to GDP ratio are lower in Scotland. This is because the UK raises considerably more from the top rate[28] due to higher average incomes, particularly in London and the South East of England.[29]
28. OECD average tax wedges (which measure the proportion of total labour costs that are taken in tax and social security contributions) have generally increased in recent years, where their long-term trend since 2000 previously saw them falling.
29. While cross country comparisons of tax to GDP ratios should be interpreted with caution, statutory Scottish and UK Income Tax rates are above the OECD average, but are not high by European standards, and apply to a much smaller portion of taxpayers. This results in middle-income earners being taxed less. Comparisons in marginal tax rates are difficult, however, as the structure of taxes across countries results in high marginal rates at different points along the earnings distribution.[30]
30. Scotland and the UK raise substantially less as a proportion of GDP from labour taxation than the EU average, the Small European Countries average and the Nordic average (see figure 4). The difference with the UK is due to differences in the underlying tax base rather than lower rates of tax.
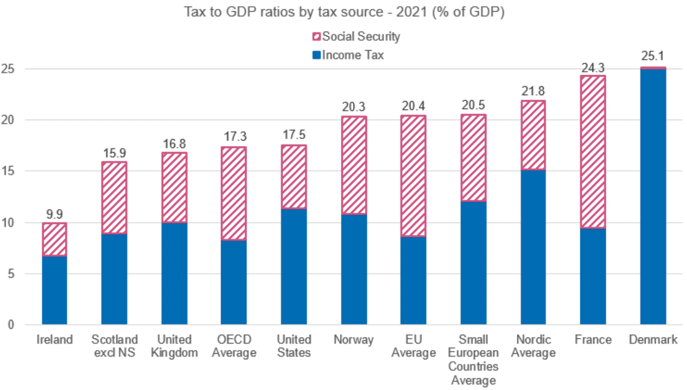
Source: OECD Revenue Statistics (2022)
31. Evaluation[31] of the 2018-19 tax changes found that these met the desired outcomes defined by four key tests: whether they raise revenue, increase progressivity, protect lower earners, and support economic growth.
32. New HMRC statistics looking at movement within the UK over 12 years, found a steady increase in net migration of taxpayers in the five years from when the tax was launched in 2017-18. In 2021-22 alone – the latest year of available data – £200 million in additional taxable income was brought into Scotland, with more Higher and Top rate taxpayers moving to Scotland than leaving. However, separate HMRC analysis of Income Tax rate changes in Scotland in the tax year 2018 to 2019 found that tax changes may have resulted in a small decrease in net migration of those earning above the Higher rate threshold, although the study could not find evidence of an effect persisting in 2019-20. [32] This analysis predates more recent changes to rates and thresholds.
33. Income Tax outturn information is only available with a long lag, largely because of the time it takes to receive self-assessment returns. Real time information on PAYE non-saving non-dividends Income Tax, along with employment and earnings information are used to provide an indication of performance and the potential effect of policy changes, prior to the full outturn information becoming available.
Financial Services
- The financial services sector in Scotland is among the most integrated in terms of a UK-wide market servicing domestic and international finance from across the UK, with London the international centre. There has been a focus from within the sector on the income tax differential between Scotland and the rest of the UK in relation to intra-UK competitiveness and ability to attract and retain talent.
- The overall picture of Scotland’s attractiveness is more nuanced even for a sector which is highly integrated within UK. Relative pay, both pre- and post-tax, is important for individuals; however, there is a range of other factors that are important for location choice decisions. These include wage costs, location, living costs, the availability and quality of skilled workers, and the availability of wider related services such as legal and digital.
- However, for higher earners, choice of location can be a factor and personal tax may be an issue in terms of mobility. In 2021-22, around 3.3% of taxpayers in Scotland worked in financial and insurance activities, compared to 3.2% for rUK.
- The financial and insurance sector is relatively well paid compared to other sectors, particularly in the rest of the UK. In 2021-22, Financial Services and Professional Services were the top two sectors for top rate taxpayers (i.e. those earning over £150,000 per year).
- Composition of jobs and pay is important for the tax take in Scotland and the amount of income tax raised. In 2021-22, mean pay in the sector was £90,439 in the rUK compared to £55,506 in Scotland, reflecting the high concentration of high earners in London in areas such as investment banking. These differences in mean pay are reflected in mean effective tax rates. The average effective tax rate in the sector in Scotland was 21.0%, compared to 25.6% in UK.
- Financial and insurance activities account for a significantly smaller share of the overall Income Tax take in Scotland than in rUK, with the sector contributing to 6% of total tax take in Scotland compared to 8% in the UK in 2021-22 (Source: Survey of Personal Incomes).
- Financial and insurance services earnings have seen strong growth in rUK in recent years compared to Scotland. Whilst this has primarily been driven by earnings growth in London and the South East, it poses a risk to Scotland’s budget position.
- The strength of the mobility response to changes in taxation crucially depends on a number of non-tax factors, including local or national amenities and the provision of public goods and services. Small differentials in tax policy are unlikely to influence people’s location choice, however, there may be a point above which mobility responses are more significant.
- In the UK, the very top earners have become more geographically concentrated over time, although many top earners are not consistently in this cohort year after year.
Contact
Email: karl.johnston@gov.scot
There is a problem
Thanks for your feedback