Pesticide Usage in Scotland: Arable crops and Potato stores 2022
This publication presents information from a survey of pesticide use on Arable crops and Potato stores in Scotland during 2022.
2022 Pesticide usage
Winter barley
- An estimated 44,173 hectares of winter barley were grown in Scotland in 2022 (based on the Single Application Form (SAF) 2022 – see changes from previous years section for further explanation), an increase of three per cent since 2020
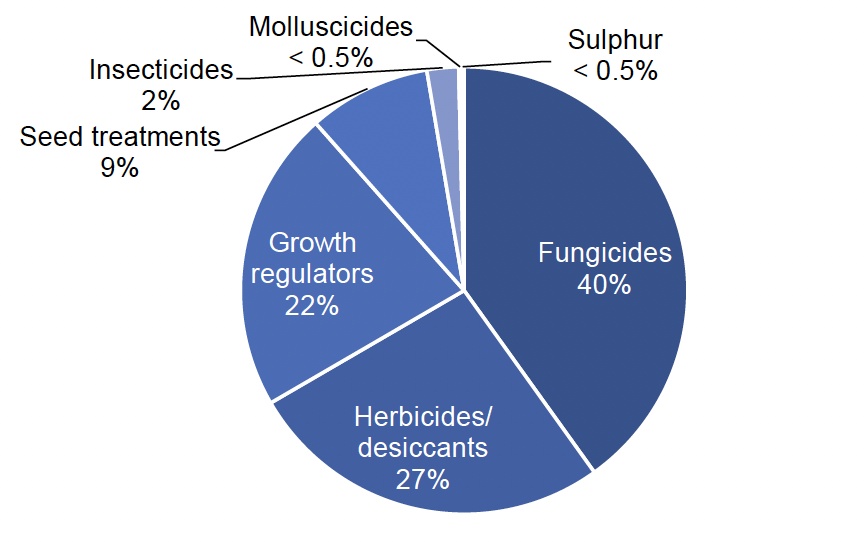
- 97 per cent of the crop was treated with a pesticide (see Figure 11 for types of pesticides used)
- Pesticides were applied to 434,175 treated hectares
- There were 124,919 kilograms of pesticide applied in total (see summary table)
- Winter barley received on average four pesticide sprays (Table 1). These sprays included 2.5 fungicide applications (applied to 97 per cent of crop area), 2.1 herbicide/desiccant applications (applied to 89 per cent), 1.8 applications of growth regulators (applied to 87 per cent) and one application of insecticide (applied to 22 per cent)
- The most common varieties encountered were LG Mountain and SY Kingsbarn (15 per cent each)
- The average reported yield was 8.4 t/ha
Summary of pesticide use on winter barley:
| Pesticide group | Formulation area treated | Weight of pesticides applied | Percentage of crop treated | Most used formulations |
|---|---|---|---|---|
| ha | kg | % | ha | |
| Fungicides | 174,124 | 42,820 | 97 | Folpet (45,476) |
| Herbicides/ desiccants | 115,115 | 44,296 | 89 | Glyphosate (20,101) |
| Insecticides | 9,911 | 45 | 22 | Esfenvalerate (5,898) |
| Growth regulators | 94,811 | 36,406 | 87 | Chlormequat (35,271) |
| Molluscicides | 858 | 98 | 2 | Ferric phosphate (561) |
| Sulphur | 846 | 605 | 2 | [z] |
| Seed treatments | 38,510 | 648 | 87 | Fluopyram/ prothioconazole/ tebuconazole (15,929) |
| All pesticides | 434,175 | 124,919 | 97 |
Note: some shorthand is used in this table: [z] = not applicable.
Spring barley
- An estimated 235,813 hectares of spring barley were grown in Scotland in 2022 (based on SAF 2022 – see changes from previous years section for further explanation), representing a decrease of nine per cent since 2020
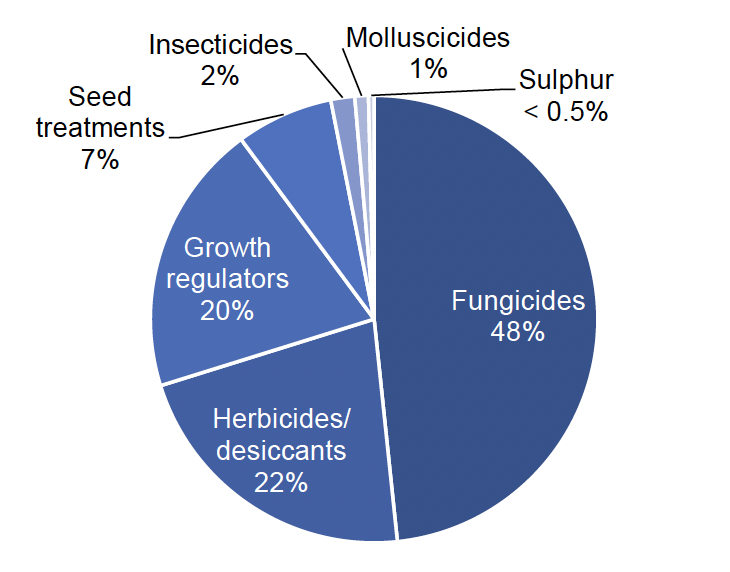
- Ninety-seven per cent of the crop was treated with a pesticide (see Figure 12 for types of pesticide used)
- Pesticides were applied to 1,569,292 treated hectares
- There were 290,436 kilograms of pesticide used in total on the crop (see summary table)
- The spring barley crop received on average 2.5 pesticide applications (Table 1). These included 1.8 fungicide applications and 1.5 herbicide/desiccant applications (applied to 93 per cent of the crop area for both groups) and 1.4 applications of growth regulators (applied to 42 per cent)
- Laureate was the most common variety, accounting for 62 per cent of the sample area, followed by LG Diablo at 13 per cent
- The average reported yield was 7.1 t/ha
Summary of pesticide use on spring barley:
| Pesticide group | Formulation area treated | Weight of pesticides applied | Percentage of crop treated | Most used formulations |
|---|---|---|---|---|
| ha | kg | % | ha | |
| Fungicides | 677,963 | 157,229 | 93 | Folpet (201,091) |
| Herbicides/ desiccants | 545,815 | 99,592 | 93 | Metsulfuron-methyl/ thifensulfuron-methyl (89,476) |
| Insecticides | 7,162 | 35 | 3 | Lambda-cyhalothrin (7,162) |
| Growth regulators | 135,898 | 20,756 | 42 | Trinexapac-ethyl (45,314) |
| Sulphur | 5,825 | 9,377 | 2 | [z] |
| Seed treatments | 196,629 | 3,448 | 83 | Imazalil/ipconazole (88,800) |
| All pesticides | 1,569,292 | 290,436 | 97 |
Note: some shorthand is used in this table: [z] = not applicable.

Winter wheat
- An estimated 105,827 hectares of winter wheat were grown in Scotland in 2022 (based on SAF 2022 – see changes from previous years section for further explanation), representing an increase of 16 per cent since 2020
- Ninety-eight per cent of the crop was treated with a pesticide (see Figure 13 for types of pesticide used)
- Pesticides were applied to 1,454,363 treated hectares
- There were 376,930 kilograms of pesticide used in total on the crop (see summary table)
- The winter wheat crop received on average 5.1 pesticide applications (Table 1). These included 3.5 fungicide applications and 2.3 herbicide/desiccant applications (applied to 95 per cent and 94 per cent of the crop area respectively), two applications of growth regulators (applied to 93 per cent); molluscicides and insecticides received 1.2 and one application(s) (applied to 11 and 23 per cent of the area respectively)
- LG Skyscraper was the most common variety, accounting for 42 per cent of the sample area, followed by KWS Barrel at 11 per cent
- The average reported yield was 9.4 t/ha
Summary of pesticide use on winter wheat:
| Pesticide group | Formulation area treated | Weight of pesticides applied | Percentage of crop treated | Most used formulations |
|---|---|---|---|---|
| ha | kg | % | ha | |
| Fungicides | 702,982 | 176,352 | 95 | Folpet (155,068) |
| Herbicides/ desiccants | 317,876 | 83,620 | 94 | Diflufenican/flufenacet (36,009) |
| Insecticides | 25,133 | 146 | 23 | Lambda-cyhalothrin (14,929) |
| Growth regulators | 286,067 | 104,287 | 93 | Trinexapac-ethyl (114,339) |
| Molluscicides | 14,265 | 1,459 | 11 | Ferric phosphate (13,399) |
| Sulphur | 5,847 | 9,315 | 5 | [z] |
| Seed treatments | 102,194 | 1,751 | 91 | Fludioxonil (51,891) |
| All pesticides | 1,454,363 | 376,930 | 98 |
Note: some shorthand is used in this table: [z] = not applicable.
Spring wheat
This crop was not recorded separately in SAF data. Based upon the proportions of spring and winter wheat encountered in the survey it was estimated that 1,291 hectares of spring wheat were grown in Scotland in 2022, representing a decrease of 43 per cent since 2020.
- Ninety-nine per cent of the crop was treated with a pesticide (see Figure 14 for types of pesticides used)
- Pesticides were applied to 12,478 treated hectares
- There were 2,890 kilograms of pesticide used in total on the crop (see summary table below)
- The spring wheat crop received on average 3.5 pesticide applications (Table 1). These included 2.7 fungicide applications and 1.4 herbicide/desiccant applications (applied to 92 per cent of the crop area for both groups) and 1.2 applications of growth regulators (applied to 92 per cent)
- The most common variety grown, accounting for 35 per cent of the sample area, was Mulika followed by Faller at 30 per cent
- The average reported yield was 6.9 t/ha
Summary of pesticide use on spring wheat:
| Pesticide group | Formulation area treated | Weight of pesticides applied | Percentage of crop treated | Most used formulations |
|---|---|---|---|---|
| ha | kg | % | ha | |
| Fungicides | 6,356 | 1,030 | 92 | Tebuconazole (1,035) |
| Herbicides/ desiccants | 2,525 | 547 | 92 | Florasulam/ halauxifen-methyl (437) |
| Growth regulators | 1,959 | 581 | 92 | Trinexapac-ethyl (1,140) |
| Sulphur | 448 | 718 | 7 | [z] |
| Seed treatments | 1,190 | 15 | 92 | Fludioxonil (989) |
| All pesticides | 12,478 | 2,890 | 99 |
Note: some shorthand is used in this table: [z] = not applicable.

Winter oats
- An estimated 8,436 hectares of winter oats were gown in Scotland in 2022 (based on SAF 2022 – see changes from previous years section for further explanation), an increase of six per cent since 2020
- Ninety-eight per cent of the crop was treated with a pesticide (see Figure 15 for types of pesticides used)
- Pesticides were applied to 73,503 treated hectares
- There were 14,947 kilograms of pesticide applied in total (see summary table)
- Winter oats received on average 4.2 pesticide sprays (Table 1). These sprays included 2.5 fungicide applications and 2.3 herbicide/desiccant applications (applied to 96 per cent and 91 per cent of the crop area respectively), 1.5 applications of growth regulators (applied to 93 per cent) and one application of insecticides (applied to 17 per cent of the crop area)
- The most common variety encountered was Dalguise accounting for 51 per cent of the sample area followed by Gerald at 22 per cent
- The average reported yield was 7.9 t/ha
Summary of pesticide use on winter oats:
| Pesticide group | Formulation area treated | Weight of pesticides applied | Percentage of crop treated | Most used formulations |
|---|---|---|---|---|
| ha | kg | % | ha | |
| Fungicides | 27,591 | 2,887 | 96 | Prothioconazole (10,097) |
| Herbicides/ desiccants | 19,695 | 4,598 | 91 | Diflufenican/flufenacet (5,670) |
| Insecticides | 1,456 | 6 | 17 | Lambda-cyhalothrin (1,456) |
| Growth regulators | 17,048 | 7,341 | 93 | Chlormequat (7,194) |
| Molluscicides | 454 | 53 | 5 | Ferric phosphate (454) |
| Seed treatments | 7,259 | 62 | 86 | Fludioxonil (6,204) |
| All pesticides | 73,503 | 14,947 | 98 |

Spring oats
- An estimated 18,713 hectares of spring oats were grown in Scotland in 2022 (based on SAF 2022 – see changes from previous years section for further explanation), a decrease of 28 per cent since 2020
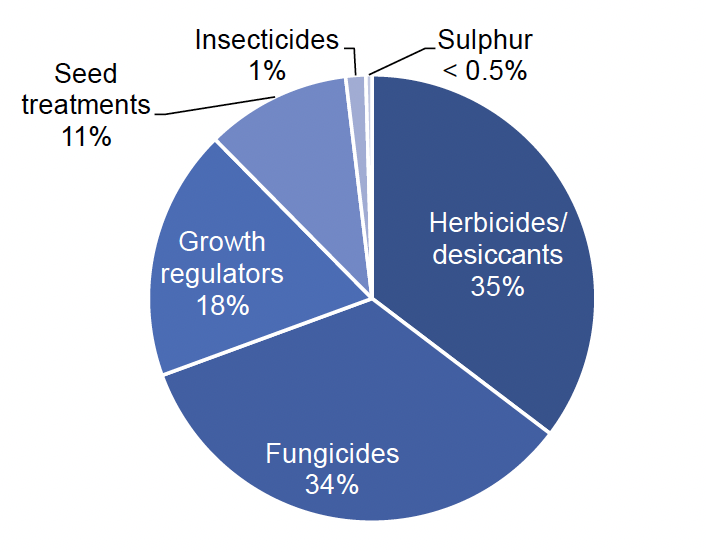
- Eighty-three per cent of the crop was treated with a pesticide (see Figure 16 for types of pesticides used)
- Pesticides were applied to 97,932 treated hectares
- There were 23,698 kilograms of pesticide applied in total (see summary table)
- Spring oats received on average 2.7 pesticide sprays (Table 1). These sprays included 1.8 fungicide applications and 1.5 herbicide/desiccant applications (applied to 78 per cent and 76 per cent of the crop area respectively) and 1.2 applications of growth regulators (applied to 71 per cent)
- The most common variety encountered was Canyon, accounting for 41 per cent of the sample area followed by Conway at 23 per cent
- The average reported yield was 6.4 t/ha
Summary of pesticide use on spring oats:
| Pesticide group | Formulation area treated | Weight of pesticides applied | Percentage of crop treated | Most used formulations |
|---|---|---|---|---|
| ha | kg | % | ha | |
| Fungicides | 33,383 | 5,153 | 78 | Prothioconazole/ spiroxamine (5,551) |
| Herbicides/ desiccants | 34,597 | 8,292 | 76 | Fluroxypyr (8,381) |
| Insecticides | 1,416 | 7 | 8 | Lambda-cyhalothrin (1,416) |
| Growth regulators | 17,815 | 9,095 | 71 | Chlormequat (8,180) |
| Sulphur | 440 | 1,038 | 2 | [z] |
| Seed treatments | 10,280 | 114 | 55 | Fludioxonil (8,192) |
| All pesticides | 97,932 | 23,698 | 83 |
Note: some shorthand is used in this table: [z] = not applicable.
Winter rye
- An estimated 7,174 hectares of winter rye were gown in Scotland in 2022 (based on SAF 2022 – see changes from previous years section for further explanation), an increase of 40 per cent since 2020
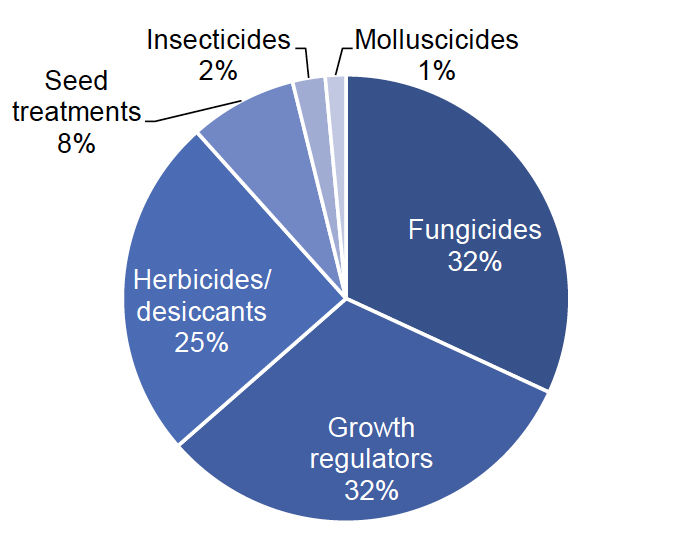
- Ninety-six per cent of the crop was treated with a pesticide (see Figure 17 for types of pesticides used)
- Pesticides were applied to 52,441 treated hectares
- There were 15,342 kilograms of pesticide applied in total (see summary table)
- Winter rye received on average 3.2 pesticide sprays (Table 1). These sprays included 2.2 fungicide applications and 1.3 herbicide/desiccant applications (applied to 84 per cent and 90 per cent of the crop area respectively), 1.6 applications of growth regulators (applied to 96 per cent) and one application of both molluscicides and insecticides (applied to 11 per cent and 17 per cent of crop area respectively)
- The most common variety encountered was KWS Tayo accounting for 43 per cent of the sample area followed by SU Performer at 32 per cent
Summary of pesticide use on winter rye:
| Pesticide group | Formulation area treated | Weight of pesticides applied | Percentage of crop treated | Most used formulations |
|---|---|---|---|---|
| ha | kg | % | ha | |
| Fungicides | 16,722 | 3,202 | 84 | Prothioconazole/ spiroxamine (2,763) |
| Herbicides/ desiccants | 13,014 | 4,488 | 90 | Pendimethalin/ picolinafen (3,273) |
| Insecticides | 1,238 | 6 | 17 | Lambda-cyhalothrin (1,238) |
| Growth regulators | 16,604 | 7,528 | 96 | Chlormequat (7,676) |
| Molluscicides | 785 | 71 | 11 | Metaldehyde (785) |
| Seed treatments | 4,078 | 46 | 57 | Fludioxonil/ fluxapyroxad/ triticonazole (2,515) |
| All pesticides | 52,441 | 15,342 | 96 |
Oilseeds
- An estimated 35,431 hectares of oilseeds (linseed, winter and spring oilseed rape) were grown in Scotland in 2022 (based on SAF 2022 – see changes from previous years section for further explanation), representing an increase of 15 per cent since 2020
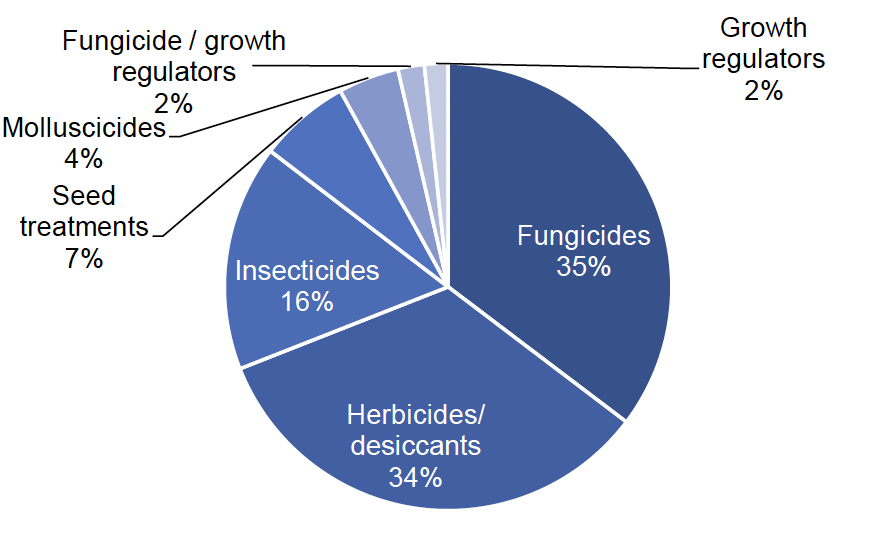
- One hundred per cent of the crop was treated with a pesticide (see Figure 18 for types of pesticides used)
- Pesticides were applied to 329,148 treated hectares
- There were 93,710 kilograms of pesticide used in total on the crop (see summary table)
- The oilseeds crop received on average 6.1 pesticide applications (Table 1). These included 2.7 fungicide applications and three herbicide/desiccant applications (applied to 98 and 94 per cent of the crop area respectively), one application of growth regulators (applied to 16 per cent), 1.2 molluscicide applications (applied to 34 per cent), 1.9 insecticides applications (applied to 80 per cent) and one application of a combined fungicide & growth regulator formulation applied to 15 per cent of the crop area
- Crome was the most common variety, accounting for 22 per cent of the sample area, followed by Aurelia at 16 per cent (both winter oilseed rape)
- The oilseeds average reported yield was 4.5 t/ha
Summary of pesticide use on oilseeds:
| Pesticide group | Formulation area treated | Weight of pesticides applied | Percentage of crop treated | Most used formulations |
|---|---|---|---|---|
| ha | kg | % | ha | |
| Fungicides | 116,260 | 18,997 | 98 | Prothioconazole/ tebuconazole (27,681) |
| Fungicide/ growth regulators | 6,275 | 1,894 | 15 | Mepiquat chloride/ prohexadione-calcium/ pyraclostrobin (6,275) |
| Growth regulators | 5,599 | 1,082 | 16 | Mepiquat chloride/ metconazole (5,599) |
| Herbicides/ desiccants | 110,972 | 69,398 | 94 | Glyphosate (27,441) |
| Insecticides | 53,831 | 854 | 80 | Lambda-cyhalothrin (36,814) |
| Molluscicides | 14,459 | 1,478 | 34 | Ferric phosphate (13,684) |
| Seed treatments | 21,752 | 7 | 61 | Bacillus amyloliquefaciens strain MBI600 (21,752) |
| All pesticides | 329,148 | 93,710 | 100 |
Seed potatoes
- An estimated 11,893 hectares of seed potatoes were grown in Scotland in 2022, (based on SAF 2022 – see changes from previous years section for further explanation) representing a decrease of one per cent since 2020
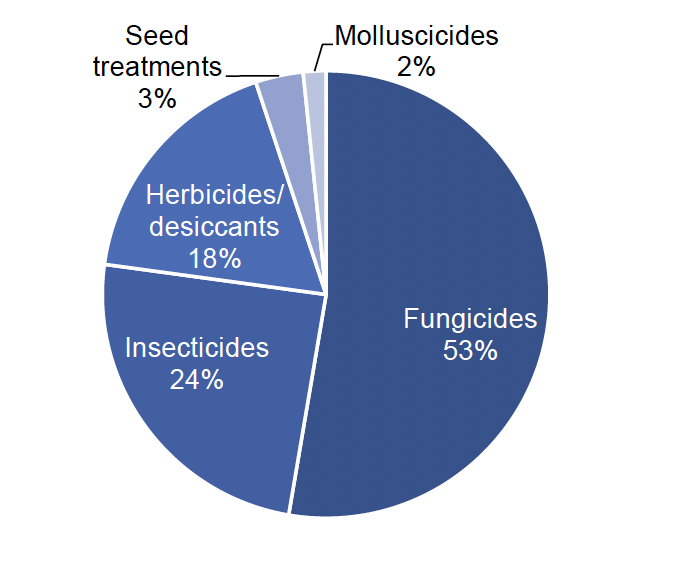
- One hundred per cent of the crop was treated with a pesticide (see Figure 19 for types of pesticide used)
- Pesticides were applied to 270,532 treated hectares
- There were 86,049 kilograms of pesticide used in total on the crop (see summary table below)
- The seed potato crop received on average 10.2 pesticide applications (Table 1). These included 8.2 fungicide applications and 2.2 herbicide/desiccant applications (applied to 100 per cent of the crop area), 5.4 and 1.9 applications of insecticide and molluscicide respectively (applied to 97 and 20 per cent of the area respectively)
- Maris Piper was the most common variety, accounting for 24 per cent of the sample area, followed by Innovator at seven per cent
- The average reported yield was 38.4 t/ha
Summary of pesticide use on seed potatoes:
| Pesticide group | Formulation area treated | Weight of pesticides applied | Percentage of crop treated | Most used formulations |
|---|---|---|---|---|
| ha | kg | % | ha | |
| Fungicides | 142,512 | 61,688 | 100 | Mancozeb (25,119) |
| Herbicides/ desiccants | 48,027 | 20,523 | 100 | Carfentrazone-ethyl (13,273) |
| Insecticides | 66,219 | 1,341 | 97 | Lambda-cyhalothrin (27,997) |
| Molluscicides | 4,444 | 456 | 20 | Ferric phosphate (4,444) |
| Seed treatments | 9,330 | 2,040 | 75 | Flutolanil (4,538) |
| All pesticides | 270,532 | 86,049 | 100 |
Ware potatoes
- An estimated 15,247 hectares of ware potatoes were grown in Scotland in 2022 (based on SAF 2022 – see changes from previous years section for further explanation), representing a decrease of six per cent since 2020
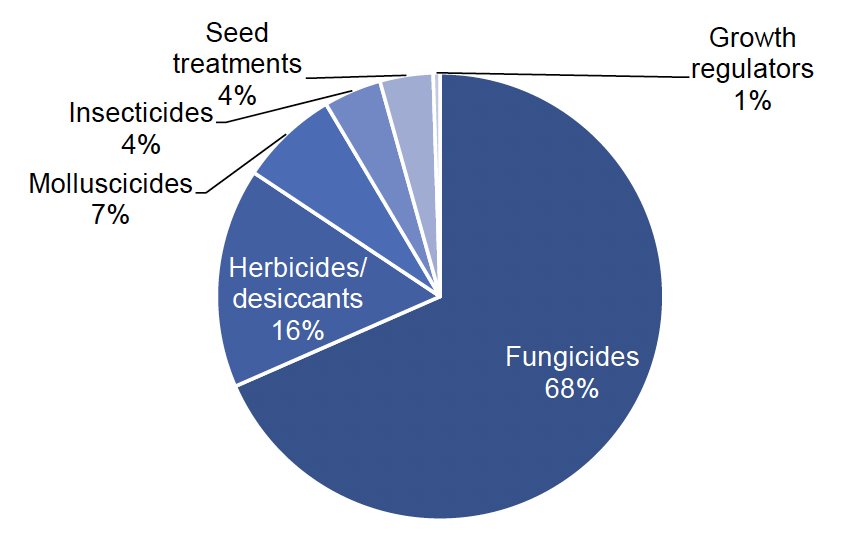
- Ninety-nine per cent of the crop was treated with a pesticide (see Figure 20 for types of pesticide used)
- Pesticides were applied to 376,918 treated hectares with 165,412 kilograms of pesticide applied in total (see summary table below)
- The ware potato crop received on average 13.7 pesticide applications (Table 1). These included 10.3 fungicide applications and 2.2 herbicide/desiccant applications (applied to 99 per cent of the crop area), insecticides and molluscicides received 2.1 and three applications each (applied to 46 per cent and 60 per cent respectively) and one application of growth regulators (applied to 12 per cent of the crop area)
- Maris Piper was the most common variety grown for ware, accounting for 42 per cent of the sample area followed by Saxon at nine per cent
- The average reported yield was 50.7 t/ha
Summary of pesticide use on ware potatoes:
| Pesticide group | Formulation area treated | Weight of pesticides applied | Percentage of crop treated | Most used formulations |
|---|---|---|---|---|
| ha | kg | % | ha | |
| Fungicides | 257,901 | 127,632 | 99 | Mancozeb (56,750) |
| Herbicides/ desiccants | 60,007 | 25,073 | 99 | Pyraflufen-ethyl (18,062) |
| Insecticides | 15,757 | 2,577 | 46 | Esfenvalerate (5,845) |
| Growth regulators | 1,869 | 5,606 | 12 | Maleic hydrazide (1,869) |
| Molluscicides | 26,909 | 2,826 | 60 | Ferric phosphate (26,909) |
| Seed treatments | 14,475 | 1,699 | 89 | Fludioxonil (6,118) |
| All pesticides | 376,918 | 165,412 | 99 |
Legumes
The legumes category includes dry harvest peas and field beans. These crops have been combined as too few holdings were encountered to report the pesticide use for each crop separately.
- An estimated 3,025 hectares of legumes were grown in Scotland in 2022 (based on SAF 2022 – see changes from previous years section for further explanation), representing an increase of 23 per cent since 2020
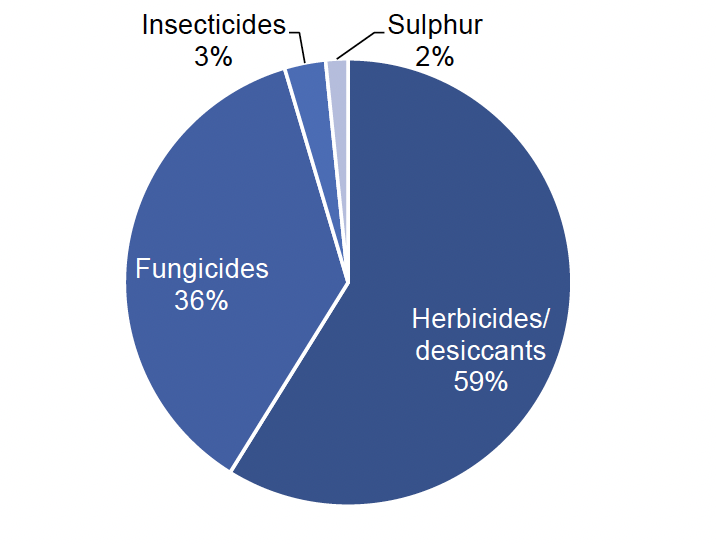
- Ninety-one per cent of the crop was treated with a pesticide (see Figure 21 for types of pesticide used)
- Pesticides were applied to 12,412 treated hectares
- There were 7,540 kilograms of pesticide used in total on the crop (see summary table below)
- The legume crop received on average 3.5 pesticide applications (Table 1). These included 1.5 fungicide applications and 2.1 herbicide/desiccant applications (applied to 84 and 88 per cent of the crop area respectively) and one application of insecticides to 12 per cent of the crop area
- The most common variety, accounting for 51 per cent of the sample area, was Fuego followed by Yukon at 13 per cent (both field beans)
- The average reported yield was 3.9 t/ha
Summary of pesticide use on legumes:
| Pesticide group | Formulation area treated | Weight of pesticides applied | Percentage of crop treated | Most used formulations |
|---|---|---|---|---|
| ha | kg | % | ha | |
| Fungicides | 4,538 | 708 | 84 | Azoxystrobin (1,330) |
| Herbicides/ desiccants | 7,304 | 6,050 | 88 | Glyphosate (1,847) |
| Insecticides | 369 | 3 | 12 | Lambda-cyhalothrin (324) |
| Sulphur | 200 | 780 | 3 | [z] |
| All pesticides | 12,412 | 7,540 | 91 |
Note: some shorthand is used in this table: [z] = not applicable.
Contact
Email: psu@sasa.gov.scot
There is a problem
Thanks for your feedback