Pesticide Usage in Scotland: Outdoor Vegetable Crops 2023
This publication presents information from a survey of pesticide use on outdoor vegetable crops in Scotland during 2023.
2023 Pesticide usage
Vining peas
- An estimated 9,259 hectares of vining peas were gown in Scotland in 2023, a 2% decrease since 2021
- 96% of the crop was treated with a pesticide
- Pesticide formulations were applied to 30,260 treated hectares with 13,366 kilograms of pesticide applied in total
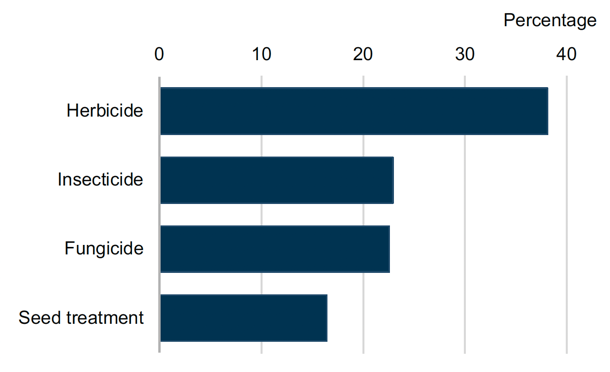
- Vining pea crops received on average 2.0 pesticide applications (supporting document Table 1). These applications included 1.2 herbicides (applied to 96% of the crop area), 1.0 insecticide (applied to 75% of the crop area) and 1.0 fungicide (applied to 74% of the crop area)
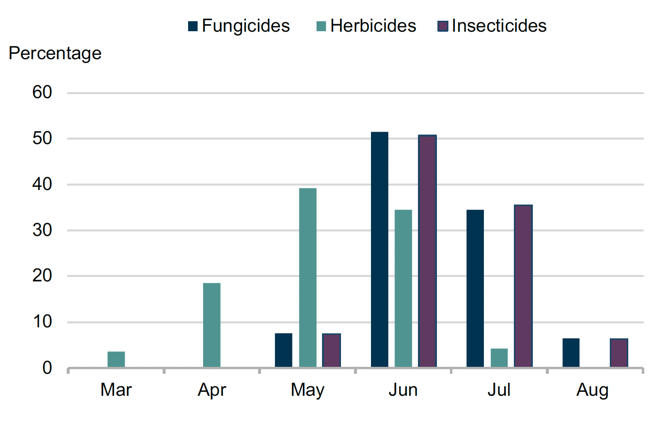
- Most herbicides were applied to vining peas in May, with the majority of fungicides and insecticides being applied in June (Figure 10)
- The only reasons specified for herbicide use were general weed control (24%) and annual broad-leaf weeds (4%). There were no reasons recorded for fungicide and insecticide use
- The most common varieties encountered were Ida (13%) and Corus, Naches and Romance each accounting for 11% of the sample respectively
| Pesticide group | Formulation area treated (ha) | Weight of pesticides applied (kg) | Percentage of crop treated (%) | Top 3 most used formulations (ha) |
|---|---|---|---|---|
| Herbicides | 11,532 | 10,252 | 96 | Imazamox/pendimethalin (8,925), Glyphosate (1,568), Bentazone (837) |
| Insecticides | 6,936 | 1,033 | 75 | Pirimicarb (6,936) |
| Fungicides | 6,825 | 1,992 | 74 | Azoxystrobin (3,429), Boscalid/pyraclostrobin (3,396) |
| Seed treatments | 4,967 | 90 | 54 | Fludioxonil (4,967) |
| All pesticides | 30,260 | 13,366 | 96 |
For details of all pesticide use on vining peas, please refer to the supporting document.
Broad beans
- An estimated area of 2,768 hectares was grown in Scotland in 2023. This represents a 20% increase since 2021
- 93% of the crop was treated with a pesticide
- Pesticide formulations were applied to 20,987 treated hectares with 7,591 kilograms of pesticide applied in total
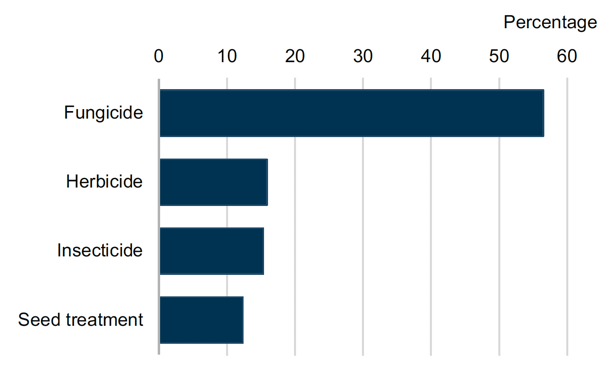
- The broad beans crop received on average 5.5 pesticide applications (supporting document Table 1). These applications included 4.2 fungicides, 3.0 insecticides and 1.3 herbicides (applied to 93, 39 and 93% of the crop area respectively)
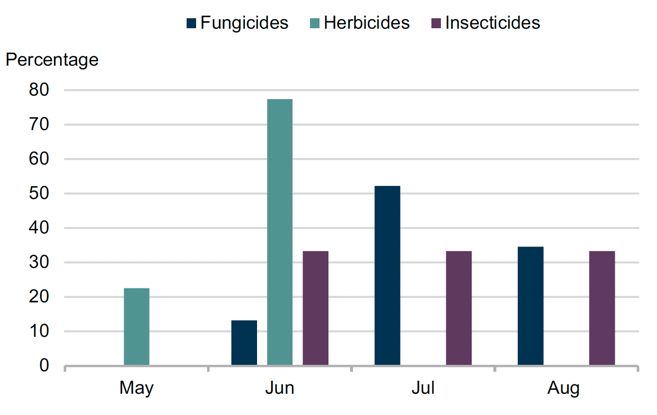
- The majority of herbicide applications took place in June. Fungicides were predominately applied in July and insecticides were applied throughout June, July and August (Figure 12)
- There were no reasons specified for pesticide use on broad beans
- The most common varieties encountered were Listra and Talia representing 80 and 19% of the sample respectively
| Pesticide group | Formulation area treated (ha) | Weight of pesticides applied (kg) | Percentage of crop treated (%) | Top 3 most used formulations (ha) |
|---|---|---|---|---|
| Fungicides | 11,847 | 4,347 | 93 | Cyprodinil/fludioxonil (4,095), Azoxystrobin (2,584), Boscalid/pyraclostrobin (2,584) |
| Herbicides | 3,337 | 3,045 | 93 | Imazamox/pendimethalin (2,584), Glyphosate (753) |
| Insecticides | 3,219 | 166 | 39 | Deltamethrin (1,073), Lambda-cyhalothrin (1,073), Pirimicarb (1,073) |
| Seed treatments | 2,584 | 33 | 93 | Fludioxonil (2,584) |
| All pesticides | 20,987 | 7,591 | 93 |
For details of all pesticide use on broad beans, please refer to the supporting document.
Brussels sprouts
- An estimated area of 1,024 hectares was grown in Scotland in 2023. This represents a 13% decrease since 2021
- All of the Brussels sprouts crop was grown from transplants
- All of the crop was treated with a pesticide
- Pesticide formulations were applied to 26,388 treated hectares with 5,235 kilograms of pesticide applied in total
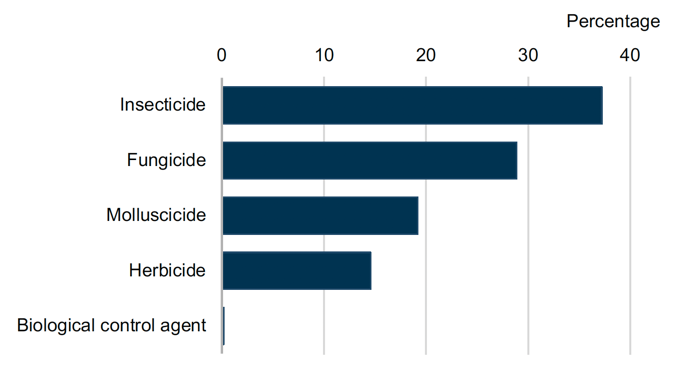
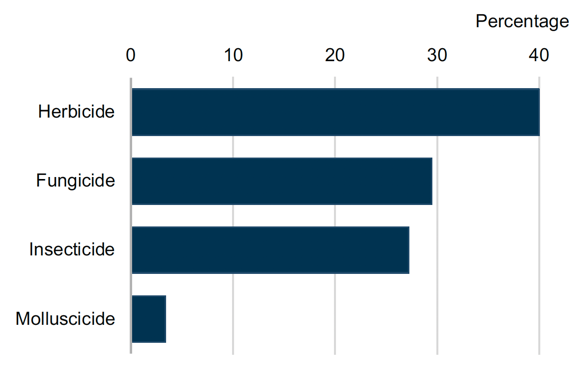
- The Brussels sprouts crop received on average 14.2 pesticide applications (supporting document Table 1). These applications included 4.9 molluscicides, 6.2 fungicides, 5.4 insecticides and 2.7 herbicides (each applied to 100% of the crop area)
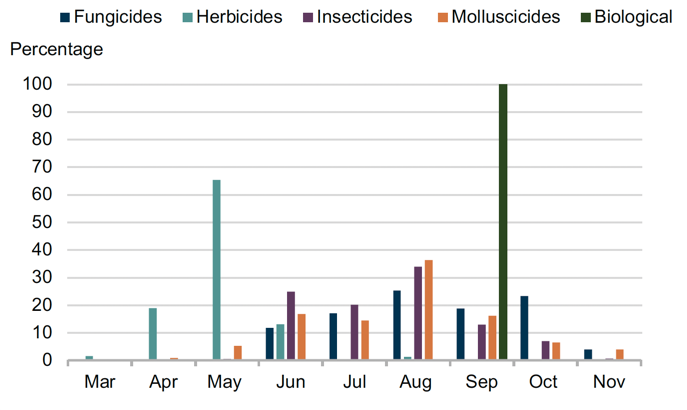
- Herbicides were predominately applied to Brussels sprouts in May. The majority of fungicides, insecticides and molluscicides were applied in August (Figure 14)
- Reasons for fungicide application were specified for 11% of total use; 7% for disease control and 4% for leaf spot. Aphids and caterpillars were the only reasons specified for insecticide applications (8% and 2% of total use respectively). General weed control was the only reason specified for herbicide applications (18% of total use)
- The most common varieties encountered were Petrus, Gladius and Albarus, accounting for 21, 15 and 12% of the sample area respectively
| Pesticide group | Formulation area treated (ha) | Weight of pesticides applied (kg) | Percentage of crop treated (%) | Top 3 most used formulations (ha) |
|---|---|---|---|---|
| Insecticides | 9,824 | 468 | 100 | Spirotetramat (1,847), Lambda-cyhalothrin (1,845), Indoxacarb (1,523) |
| Fungicides | 7,619 | 1,897 | 100 | Prothioconazole (2,287), Boscalid/pyraclostrobin (1,575), Tebuconazole/ trifloxystrobin (1,232) |
| Molluscicides | 5,056 | 523 | 100 | Ferric phosphate (5,056) |
| Herbicides | 3,840 | 2,347 | 100 | Clomazone (1,024), Metazachlor (1,024), Pendimethalin (849) |
| Biological control agent | 49 | [z] | 5 | Phasmarhabditis hermaphrodita (49) |
| All pesticides | 26,388 | 5,235 | 100 |
Some shorthand is used in this table: [z] = not applicable. For details of all pesticide use on Brussels sprouts, please refer to the supporting document.
Calabrese
- An estimated area of 1,500 hectares of calabrese were grown in Scotland in 2023, a 16% decrease since 2021
- All of the calabrese crop surveyed was grown from transplants
- 84% of the crop was treated with a pesticide
- Pesticide formulations were applied to 8,719 treated hectares with 4,726 kilograms of pesticide applied in total
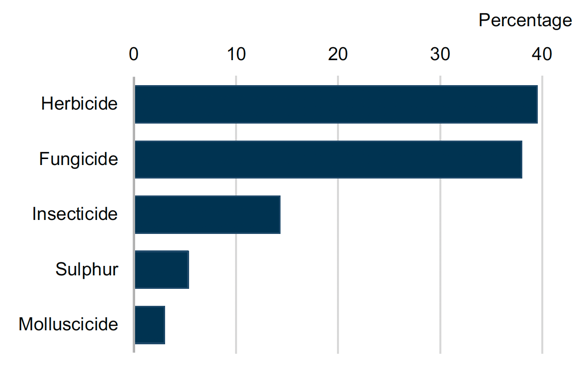
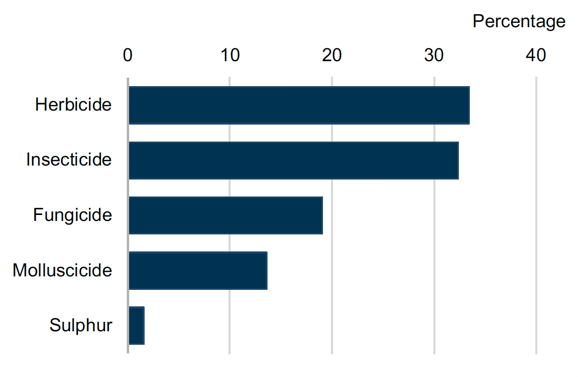
- Calabrese received on average 5.0 pesticide applications (supporting document Table 1). These included 2.7 fungicides, 2.1 herbicides, 1.0 insecticides and 1.0 molluscicide (applied to 81, 81, 54 and 17% of the crop area respectively)
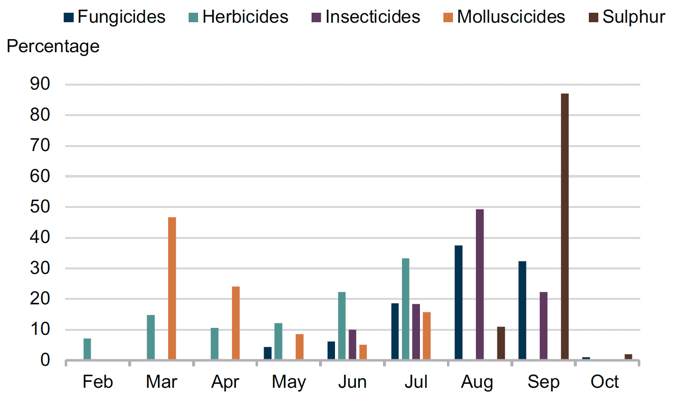
- The majority of herbicides were applied to calabrese in June and July. The majority of fungicides and insecticides were applied in August and September (Figure 16)
- Reasons were provided for 12% of total fungicide use, this included 8% for disease control and 4% for botrytis. Caterpillars was the only reason specified for insecticide applications (18% of total use). General weed control was the only specified reason for herbicide applications (24% of total use)
- The most common variety encountered was Parthenon, accounting for 51% of the sample area
| Pesticide group | Formulation area treated (ha) | Weight of pesticides applied (kg) | Percentage of crop treated (%) | Top 3 most used formulations (ha) |
|---|---|---|---|---|
| Herbicides | 3,442 | 2,992 | 81 | Metazachlor (1,217), Glyphosate (1,098), Pendimethalin (427) |
| Fungicides | 3,311 | 1,178 | 81 | Copper oxychloride (1,603), Mandipropamid (1,114), azoxystrobin (453) |
| Insecticides | 1,244 | 69 | 54 | Spirotetramat (428), Cyantraniliprole (424), Lambda-cyhalothrin (367) |
| Sulphur | 462 | 450 | 30 | [z] |
| Molluscicides | 261 | 36 | 17 | Ferric phosphate (261) |
| All pesticides | 8,719 | 4,726 | 84 |
Some shorthand is used in this table: [z] = not applicable. For details of all pesticide use on calabrese, please refer to the supporting document.
Other brassica crops
- Other brassica crops encountered in the 2023 survey were red, white, summer/autumn and winter cabbage as well as cauliflower, kale, kohlrabi, purple sprouting broccoli and savoys (some of which were recorded in the 'other vegetable' census category)
- The total estimated area of other brassica crops grown in Scotland was 1,044 hectares, this represents a 21% decrease from 2021
- 88% of other brassica crops were grown from transplants
- 84% of the other brassica crop was treated with a pesticide
- Pesticide formulations were applied to 6,682 treated hectares with 2,673 kilograms of pesticide applied in total
- The 84% of other brassica crops treated with a pesticide received on average 5.5 pesticide applications (supporting document Table 1). These applications included 2.3 insecticides, 2.2 herbicides and 1.8 fungicides (applied to 55, 80 and 69% of the crop area respectively) and 1.5 molluscicides (applied to 60% of the crop area)
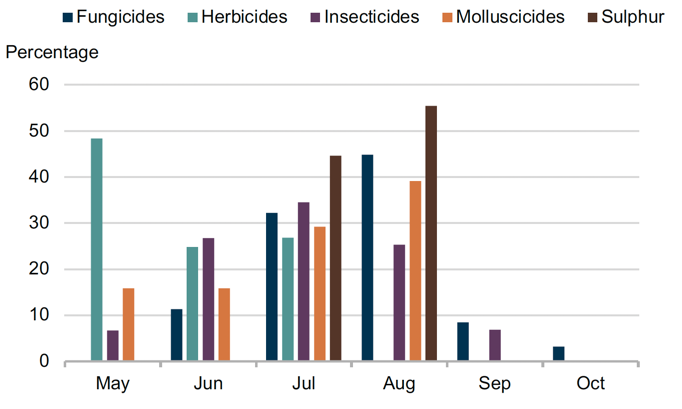
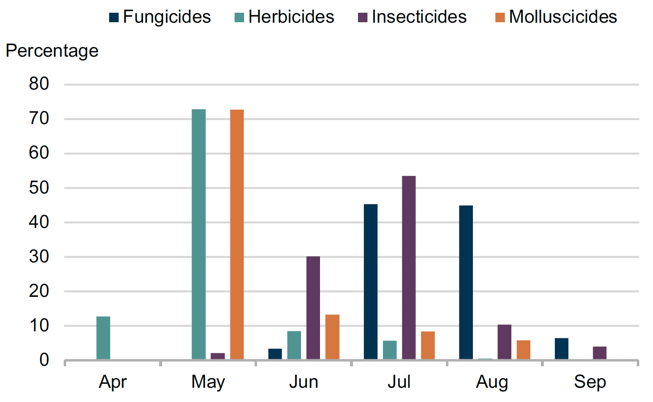
- The majority of herbicides were applied in May, insecticides in July and fungicides and molluscicides in August (Figure 18)
- Alternaria, disease control and sclerotinia were the only specified reasons reported for fungicide application (28%, 21% and 9% respectively). Reasons were specified for 56% of total herbicide use which were general weed control and annual broad-leaved weeds (37% and 19% respectively). Reasons were provided for 80% of insecticide use including caterpillars, aphids, diamond back moth and general pests (33, 20, 20 and 7% respectively)
| Pesticide group | Formulation area treated (ha) | Weight of pesticides applied (kg) | Percentage of crop treated (%) | Top 3 most used formulations (ha) |
|---|---|---|---|---|
| Herbicides | 2,234 | 1,986 | 80 | Metazachlor (835), Glyphosate (718), Clomazone (336) |
| Insecticides | 2,161 | 133 | 55 | Lambda-cyhalothrin (554) Spirotetramat (436) Deltamethrin (288) Indoxacarb (288) |
| Fungicides | 1,272 | 299 | 69 | Azoxystrobin (541), Mandipropamid (299), Azoxystrobin/difenoconazole (144), Boscalid/pyraclostrobin (144), Tebuconazole/trifloxystrobin (144) |
| Molluscicides | 910 | 90 | 60 | Ferric phosphate (910) |
| Sulphur | 104 | 166 | 3 | [z] |
| All pesticides | 6,682 | 2,673 | 84 |
Some shorthand is used in this table: [z] = not applicable. For details of all pesticide use on brassica crops, please refer to the supporting document.
Carrots
- An estimated 3,342 hectares of carrots was grown in Scotland in 2023, a 3% decrease since 2021
- 86% of the crop was treated with a pesticide. Pesticide formulations were applied to 61,406 treated hectares with 24,227 kilograms of pesticide applied in total
- The 86% of carrot crop treated with a pesticide received on average 11.4 applications (supporting document Table 1). These applications included 7.7 fungicides, 5.8 insecticides/nematicides, 3.6 herbicides and 1.0 molluscicides (applied to 81, 78, 85 and 9% of the crop area respectively)
- The majority of herbicides were applied in May and June. Fungicides and insecticides/nematicides were predominately applied in August and September (Figure 20)
- Reasons for fungicide applications were supplied for 20% of total use; 7% for Sclerotinia, 4% each for disease control and crown rot, 2% for disease precaution and 1% each for alternaria, black rot and cavity spot
- Reasons for insecticide applications were supplied for 16% of total use; 13% for carrot fly and 3% for aphids. No reasons were provided for the use of nematicides
- Reasons for herbicide applications were specified for 29% of total use; 17% for general weed control, 5% for annual broad-leaved weeds, 3% for annual grass weeds and 1% each for annual meadow grass, volunteer cereals, control cover crop and mayweed
- The most common variety encountered was Nairobi, accounting for 91% of the sample area surveyed
| Pesticide group | Formulation area treated (ha) | Weight of pesticides applied (kg) | Percentage of crop treated (%) | Top 3 most used formulations (ha) |
|---|---|---|---|---|
| Fungicides | 25,398 | 7,518 | 81 | Cyprodinil/fludioxonil (4,319), Prothioconazole (3,959), Isopyrazam (3,806) |
| Herbicides | 17,632 | 8,290 | 85 | Metribuzin (5,119), Aclonifen (3,246), Pendimethalin (2,536) |
| Insecticides/ nematicides | 15,426 | 8,373 | 78 | Lambda-cyhalothrin (10,589), Deltamethrin (1,115), Spirotetramat (1,036) |
| Seed treatments | 2,665 | 3 | 80 | Fludioxonil (2,665) |
| Molluscicides | 285 | 43 | 9 | Ferric phosphate (285) |
| All pesticides | 61,406 | 24,227 | 86 |
For details of all pesticide use on carrots, please refer to the supporting document.
Table F footnote: Fluopyram and garlic (applied to 387 and 889 treated hectares respectively) were the only active substances used as nematicides on carrots in 2023. In previous reports garlic was classified as a physical control.
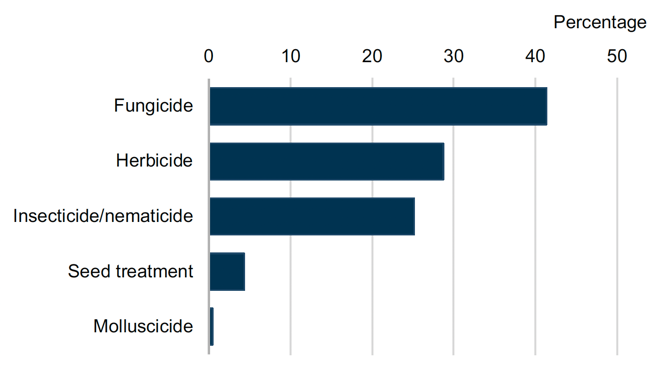
Figure 19 footnote: Garlic is included in insecticides/nematicides as it was applied as a nematicide on carrots. Note, garlic was recorded as a physical control agent in previous surveys.
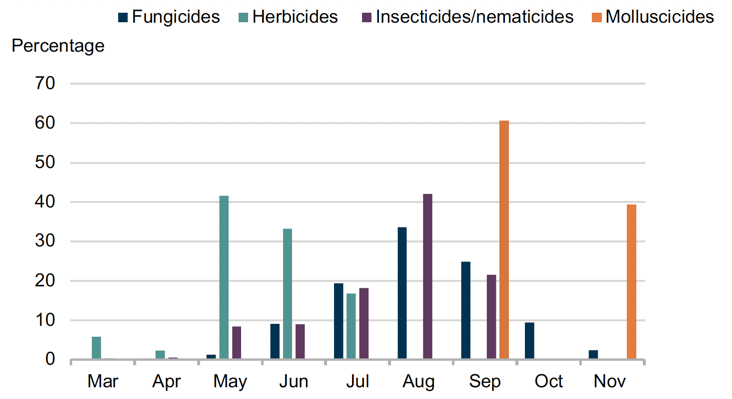
Figure 20 footnote: Garlic is included in insecticides/nematicides as it was applied as a nematicide on carrots. Note, garlic was recorded as a physical control agent in previous surveys. There were small amounts (< 1%) of herbicide application on carrots in February 2023 which are not shown on this figure.
Turnips and swedes
- The total estimated area of turnips and swedes grown in 2023 was 1,614 hectares, representing a 17% decrease from 2021
- 99% of the turnip and swede crop was treated with a pesticide
- Pesticide formulations were applied to 9,677 treated hectares with 2,195 kilograms of pesticide applied in total
- The turnip and swede crop received on average 4.0 pesticide applications (Table 1). These applications included 1.9 insecticides (applied to 84% of the crop area), 1.8 fungicides and 1.4 herbicide (applied to 89 and 99% of the crop area respectively) as well as one molluscicide (applied to 20% of the crop area)
- The majority of fungicides were applied in July and August. Herbicides and molluscicides were predominately applied in May, with the majority of insecticides applied in July (Figure 22)
- Mildew and phoma leaf spot were the only specified reasons for the use of fungicides (2% each). Reasons for herbicide applications were supplied for 20% of total use, including annual broad-leaved weeds, general weed control, grass weeds control and annual meadow grass (9%, 6%, 4% and 1% respectively). Cabbage stem flea beetle was the only reason supplied for insecticide use (31%)
- The most common variety encountered was Magres accounting for 81% of the sample area surveyed
| Pesticide group | Formulation area treated (ha) | Weight of pesticides applied (kg) | Percentage of crop treated (%) | Top 3 most used formulations (ha) |
|---|---|---|---|---|
| Herbicides | 3,869 | 1,427 | 99 | Metazachlor (1,433), Clomazone (1,407), Glyphosate (471) |
| Fungicides | 2,851 | 644 | 89 | Azoxystrobin (1,387), Prothioconazole (1,349), Boscalid/pyraclostrobin (115) |
| Insecticides | 2,632 | 66 | 84 | Deltamethrin (1,173), Lambda-cyhalothrin (841), Cyantraniliprole (259) |
| Molluscicides | 326 | 57 | 20 | Ferric phosphate (326) |
| All pesticides | 9,677 | 2,195 | 99 |
For details of all pesticide use on turnips and swedes, please refer to the supporting document.
Other vegetable crops
- Other vegetable crops encountered in the 2023 survey were leeks, celeriac, celery, fennel, parsley, radish, spring onions, squash, asparagus, beetroot, chard, courgette, garlic, parsnips, purslane, radicchio, spinach, onions, podded peas, lettuce and rhubarb
- The total estimated area of other vegetable crops was 823 hectares. No multi-cropping was encountered during the 2023 survey
- 13% of other vegetable crops were grown from transplants
- 23% of other vegetable crops were treated with a pesticide
- Pesticide formulations were applied to 1,987 treated hectares with 543 kilograms of pesticide applied in total
- The 23% of the other vegetable crop treated with a pesticide received on average 6.2 pesticide applications (supporting document Table 1). These applications included 5.3 herbicides, 4.6 fungicides (each applied to 14% of the crop area) and 2.0 molluscicides (applied to 9% of the crop araea)
- The majority of herbicides were applied in June and July, with fungicides applied predominately in September and October. Molluscicides were only applied in March and April (Figure 24)
- There were no reasons provided for pesticide use on other vegetable crops in the 2023 survey
| Pesticide group | Formulation area treated (ha) | Weight of pesticides applied (kg) | Percentage of crop treated (%) | Top 3 most used formulations (ha) |
|---|---|---|---|---|
| Herbicides | 1,119 | 344 | 14 | Aclonifen (252), Bentazone (210), Clethodim (18) |
| Fungicides | 719 | 177 | 14 | Prothioconazole (278), Azoxystrobin/difenoconazole (117), Boscalid/pyraclostrobin (99), Tebuconazole/trifloxystrobin (99) |
| Molluscicides | 149 | 22 | 9 | Ferric phosphate (149) |
| All pesticides | 1,987 | 543 | 23 |
For details of all pesticide use on other vegetable crops, please refer to the supporting document.
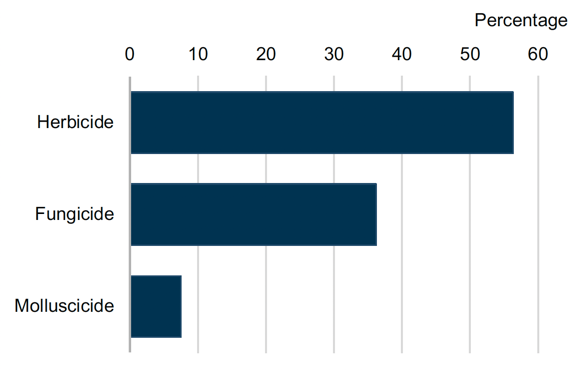
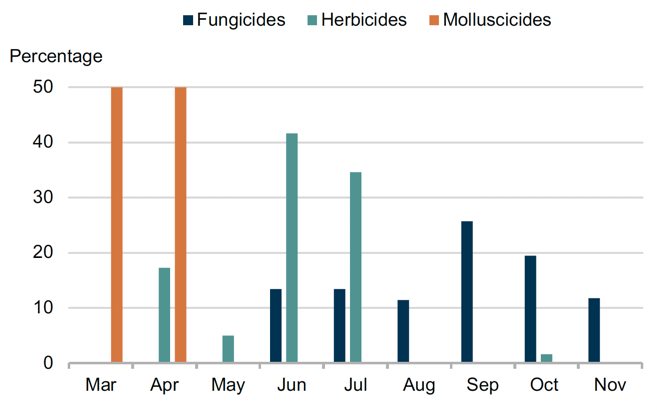
Figure 24 footnote: No pesticide applications were made to other vegetables in December 2023 or January 2024. Five per cent of fungicide applications were applied in February 2024 which are not shown on this figure.
Contact
Email: psu@sasa.gov.scot
There is a problem
Thanks for your feedback