Pesticide Usage in Scotland: Outdoor Vegetable Crops 2023
This publication presents information from a survey of pesticide use on outdoor vegetable crops in Scotland during 2023.
Integrated pest management
It is a requirement of the retained EU law Directive 2009/128/EC of the European Parliament and of the Council[10] (equivalent to the EU Sustainable use of Pesticides Directive 2009/128/EC) that member states should promote low pesticide input pest management, in particular Integrated Pest Management (IPM). The directive defines IPM as follows "'integrated pest management' means careful consideration of all available plant protection methods and subsequent integration of appropriate measures that discourage the development of populations of harmful organisms and keep the use of plant protection products and other forms of intervention to levels that are economically and ecologically justified and reduce or minimise risks to human health and the environment. 'Integrated pest management' emphasises the growth of a healthy crop with the least possible disruption to agro-ecosystems and encourages natural pest control mechanisms."
Information about the uptake of IPM measures by Scottish growers was collected alongside the 2023 vegetable crop pesticide usage survey. IPM data have previously been collected and published for all crop groups in our cycle of pesticide usage surveys (vegetable crops 2015 and 2019, protected edible crops 2015 and 2019, arable crops 2016 and 2020, soft fruit crops 2016 and 2020 and fodder crops 2017 and 2021). Our intention is to monitor IPM uptake in each crop sector every four years. This 2023 IPM survey represents the third in the series of surveys of IPM measures on vegetable crops, allowing the adoption of IPM techniques to be monitored. These datasets will be used as an indicator of the success of Scottish Government funded IPM research, knowledge transfer and promotion activities.
Unlike the other statistics in this report, the figures reported in this section are not raised to produce national estimates but represent only the responses of those surveyed. The IPM sample, whilst smaller than that sampled for the pesticide usage survey, provides a good representation of Scottish regions and farm size groups.
Pearson chi-square tests were used to assess statistical evidence for changes, with permutation tests used when expected values were five or less. When comparing between 2019 and 2023, and 2015 and 2023, any evidence of a statistical change in the proportion of growers reporting under a category is indicated by a p-value. Any other notable differences that might indicate a direction of travel are also recorded in the text. If no comparison is made, then the responses recorded are similar between 2019 and 2023 or 2015 and 2023.
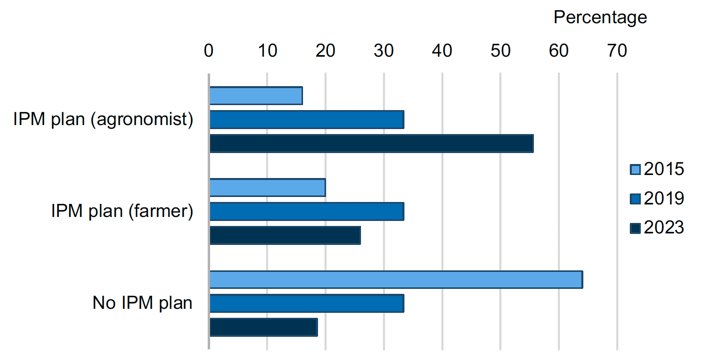
In total IPM data was collected from 27 growers and grower groups, collectively growing 1,929 ha of crops. This sample represented 9% of Scotland's 2023 outdoor vegetable crop area. Of these growers, 81% had an IPM plan. Twenty six per cent completed their own IPM plan, 56% had a plan completed by or alongside their agronomist and 19% did not have an IPM plan (Figure 26). There was strong evidence for an increase in the proportion of growers reporting they had completed an IPM plan from 2015 to 2023 (p-value = 0.003), representing a 125% increase in the use of plans from 2015 but there was no statistical evidence of change from 2019 to 2023, (81% in 2023 compared to 67% in 2019 and 36% in 2015).
There was no statistical evidence that the proportion of growers who completed their plan through an agronomist changed across the 2015 to 2023 survey period (56% in 2023, 33% in 2019 and 16% in 2015). Using an IPM plan helps growers to make the best possible, and most sustainable, use of all available methods for pest control. Since the 2015 survey, the requirement to complete an IPM plan has been added to some farm assurance schemes; for example, farmers certified with Red Tractor are required to complete the NFU/VI IPM plan [13]. Farmers certified with Scottish Quality Crops (SQC) must complete an IPM plan, a biodiversity plan and a soil testing plan [14].
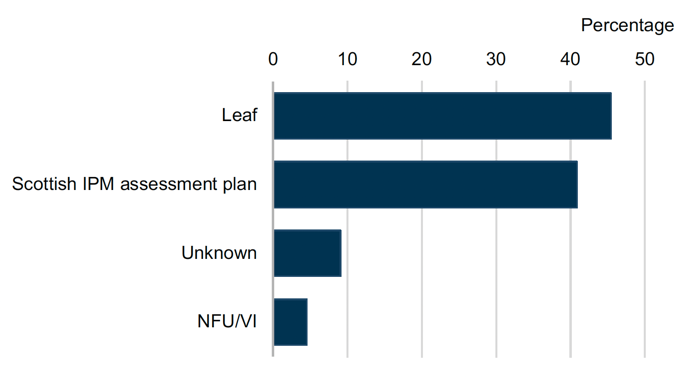
Of those 22 growers or grower groups who had an IPM plan in 2023, either completed themselves or by their agronomist, 45% used the LEAF plan, 41% used the Scottish IPM assessment plan, 9% were unsure of the type of plan used and 5% used the NFU/VI plan (Figure 27).
Farmers were asked about their IPM activities in relation to three categories; risk management, pest monitoring and pest control. Information was collected about all activities each grower conducted in relation to these categories and the responses are reported in the following sections. The term 'pest' is used throughout to denote diseases, weeds and invertebrate pests.
Risk management
IPM programs aim to prevent or reduce the risk of pests becoming a threat by minimising the likelihood of damage occurring that will require subsequent control. Table I presents an overview of the risk management measures adopted by those growers surveyed in 2023, 2019 and 2015.
In 2023, 2019 and 2015, all growers sampled reported that they implemented at least one IPM risk management activity. There was no statistical evidence of change in the proportion of growers reporting the implementation of risk management activities between the three survey years.
There was no evidence for statistical change in any of the risk management activities across the 2015 to 2023 survey period. There was a decrease in the proportion of growers reporting the use of catch and cover cropping across the three year survey period (30% in 2023 compared to 44% in 2019 and 36% in 2015). There was an increase in the proportion of growers using cultivation at sowing to reduce pest risk (70% in 2023 compared to 56% in 2019 and 52% in 2015). Similarly the number of growers using cultivation of the seed bed to reduce pest risk increased to 96% in 2023 from 81% in 2019 and 76% in 2015 (Table I).
| Risk management activity | Percentage yes responses 2023 | Percentage yes responses 2019 | Percentage yes responses 2015 | Percentage change 2019 to 2023 | Percentage change 2015 to 2023 |
|---|---|---|---|---|---|
| Crop rotation | 100 | 96 | 96 | 4 | 4 |
| Soil testing | 100 | 96 | 88 | 4 | 14 |
| Cultivation of seed bed to reduce pest risk | 96 | 81 | 76 | 19 | 27 |
| Cultivation at sowing to reduce pest risk | 70 | 56 | 52 | 26 | 35 |
| Varietal or seed choice to reduce pest risk | 85 | 89 | 88 | -4 | -3 |
| Catch and cover cropping | 30 | 44 | 36 | -33 | -18 |
| Hygiene measures | 96 | [x] | [x] | [z] | [z] |
| Protection or enhancement of beneficial organism populations | 85 | 81 | 72 | 5 | 18 |
| Any risk management activity | 100 | 100 | 100 | 0 | 0 |
Table I footnote: Some shorthand is used in this table: [x]= not available [z] = not applicable. For statistical evidence and p-values see Table 23 in the supporting document. There was no evidence for statistical change across any of the above risk management categories from 2019 to 2023 or 2015 to 2023.
There was no statistical evidence of change in the proportion of growers implementing crop rotation to reduce risk of pest damage (100% in 2023 and 96% in both 2019 and 2015). Crop rotation breaks the link between pathogen and host, reducing pest population build-up. It can also improve soil fertility and structure by alternating deep-rooted and shallow-rooted crops, and consequently crop vigour. In addition, crop rotation allows alternative pesticides to be used to combat problem pests as different pesticides are approved for different crops.
Across the 2015 to 2023 survey period, there was no statistical evidence of change in the proportion of growers testing their soil in order to tailor inputs to improve crop performance (100% in 2023, 96% in 2019 and 88% in 2015). Soil testing allows growers to make informed decisions about the inputs required and optimal crop choice for their land to ensure crops are healthy and less susceptible to pest pressure. Most soil testing encountered in 2023 was for pH or lime (100% in 2023, 89% in 2019 and 8% in 2015) (Figure 28).
The proportion of growers testing for soil nutrients increased across the three year 2015 to 2023 survey period (89% in 2023, 74% in 2019 and 84% in 2019). Testing soil for disease declined over the survey period from 2015 to 2023 (33% in 2023, 41% in 2019 and 60% in 2015). In 2023 the main disease testing specified was for club root. Other soil tests used can be seen in Figure 28.
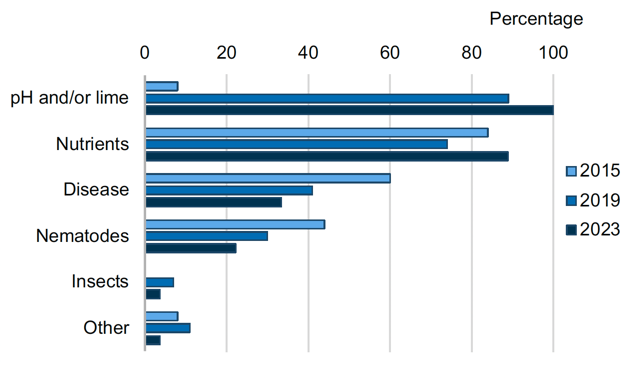
Figure 28 footnote: In 2015 growers were not directly questioned about testing for insects, pH or lime. However, pH testing was recorded under other in 2015 and therefore, this data may be underestimated. Other in 2019 included soil health tests, organic matter assessments and electrical conductivity tests. Other in 2015 included texture and electrical conductivity tests. Other in 2023 included testing for soil bacteria.
The majority of growers reported that they managed their seed bed agronomy to improve crop performance and reduce pest risk (96% in 2023, 81% in 2019 and 76% in 2015). Although, there was no evidence of statistical change in the proportion of growers reporting under this category across the 2015 to 2023 survey period. Consistently over half of all growers reported increasing soil organic matter across the 2015 to 2023 survey period (56% in 2023, 59% in 2019 and 52% in 2015). In 2023 this included the use of straw and seaweed mulches. There was a decrease in the use of stale seed beds which can allow for more effective weed control (41% in 2023, 52% in 2019 and 44% in 2015). Growers considering pest management when planning irrigation and drainage also decreased in 2023 compared to 2019, but increased over the longer term since 2015 (22% in 2023, 30% in 2019 and 8% in 2015). Considering pest management when planning irrigation and drainage can be beneficial as it can help avoid the extremes of dry and water logged soils which may induce stress and encourage pest and pathogen build-up.
Growers were asked directly about the use of non inversion techniques for the first time in 2023. Techniques such as direct drilling, minimum tillage and rotational ploughing were recorded in the "other" category in 2019 so are therefore likely to be underestimated. This was also the case for considering pest management when planning crop nutrition. The use of non-inversion preserves moisture, retains organic matter and reduces compaction and erosion. There is also evidence that it increases populations of earth worms and beneficial insects such as predatory ground beetles. Considering pest management when planning crop nutrition can also improve the seed bed and ensure that soil fertility and pH is optimised for the crop. All seed bed cultivation methods are presented in Figure 29.
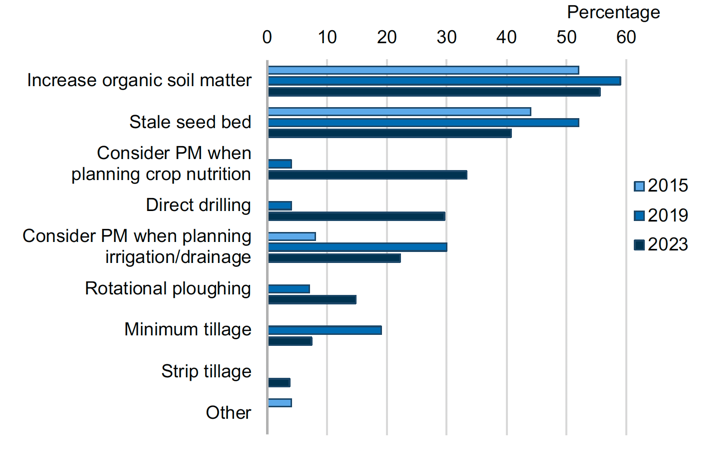
Figure 29 footnote: In 2019 and 2015 growers were not directly asked about direct drilling, minimum tillage, rotational ploughing, strip tillage or considering pest management when planning crop nutrition. Any responses to these questions in 2019 were recorded under the other category and are therefore likely to be underestimated. PM = Pest management.
There was no evidence of statistical change in the proportion of growers using cultivations at sowing to reduce pest risk across the 2015 to 2023 survey period (70% in 2023, 56% in 2019 and 52% in 2015), Figure 30. Forty one per cent of growers in 2023 varied the sowing rate or density compared to 22% in 2019 and 24% in 2015. Increasing plant density/sowing rate can mitigate against pest damage or competition, producing more competitive crops that can shade out pest plants and also allow for the crop to withstand higher levels of grazing from pests. Alternatively reducing sowing rate can improve individual crop growth.
There was an increase in the proportion of growers that used pest free growing media, including the use of pre-treated modules across the 2015 to 2023 survey period (22% in 2023,15% in 2019 and 8% in 2015). The proportion of growers that varied the sowing date in 2023 remained the same as in 2019 and slightly decreased from 2015 (30% in 2023 and 2019 and 36% in 2015). Sowing dates are often manipulated to avoid key pest timings, although the ability to do so is influenced by seasonal factors. One other method noted by a single holding involved planting a red leaved lettuce variety around the green leaved variety to protect from slug damage, due to slugs avoiding the red leaved varieties.
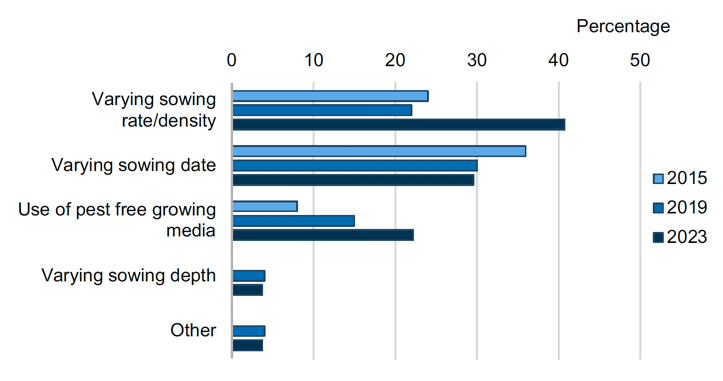
Figure 30 footnote: Varying sowing depth was not asked in 2015 surveys. In 2019 and 2023, the use of pest free growing media included the use of pre-treated modules. Other in 2023 included planting red leaved lettuce varieties around the green to protect them from slugs, due to slugs avoiding the red leaved varieties. Other in 2019 included different spatial arrangements to facilitate more effective weeding.
The majority of growers considered risk management when selecting seeds and/or varieties, although there was no evidence of statistical change for the proportion of growers considering this across the 2015 to 2023 survey period (85% in 2023, 89% in 2019 and 88% in 2015). Over the three year period from 2015 to 2023, the largest change reported was for the number of growers choosing to use certified seed (56% in 2023, 52% in 2019 and 8% in 2015). The proportion of respondents using variety diversification (33% in 2023) or who used seed treatments (41% in 2023) increased over the longer term from 2015 but decreased from 2019 to 2023. Growers implementing variety diversification (33% in 2023) and the use of seed treatments (41% in 2023) had an increase over the longer term from 2015 but a decrease from 2019 to 2023. The proportion of growers that used resistant varieties such as virus/disease/frost/drought resistant crops had a consistent decline from 2015 to 2023 (44% in 2023, 56% in 2019 and 60% in 2015). It was noted that some growers had a customer focused decision on the seed/variety choice used. One grower group also noted they had considered the use of drought resistant varieties but had not yet implemented the use. All variety and seed choice methods used can be seen in Figure 31.
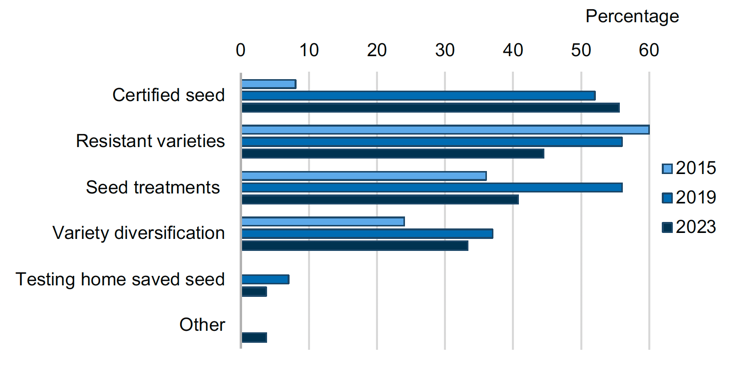
Figure 31 footnote: Other in 2023 included the use of F1 varieties due to increased vigour.
There was no statistical evidence of change in the proportion of positive responses to using catch and cover crops across the 2015 to 2023 survey period (30% in 2023, 44% in 2019 and 36% in 2015). The proportion of growers that used catch and cover crops to manage soil pests by biofumigation, had the largest increase over the 2015 to 2023 survey period of all catch and cover cropping uses (15% in 2023 and 4% in 2019 and 2015). There was an increase in the use of catch and cover crops to directly manage soil pests across the 2015 to 2023 survey period (15% in 2023, 7% in 2019 and 8% in 2015). In 2023 it was noted that out of the 15% of growers that used catch and cover crops to manage soil pests directly, 4% of growers managed soil for disease and insects and 11% for nematodes. Cover crops were also used for weed control and to improve soil quality (4% and 19% in 2023 respectively) although the use for these puposes decreased over the survey period. The use of cover crops to attract natural predators was lower in 2023 than in 2019 and higher over the longer term (7% in 2023, 11% in 2019 and 4% in 2015). In 2023 growers used a variety of catch and cover crops. The most common catch/cover crops used were mustard and radish with other notable crops including clover, phacelia, buckwheat, field beans, vetch, sunflowers and wildflower mixes. All catch/cover crops methods are presented in Figure 32.
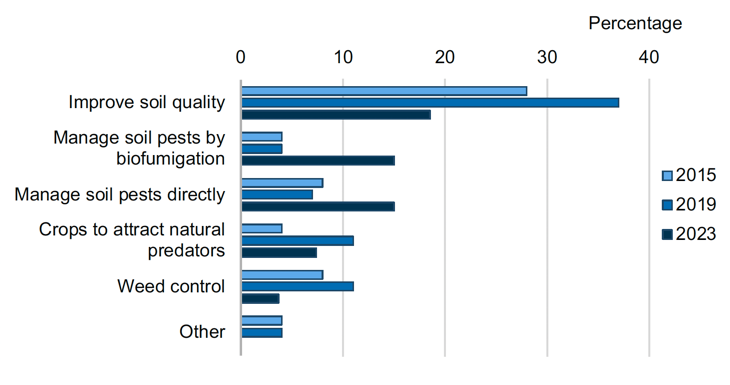
Figure 32 footnote: Other in 2015 and 2019 included the use of catch and cover crops for the prevention of soil erosion.
The majority of growers stated that they adopted techniques to protect or enhance beneficial organism populations, although there was no evidence for statistical change across the 2015 to 2023 survey period (85% in 2023, 81% in 2019 and 72% in 2015). In 2023, the percentage of growers responding positively to questions on protecting or enhancing beneficial organism populations increased or remained unchanged from 2015 and 2019, with the exception of the other category. In 2023 the other category included the use of game cover and avoiding the use of pyrethroid sprays to maintain parasitic wasp and predatory insect populations (Figure 33).
The use of wildflower strips increased over the 2015 to 2023 survey period (59% in 2023, 15% in 2019 and 32% in 2015). The use of habitat mosaics increased across the 2015 to 2023 survey period (44% in 2023, 37% in 2019 and 8% in 2015). In 2023 respondents were asked further information on their use of habitat mosaics. Thirty per cent maintained habitat mosaics by planting and maintaining hedges, 19% by planting and maintaining woodland and 15% by wetland restoration and management.
In 2023 there was no change in the percentage of growers that had uncultivated areas since the previous survey in 2019 but had increased by 35% over the longer term since 2015 (70% in 2023 and 2019 and 52% in 2015). Fifteen per cent of growers took part in an agri-environment scheme, similar to previous years. The Scottish Government agri-environment climate scheme (AECS) was the only scheme specified in 2023. In 2023, 81% of respondents were members of LEAF which promotes integrated farm management and 52% of respondents were members of other quality assurance schemes such as Red Tractor, Assured Produce, SQC and M&S 'Field to Fork'. Eleven per cent of respondents also stated they were part of a supply chain initiative which promotes biobiversity.
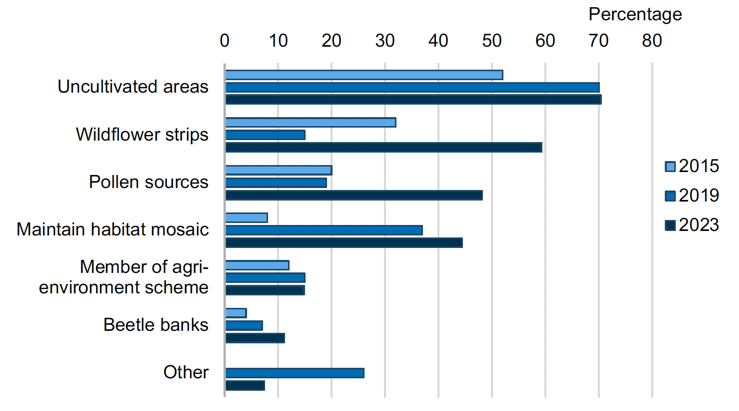
Figure 33 footnote: In 2023 additional actions noted as other included planting game mixes and avoiding using pyrethroid sprays. Other in 2019 included planting wild bird seed, leaving wood piles, selecting pesticides to reduce their effects on beneficial organisms, planting species rich grassland and margin mixtures.
For the first time in 2023, growers were asked about hygiene measures to reduce pest risk. Ninety six per cent of respondents reported they cleaned machinery between fields to reduce the risk of spreading pests, one respondent also noted they removed infected material.
Pest monitoring
In IPM, pests are monitored both to determine whether control is economically justified and to effectively target control options. IPM programmes aim to monitor and identify pests, so that appropriate control decisions can be made in conjunction with action thresholds. Table J presents an overview of the pest monitoring measures adopted by those growers surveyed in 2015, 2019 and 2023.
In 2023, there was no evidence of statistical change in the proportion of growers conducting pest monitoring activity with all respondents reporting they implemented at least one measure associated with an IPM pest monitoring approach across the 2015 to 2023 survey period.
| Pest monitoring activity | Percentage yes responses 2023 | Percentage yes responses 2019 | Percentage yes responses 2015 | Percentage change 2019 to 2023 | Percentage change 2015 to 2023 |
|---|---|---|---|---|---|
| Monitor and identify pests | 100 | 96 | 96 | 4 | 4 |
| Regular monitoring of crop growth stage | 96 | 96 | 96 | 0 | 0 |
| Setting action thresholds for crops | 81 | 89 | 88 | -8 | -7 |
| Use of specialist diagnostics | 70 | 59 | 60 | 19 | 17 |
| Any pest monitoring activity | 100 | 96 | 96 | 4 | 4 |
Table J footnote: For statisital evidence and p-values see Table 24 in the supporting document. There was no evidence of statistical change across any of the above pest monitoring activities from 2019 to 2023 or 2015 to 2023.
All growers reported that they regularly monitored and identified pests in 2023, similar to that reported in 2019 and 2015 (96%). The proportion of growers using a BASIS qualified agronomost was similar across the 2015 to 2023 survey period (89% in 2023, 85% in 2019 and 84% in 2015). The proportion of respondents self-inspecting crops remained similar between 2023 and 2019 (63% and 67% respectively) but increased between 2023 and 2015 (63 and 28% respectively).
The use of risk warnings decreased slightly when compared to 2019 but increased overall compared to 2015 (44% in 2023, 48% in 2019 and 16% in 2015). In 2023 some growers used risk warnings for aphids and carrot flies and set action thresholds for free living nematodes and aphids. The proportion of growers that used trapping to monitor and identify pests decreased across the 2015-2023 survey period (26% in 2023, 44% in 2019 and 40% in 2015). Other monitoring and identifying pest activities can be seen in Figure 34.
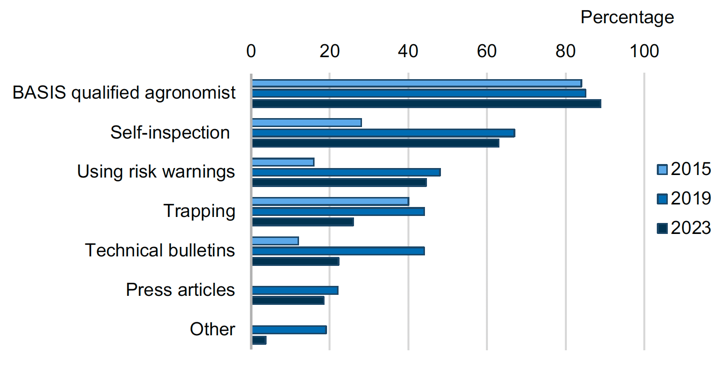
Figure 34 footnote: Other in 2023 included looking at psyllids (carrot and potato) as part of a research project. Other in 2019 included weather data and local information from other farmers and growers.
The proportion of growers regularly monitoring crop growth stage was unchanged across the 2015 to 2023 survey period (96%). Most growers also used action thresholds when monitoring pest populations (81% in 2023, 89% in 2019 and 88% in 2015).
There was no evidence for a statistical change in the use of specialist diagnostics to monitor and identify pests across the 2015 to 2023 survey period (70% in 2023, 59% in 2019 and 60% in 2015). There was a decrease in all methods of specialist diagnostics across the 2015 to 2023 survey period. Although, there was a slight increase in tissue testing for nutritional deficiencies in 2023 compared to 2019 but this was still lower than levels recorded in 2015 (44% in 2023, 41% in 2019 and 52% in 2015). Use of clinic services to identify unknown pests had the largest decline (7% in 2023, 19% in 2019 and 24% in 2015). The use of field and pest mapping also decreased across the 2015 to 2023 survey period (33% in 2023, 44% in both 2019 and 2015). All use of specialist diagnostic methods can be seen in Figure 35.
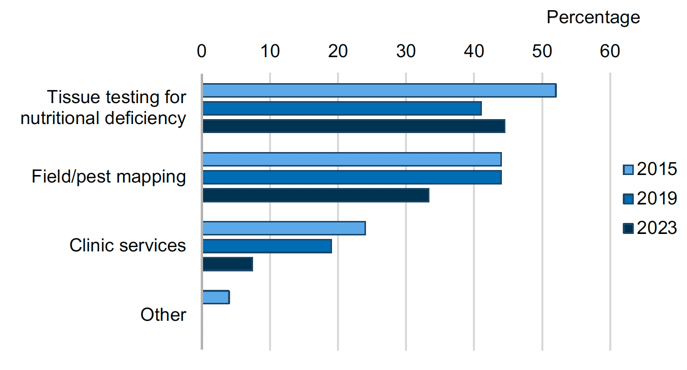
Figure 35 footnote: Other in 2015 included testing for chlorophyll levels.
Pest control
If monitoring, identification, and action thresholds indicate that pest control is required, and preventive methods are no longer effective or available, IPM programs evaluate the best control method in relation to effectiveness and risk. Control programmes incorporate non-chemical methods alongside, or instead of, chemical control. Use of chemical pest control should be as targeted as possible and the risk of resistance development should be minimised. The effectiveness of the control programme should be reviewed regularly to gauge success and improve their regime as necessary. Table K presents an overview of the pest control measures adopted by the growers surveyed across the 2015 to 2023 survey period.
In 2023, there was no evidence of statistical change in the proportion of growers conducting pest control with all respondents reporting they implemented at least one measure associated with an IPM pest control approach across the 2015 to 2023 survey period. There was no evidence for a statistical change in the proportion of growers using non-chemical control, targeted pesticide applications, following anti-resistance strategies, or monitoring success of crop protection measures across the 2015 to 2023 survey period (Table 25). Of the holdings sampled in 2023, 11% were organic, similar to the 12% in 2015. However this was a decrease from the 19% that were organic in 2019 that also had an additional 4% of holdings which were not organic but did not use pesticides that season.
| Pest control activity | Percentage yes responses 2023 | Percentage yes responses 2019 | Percentage yes responses 2015 | Percentage change 2019 to 2023 | Percentage change 2015 to 2023 |
|---|---|---|---|---|---|
| Non-chemical control used in partnership or instead of chemical control | 81 | 81 | 76 | 0 | 7 |
| Targeted pesticide application | 85 | 70 | 76 | 21 | 12 |
| Follow anti-resistance strategies | 70 | 74 | 80 | -5 | -12 |
| Monitor success of crop protection measures | 96 | 93 | 100 | 4 | -4 |
| Any pest control activity | 100 | 96 | 100 | 4 | 0 |
Table K footnote: For statisital evidence and p-values see Table 25 in the supporting document. There was no evidence of statistical change across any of the above pest control activities from 2019 to 2023 or 2015 to 2023.
Although there was no evidence of statistical change in the overall proportion of growers who reported they used non-chemical control in partnership or instead of chemical control over the 2015 to 2023 survey period, there was a decrease in the use of all non-chemical control methods when compared to 2015. The only exception was mechanical weeding. Mechanical weeding remains a principal non-chemical method of control used by growers, and although use was slightly lower in 2023 than in 2019, it remained higher than in 2015 (41% in 2023, 44% in 2019 and 36% 2015). Respondents were also asked about the use of manual weeding/hand rogueing for the first time in 2023, with 41% using this control method.
A range of physical control methods which prevent pest access to the crop were also used. The percentage of respondents using netting fluctuated across the 2015 to 2023 survey period (41% in 2023, 26% in 2019 and 48% in 2015) and may in part be influenced by crop compostion. Trapping for pest control remained low over the 2015 to 2023 survey period and no growers reported using mulches in 2023 (compared to 11% in the previous survey and 4% in 2015). The use of biocontrol and biopesticides were lower in 2023 than the other surveys (4% in 2023, 15% in 2019 and 8% in 2015). The reason for this decrease is unclear. Other non-chemical control methods used can be seen in Figure 36.
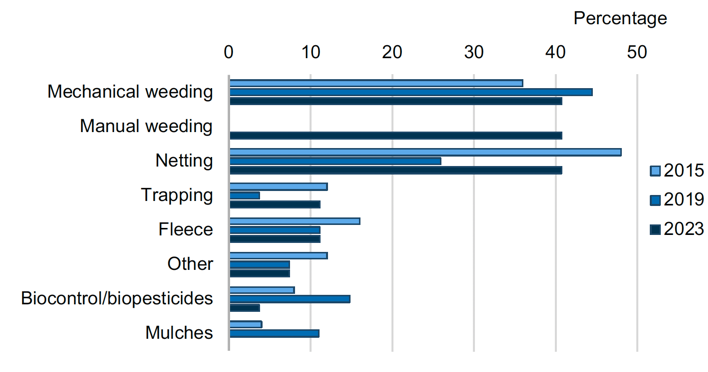
Figure 36 footnote: Other in 2023 included flame weeding. Other in 2019 included using plant elicitors to encourage natural defences and garlic to protect carrot crops from carrot fly. Other in 2015 included using garlic to protect swede from flea beetle and salt water and vinegar for slugs.
There was no statistical evidence of change for the proportion of growers using targeted pesticide applications to control pests across the 2015 to 2023 survey period (85% in 2023, 70% in 2019 and 76% in 2015). Despite this there was an increase in the number of growers who reported use of drift reduction apparatus (67% in 2023, 44% in 2019 and 20% in 2015). The use of spot treatments has seen a consistent increase across the 2015 to 2023 survey period (37% in 2023, 26% in 2019 and 20% in 2015). In contrast the use of precision application methods was lower in 2023 than reported in the previous surveys (19% in 2023, 33% in 2021 and 32% in 2015). Other targeted pesticide application changes can be seen in Figure 37.
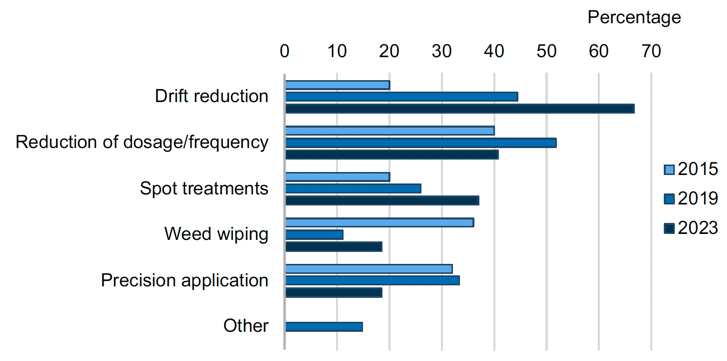
Figure 37 footnote: Other in 2019 included regular calibration and maintenance of sprayers and technical updates on product efficacy.
There was no statistical evidence for change in the proportion of growers following anti-resistance strategies across the 2015 to 2023 survey period (70% in 2023, 74% in 2019 and 80% in 2015). Despite this the use of all individual anti-resistance methods increased in use across the 2015 to 2023 survey period. The largest increase was in the use of multi-site pesticides (59% in 2023, 41% in 2019 and 28% in 2015). There were smaller increases in the other anti-resistance strategies used including minimising the number of applications and use of multiple modes of action (Figure 38).
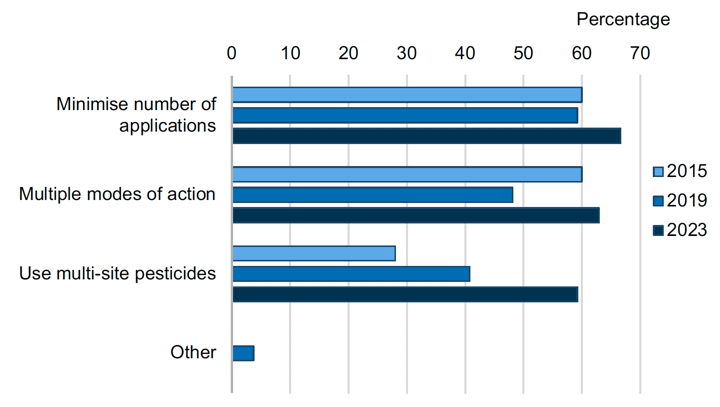
Figure 38 footnote: Other in 2019 included the agronomist selecting the best anti-resistance option.
An important aspect of IPM is monitoring the success of risk management and crop protection practices to continually improve regimes. There was no statistical evidence of change in the proportion of growers who reported they monitored the success of crop protection measures across the 2015 to 2023 survey period (96% in 2023, 93% in 2019 and 100% in 2015). For individual monitoring and identifying pest methods, the largest increase across the 2015 to 2023 survey period was in the number of growers that investigated causes of poor efficacy (70% in 2023, 22% in 2019 and 24% in 2015). The number of growers conducting a seasonal review of practices also increased (56% in 2023, 30% in 2019 and 32% in 2015) (Figure 39). The other notable change was the decrease in the percentage of growers who reported they used trapping to monitor success of crop protection practices (7% in 2023, 15% in 2019 and 16% in 2015). Other methods used to monitor success of crop protection measures can be seen in Figure 39.
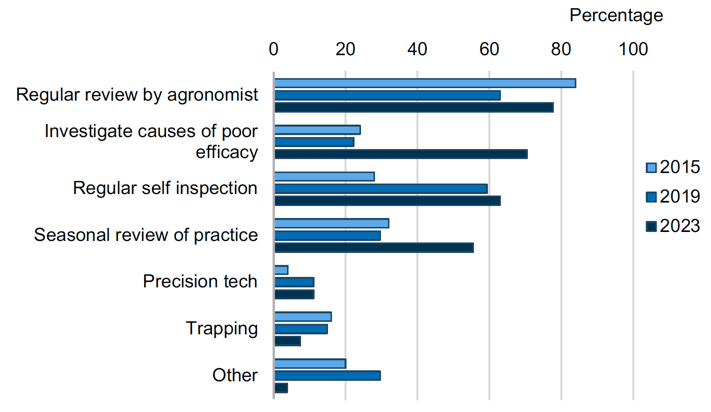
Figure 39 footnote: In 2023 other included root checking for cavity spot. Other methods recorded for monitoring success in 2019 included monitoring crop yields (trialling different methods of control, feedback from the customer and monitoring residue levels within the crops). Other methods recorded in 2015 included feedback from processors and packers.
Contact
Email: psu@sasa.gov.scot
There is a problem
Thanks for your feedback