Pesticide usage in Scotland: rodenticide use by local authorities 2015
This report presents the results of a survey of rodenticide use by local authorities in domestic, industrial and agricultural settings in Scotland during 2015.
Appendix 5 - Survey methodology
Sampling and data collection
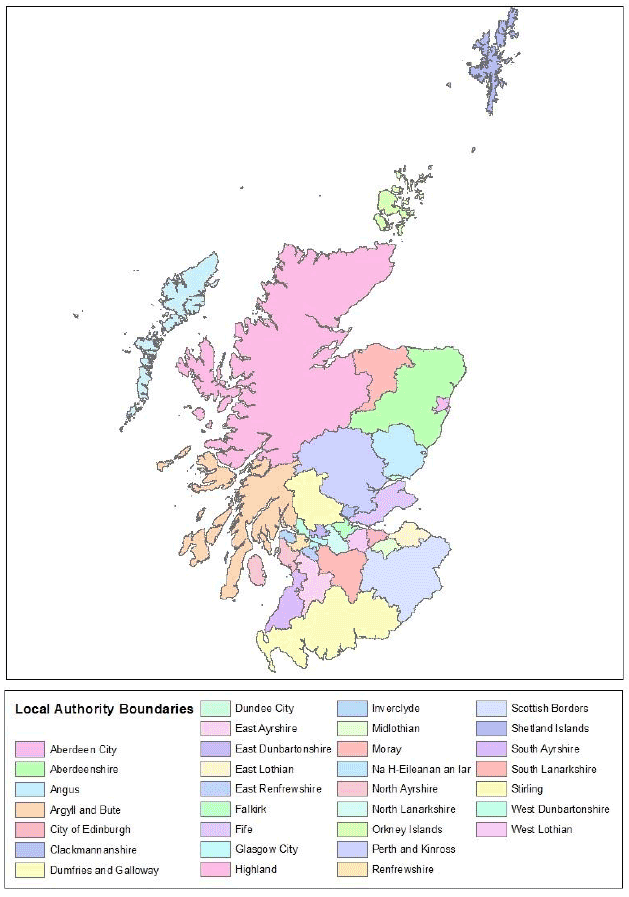
There are 32 local authorities in Scotland ( Table 5, Figure 9). Each LA was sent a postal survey designed to collect information about their use of rodenticides in 2015 in relation to season, setting and target of use. The survey also included questions about compliance with best practice in relation to rodenticide use, use of non-chemical control methods and experience of rodenticide resistance.
An initial introductory letter and survey forms were sent to each LA. These were followed by a reminder letter, two months after survey initiation, if data had not been received. In some cases follow up phone calls were required for data clarification.
Both the agricultural rodenticide surveys (1)(2) , and the UK local authority survey conducted by CSL in 2001 (3) estimated total rodenticide use statistically based on the sample data collected. The agricultural reports are based on data from a random stratified sample of agricultural holdings and total agricultural use is estimated by ratio raising (comparing data from the sample of farms with the total population within each stratum reported in the June agricultural census). The UK local authority report estimated total rodenticide use based on human population, stating that there was a strong correlation between rodenticide usage and human population in authority area. Data were raised within counties/metropolitan districts by a factor accounting for the human population represented by nil returns, to give an estimate of national rodenticide use. The UK survey received returns from 51 per cent of LAs, accounting for 53 per cent of the UK population.
In contrast, in this report the data have been collated and presented as a sample rather than using ratio raising to produce a statistical estimate of total use. It had originally been the intention to use the same raising method as implemented in the 2001 UK survey. However, when the data were analysed it was clear that, in this sample, there was not a correlation between human population or population density with rodenticide use, either in relation to Scotland as a whole or within geographical regions. This was discussed with a BIOSS statistician and the decision was taken that the most appropriate action to avoid mis-estimation, was to present the data as a sample. As the sample covers 78 per cent of LAs and 81 per cent of the Scottish population it is considered to provide a robust overview of how rodenticides are used by Scottish LAs.
Data quality assurance
The dataset underwent several validation processes as follows; (i) checking for any obvious errors upon data receipt (ii) checking and identifying inconsistencies with use and approval conditions once entered into the database (iii) 100 per cent checking of data held in the database against the raw data. Where inconsistencies were found these were checked against the records and with the LA if necessary. Additional quality assurance is provided by sending reports for independent review. In addition, the Scottish pesticide survey unit is accredited to ISO 9001:2008. All survey related processes are documented in Standard Operating Procedures ( SOPs) and our output is audited against these SOPs by internal auditors annually and by external auditors every three years.
Main sources of bias
These surveys may be subject to measurement bias as they are reliant on respondents recording data accurately. As this survey is not compulsory it may also be subject to non-response bias, as some LAs could be more likely to respond to the survey than others.
Figure 9 Scottish local authority boundaries

Contact
There is a problem
Thanks for your feedback