Planning Performance Statistics 2020/21: Annual
Summary statistics on planning application decision-making timescales for 2020/21 with historic data going back to 2012/13. It is based on data collected by the Scottish Government from Local and Planning Authorities as part of the Planning Performance Framework (introduced in 2012).
Key Findings
This report presents annual statistics on planning decision-making and timescales for 2012/13 to 2020/21. It is based on quarterly data collected by the Scottish Government from Local and Planning Authorities as part of the Planning Performance Framework (introduced in 2012).
In 2020/21 the number of applications detemined and average decision times were impacted on by restrictions due to the COVID-19 pandemic. Further information about the impacts is available in Section 1.2.
- 24,448 local planning applications
- 272 major planning applications decided by Planning Authorities 2020/21
- 94.5% of planning applications approved
In 2020/21 Planning Authorities decided 24,448 local planning applications and 272 major planning applications. This includes applications with processing agreements where the developer and local authority agree on timescales for decisions.
Classification between local and major depends on the development type. Further information about categories is available in Section 1.6.
Most applications were approved.
Annual Trends for Local and Major Developments
The number of applications determined and the decision times were impacted on by restrictions due to the COVID-19 pandemic. Further information about the impacts is available in Section 1.2.
Increase in average decision time for local and major developments.


Applications with processing agreements are not included in decision time calculations. The use of processing agreements for local applications has increased from 4.2% of local applications in 2016/17 to 10.4% in 2020/21. The use of processing agreements for major applications has increased from 27.9% of all major applications in 2016/17 to 37.1% in 2020/21.
A number of local authorities reported an increased use of processing agreements in response to managing COVID-19 pandemic restrictions and delays.
Number of planning applications continues to fall.
- The number of local and major planning applications with decisions has decreased each year since 2013/14.
- There were 2,137 fewer local development applications than in 2019/20.
- There were 35 fewer major development applications than in 2019/20.
Planning Applications by Development Type

Local and major housing developments was the third largest group with 4,937 applications (4,293, 14% of all applications).

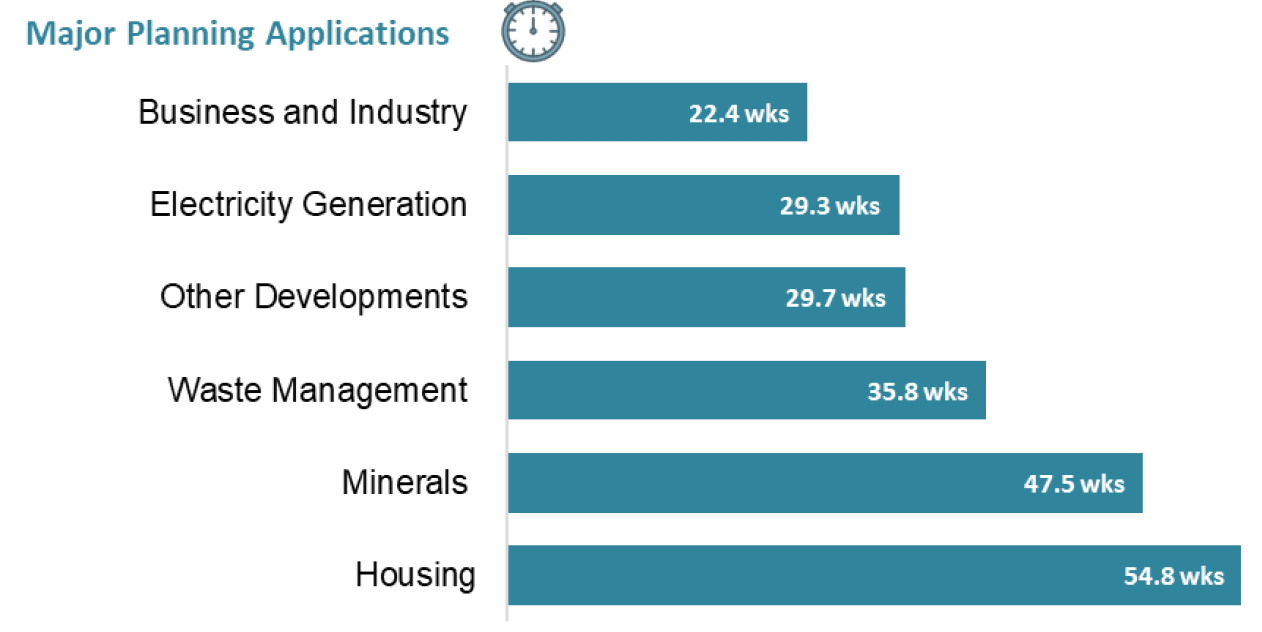
In 2020/21 the average decision time for householders making changes to their properties was 8.1 weeks. The longest average decision times were for applications for mineral developments, 22.0 weeks.

The quickest average decision time, business and industry applications, was 22.3 weeks. The longest average decision time was for applications for housing developments, 54.8 weeks.
Planning Applications for Housing Developments

In 2020/21 just under half (47.6%) of decisions on local housing applications were made by five local authorities. Highland made the most, 773 (19% of the Scotland Total). This was followed by Aberdeenshire (477), Argyll and Bute (264), Perth and Kinross (259), and Moray (212).

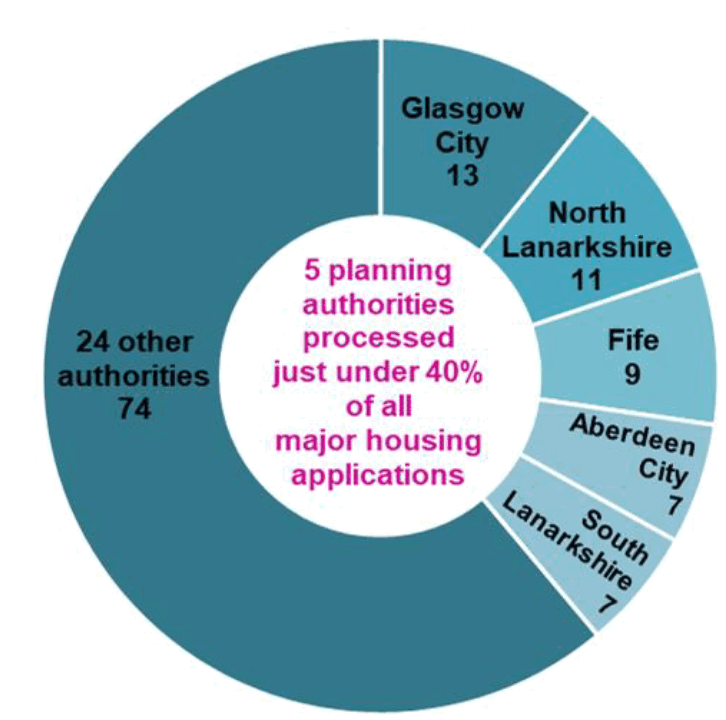
In 2020/21 five local authorities made 38.8% of decisions on major housing applications.Glasgow City made the most (13), 11% of the Scotland Total. This was followed by North Lanarkshire (11), Fife (9), Aberdeen City (7) and South Lanarkshire (7).
Contact
Email: planning_stats@gov.scot
There is a problem
Thanks for your feedback