Private sector rent statistics: 2010 - 2019
This publication presents statistics on private sector rent levels in Scotland over the years 2010 to 2019.
Main Findings for 1 Bedroom Properties
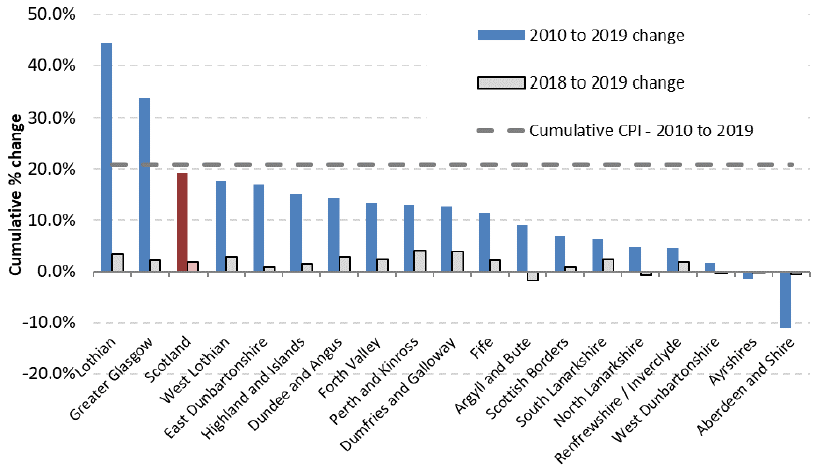
Over the past year, 13 out of 18 areas have seen increases in average rents for 1 bedroom properties. Perth and Kinross has seen the highest increase (4.1%) while Dumfries and Galloway has seen an increase of 4.0%. Both of these areas, as well as Lothian (3.4%), Dundee and Angus (2.9%), West Lothian (2.8%), Forth Valley (2.4%), South Lanarkshire (2.3%), Greater Glasgow (2.2%), Fife (2.2%), and Renfrewshire / Inverclyde (1.9%) are areas that have shown increases which are higher than the CPI inflation of 1.7% in 2018-2019. Other areas that have seen increases are 1.5% in the Highlands and Islands, 0.8% in East Dunbartonshire and 0.7% in the Scottish borders.
Five areas saw a decrease, ranging from a 0.1% drop in the Ayrshires to a 1.8% drop in Argyll and Bute. This is the fourth consecutive annual decrease (0.3%) for Aberdeen and Shire, which is likely to reflect decreased demand for rental properties in recent years following the downturn in the oil industry.
Average rents for 1 bedroom properties have increased by 1.9% between 2018 and 2019, at the Scotland level, from £510 in 2018 to £519 in 2019. This compares to an increase in the UK Consumer Price Index of 1.7% in the year to Sept-19.
Figures on changes to rents for 1 bedroom properties over the period from 2010 to 2019 should be considered in the context of the cumulative increase in the UK Consumer Price Index of 20.8% from Sept-10 to Sept-19.
Over the 9 year period from 2010 to 2019, two areas have seen rent increases above the level of CPI inflation. Lothian has seen the highest increase in private rents for 1 bedroom properties, with average rents rising by 44.5% (cumulative increase over 9 years) and average rents in the Greater Glasgow area have risen by 33.7% between 2010 and 2019.
For the remaining areas of Scotland, cumulative increases were below CPI inflation and have ranged from 1.6% in West Dunbartonshire to 17.6% in West Lothian. Two areas saw average rents fall between 2010 and 2019. These were the Ayrshires (-1.4%) and Aberdeen and Shire (-11.1%). These regional trends combine to show a 19.1% cumulative increase for 1 bedroom properties from £436 in 2010 to £519 in 2019. See Chart 2 and Table 1 below.
Chart 2 Cumulative % Change in Average (mean) Rents from 2010 to 2019 (years to end-Sept), by Broad Rental Market Area - 1-Bedroom Properties

Table 1 - 1 Bedroom Properties - Average (mean) Monthly Rents (£): Cumulative Changes 2010 to 2019, by Broad Rental Market Area
| 2010 | 2018 | 2019 | 2010 to 2019 change | 2018 to 2019 change | |
|---|---|---|---|---|---|
| Lothian | 520 | 728 | 752 | 44.5% | 3.4% |
| Greater Glasgow | 437 | 572 | 585 | 33.7% | 2.2% |
| Scotland | 436 | 510 | 519 | 19.1% | 1.9% |
| West Lothian | 428 | 490 | 504 | 17.6% | 2.8% |
| East Dunbartonshire | 450 | 521 | 526 | 16.9% | 0.8% |
| Highland and Islands | 415 | 471 | 478 | 15.1% | 1.5% |
| Dundee and Angus | 351 | 390 | 402 | 14.4% | 2.9% |
| Forth Valley | 387 | 428 | 438 | 13.3% | 2.4% |
| Perth and Kinross | 377 | 410 | 427 | 13.1% | 4.1% |
| Dumfries and Galloway | 359 | 389 | 404 | 12.6% | 4.0% |
| Fife | 379 | 413 | 422 | 11.4% | 2.2% |
| Argyll and Bute | 382 | 424 | 417 | 9.1% | -1.8% |
| Scottish Borders | 336 | 357 | 360 | 7.0% | 0.7% |
| South Lanarkshire | 382 | 397 | 406 | 6.2% | 2.3% |
| North Lanarkshire | 373 | 394 | 391 | 4.8% | -0.7% |
| Renfrewshire / Inverclyde | 374 | 384 | 392 | 4.6% | 1.9% |
| West Dunbartonshire | 397 | 405 | 403 | 1.6% | -0.4% |
| Ayrshires | 375 | 370 | 370 | -1.4% | -0.1% |
| Aberdeen and Shire | 529 | 473 | 470 | -11.1% | -0.5% |
See Reference Tables (Tables 7 to 15) for a more detailed breakdown of quartile and average rents for each year.
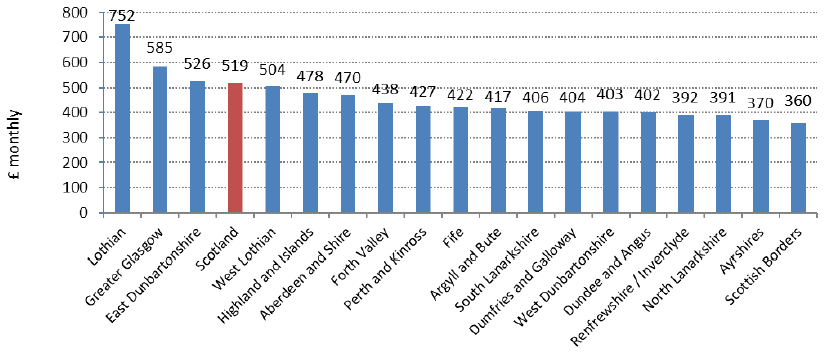
For the year to end-September 2019, Lothian had the highest average monthly rents for 1 bedroom properties across Scotland (£752), with Greater Glasgow having rents of £585. Areas with the lowest average rents for 1 bedroom properties included Scottish Borders (£360) and Ayrshires (£370). See Chart 3 below.
Chart 3 Average (mean) Monthly Rents 2019 (year to end-Sept), by Broad Rental Market Area - 1-Bedroom Properties

Contact
Email: felix.palin@gov.scot
There is a problem
Thanks for your feedback