Private sector rent statistics: 2010 - 2020
This publication presents statistics on average private sector rent levels in Scotland by Broad Rental Market Area and size of property, for the years 2010 to 2020.
Annex D – Revisions Note: Methodology for calculating Scotland level figures
This section sets out the methodological improvements that have been applied to the publication figures this year in relation to how Scotland level estimates have been calculated, and provides information on the impact of this change on the Scotland level figures previously published.
It is important to note that this methodological change only relates to the Scotland level esimates of average (mean) rents, and doesn't impact on any figures presented at Broad Rental Market Area level.
Section 8 of this publication provides a summary of the approach to how Scotland level average rents have been calculated using a weighted stock approach based on separate Scottish Household Survey data on the profile of stock by area and property size over time. This differs to previous publications which have presented unweighted Scotland average figures. We will no longer be publishing unweighted estimates, as we consider the weighted estimates to be more robust and representative.
This methodological change has been applied to help ensure that the national average figures presented reflect the underlying composition of private rental properites over time, and to minimise any effects of changes to sample numbers achieved for particular property sizes or areas in any given years.
As Section 8 has set out, the weights from the Scottish Household Survey data have been constructed using 3 year rolling data periods. Each 3 year data period has been centred on the rental year to be estimated with a lag applied of 2 years, due to the time delay between 3 year survey results being available and the latest rental year in question.
For example, for the latest rental year 2020, a 3 year data period 2017 to 2019 has been used to construct the stock based weights, which equates to the year 2020 lagged by two years (i.e. to be centred on 2018).
For each property size category, the stock based weights have been calculated based on the proportion of private rented households in each category that are located in each of the Broad Rental Market Areas.
The exception is for 1 bedroom shared properties, where the weightings are instead based on the estimated proportions of owner occupier or private rented households in each areas that contain two or more adults who are not related or who are not in a married / civil partnership or a co-habiting partnership, with the aim to identify households where there may be an individual room being rented in some form.
The calculated weights are set out in Annex C, in Table C3 and Charts C3.
These weights are then used as part of a weighted average calculation to construct the Scotland level average rent estimates.
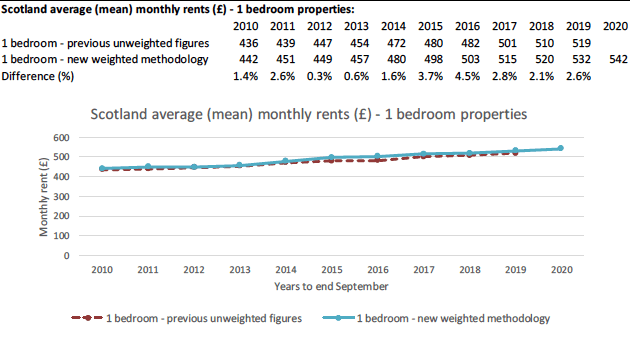
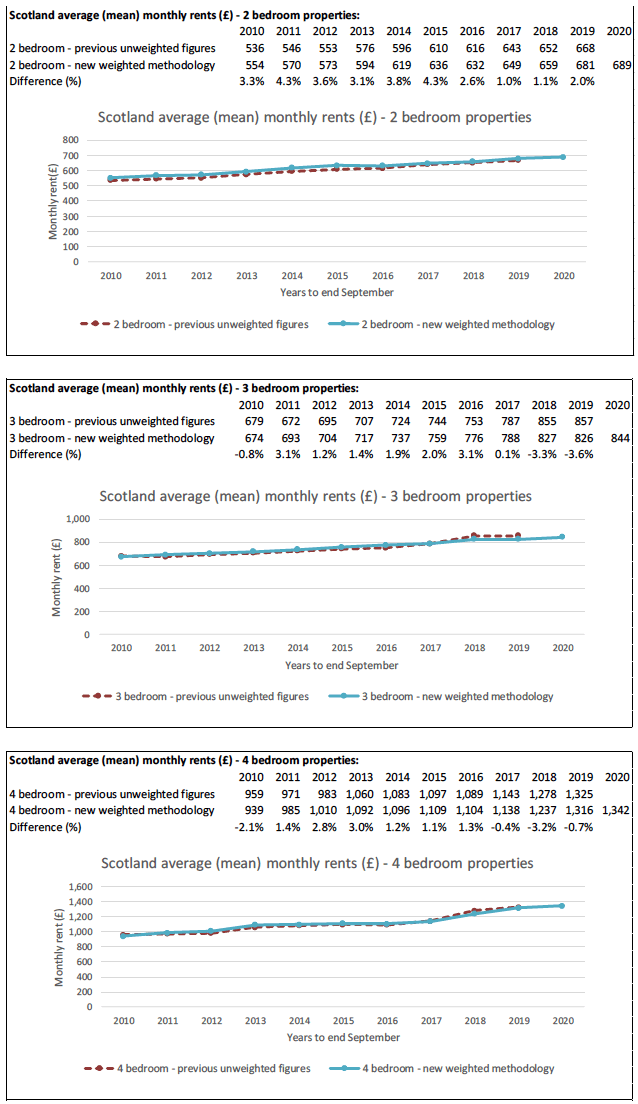
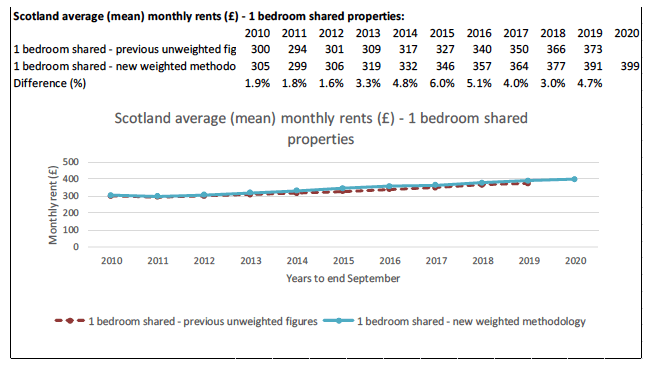
Chart D1 below illustrates how the weighted estimates differ to the previously published unweighted figures for each property size category.


It can be seen that whilst the use of weights does change some of the individual year average figures, that the overall trends over time broadly remain similar for each property size category.
For 1 bedroom properties, the weighted figures calculated are slightly higher than the unweighted figures for each year, with an average annual difference of 2.2%. This has the effect of slightly bringing up the Scotland level average rents across each year, although for some years the effect is only marginal.
For 2 bedroom properties, the weighted figures calculated are slightly higher than unweighted figures across all of the series, with an average annual difference of 2.9%.
When looking at 3 bedroom properties, the weighted figures are above the unweighted figures for each year between 2011 and 2017 (average annual difference of 1.8%), after which the weighted figures are then lower than the unweighted figures for the years 2018 and 2019 (average annual difference of -3.5%). This has the effect of slightly smoothing out the full series, in particular the relatively large increase seen in the unweighted figures between 2016 and 2018.
For 4 bedroom properties, the weighted figures are above the unweighted figures for each year between 2011 and 2016 (average annual difference of 1.8%), after which the weighted figures are then lower than the unweighted figures for the years 2017 to 2019 (average annual difference of -1.4%). However for some years the differences are only relatively marginal.
When looking at 1 bedroom shared properties, the weighted figures are above the unweighted figures for each year, with the annual differences generally being slightly higher across the period 2014 to 2019 (avearge annual difference of 4.6%) compared with 2010 to 2013 (average annual difference of 2.1%). This has the effect of slightly increasing the average rent in each year, with the differences being more pronounced in later years.
Differences in the calculated weighted figures compared to the unweighted figures will be due to differences in the composition of the underlying stock weights compared with the rental data sample numbers, particularly where these differences in weighting / sample numbers are in areas in which average rents are particularly high or low. For example, for 1 and 2 bedroom properties, the stock weights for Lothian across the 2010 to 2019 period average at 25% and 21% for each of these size categories respectively. These are larger percentage weight figures across this time period than the equivalent rental data sample proportions (averages of 19% and 15% for 1 and 2 bedroom properties respectively), which therefore leads to Lothian being given slightly higher weight in the calculations, slightly increasing the Scotland average rent level figures.
Other differences seen in the weighted figures compared to the unweighted figues reflect how changes over time to the profile of private rented stock differs between the weighted figures compared to the rental sample numbers. For example, for 3 bedroom properties the stock weights calculated are slightly lower than the equivalent rental sample numbers in Lothian and Greater Glasgow across more recent years. And so the use of the stock weights therefore helps to correct for any bias over time introduced by the increased number of rental records achieved for these areas in more recent years.
To note one limitation of the weighting approach applied is that there may be some level of mis-match between the SHS weights (covering all PRS stock) and the sample of records collected from Rent Service Scotland (i.e. excluding those with housing benefit and regulated tenancies).
Contact
Email: housingstatistics@gov.scot
There is a problem
Thanks for your feedback