Private sector rent statistics: 2010 - 2021
This publication presents statistics on average private sector rent levels in Scotland by Broad Rental Market Area and size of property, for the years 2010 to 2021.
6. Main Findings for 4 Bedroom Properties
Note that some areas have a relatively low number of 4 bedroom property records recorded, and therefore some caution is needed when interpreting the findings given that the averages presented can be based on a small number of underlying records.
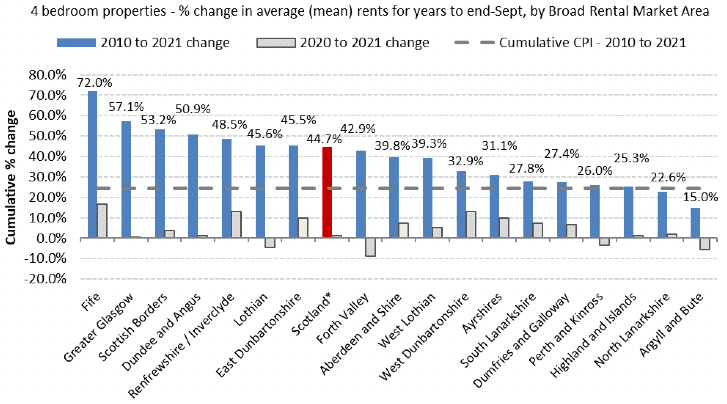
In the year to end September 2021, average 4 bedroom rents increased above the average 12 month UK CPI inflation rate of 1.5% in 11 out of 18 areas, with the largest increases being in Fife (16.5%), Renfrewshire / Inverclyde (13.2%) and West Dunbartonshire (13.2%).
A further three areas saw increases in average rents but below CPI, including Greater Glasgow (0.6%), Highland and Islands (1.2%) and Dundee and Angus (1.3%).
Average rents decreased by more than 0.5% in the remaining areas, with decreases seen for Perth and Kinross (-3.4%), Lothian (-4.5%), Argyll and Bute (-5.5%), and Forth Valley (-8.8%).
Average rents for 4 bedroom properties at the Scotland level were estimated to increase by 1.2% between 2020 and 2021, to reach £1,358 in 2021, which compares to an average increase in UK CPI of 1.5% across the year to September 2021.
Figures on longer term changes to rents for 4 bedroom properties over the period from 2010 to 2021 should be considered in the context of the cumulative increase in UK CPI of 24.3% from the year to end September 2010 to the year to end September 2021.
Over the 11 year period from 2010 to 2021, nearly all (16 out of 18) areas have seen rent increases above the level of CPI inflation, ranging from an increase of 25.3% in Highland and Islands up to 72.0% in Fife.
These cumulative increases equate to a range of annualised growth rates between 2.1% in Highland and Islands to 5.1% in Fife, when calculated on a compound annual increase basis between 2010 and 2021.
For the remaining two areas of Scotland, cumulative increases have been below CPI inflation, in Argyll and Bute (15.0%) and North Lanarkshire (22.6%).
These regional trends combine to show an estimated 44.7% cumulative increase for 4 bedroom properties between 2010 and 2021 (equating to an annualised growth rate of 3.4%), to reach £1,358 in 2021. See Table 4 and Chart 8 below.
| 2010 | 2020 | 2021 | 2010 to 2021 change | 2020 to 2021 change | |
|---|---|---|---|---|---|
| Fife | 773 | 1,142 | 1,330 | 72.0% | 16.5% |
| Greater Glasgow | 1,067 | 1,667 | 1,677 | 57.1% | 0.6% |
| Scottish Borders | 690 | 1,018 | 1,057 | 53.2% | 3.8% |
| Dundee and Angus | 811 | 1,208 | 1,224 | 50.9% | 1.3% |
| Renfrewshire / Inverclyde | 834 | 1,093 | 1,238 | 48.5% | 13.2% |
| Lothian | 1,291 | 1,966 | 1,879 | 45.6% | -4.5% |
| East Dunbartonshire | 1,135 | 1,506 | 1,651 | 45.5% | 9.7% |
| Scotland* | 939 | 1,342 | 1,358 | 44.7% | 1.2% |
| Forth Valley | 857 | 1,343 | 1,225 | 42.9% | -8.8% |
| Aberdeen and Shire | 944 | 1,231 | 1,319 | 39.8% | 7.2% |
| West Lothian | 834 | 1,105 | 1,162 | 39.3% | 5.1% |
| West Dunbartonshire | 821 | 965 | 1,092 | 32.9% | 13.2% |
| Ayrshires | 758 | 906 | 994 | 31.1% | 9.7% |
| South Lanarkshire | 924 | 1,099 | 1,181 | 27.8% | 7.4% |
| Dumfries and Galloway | 620 | 741 | 790 | 27.4% | 6.6% |
| Perth and Kinross | 858 | 1,119 | 1,080 | 26.0% | -3.4% |
| Highland and Islands | 751 | 929 | 940 | 25.3% | 1.2% |
| North Lanarkshire | 776 | 933 | 952 | 22.6% | 2.0% |
| Argyll and Bute | 924 | 1,125 | 1,063 | 15.0% | -5.5% |
See Reference Tables (Tables 7 to 17) for a more detailed breakdown of quartile and average rents for each year.
* Note that the Scotland figures have been calculated using a weighted stock approach. See Section 8 for further details.

*Note that the Scotland figures have been calculated using a weighted stock approach. See Section 8 for further details.
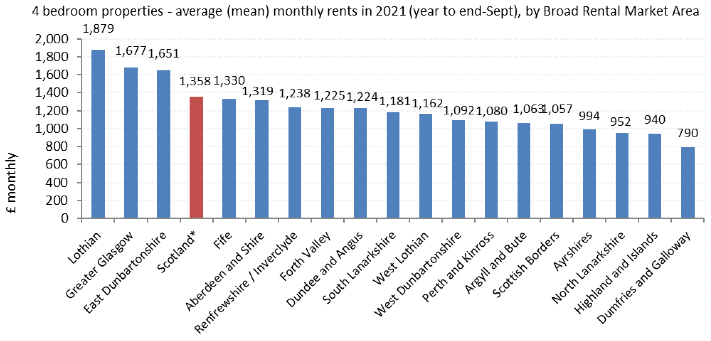
In the year to end September 2021, Lothian had the highest average monthly rents for 4 bedroom properties across Scotland (£1,879). The area with the lowest average rents for 4 bedroom properties was Dumfries and Galloway (£790). See Chart 9 below.

*Note that the Scotland figures have been calculated using a weighted stock approach. See Section 8 for further details.
Contact
Email: housingstatistics@gov.scot
There is a problem
Thanks for your feedback