Scottish scientific electrofishery for razor clams trial - biological and ecological goals: progress report
Report summarising data and main findings from the trial to date.
Appendix 4
Data summaries on razor clam fisheries by Zone and Trial Area
4.1 Zone 1 (Outer Hebrides)
The Outer Hebrides (Zone 1) contains four trial areas: Broad Bay, Sound of Harris, Benbecula and the Sound of Barra. Three vessels currently have derogations to fish for razor clams. REM sensor data indicates only the Broad Bay trial area has been fished for razor clams and as such is the only trial area reported in this zone. The other trial areas were not authorised for fishing as no fishing grounds were classified as harvesting areas for razor clam as designated by Food Standard Scotland.
4.1.1 Trial Area 1 Broad Bay
Annual landings of razor clams in the Broad Bay trial area have fluctuated between 9 t and 27 t (Table A4.1). A maximum of two vessels fished their derogation in any trial year; one vessel fished every year and the other vessel fished only in 2019. Total effort ranged from 36 to 100 days per year with a reported average daily landing of 307 kg (average across years 1-5) (Table A4.1).
| Year 1 | Year 2 | Year 3 | Year 4 | Year 5 | |
|---|---|---|---|---|---|
| Landings (source: logbook) | |||||
| Landings (t) | 16.5 | 27.3 | 9 | 10.7 | 20.4 |
| Average daily landings (kg) | 334 | 297 | 272 | 281 | 351 |
| Effort (source: electronic monitoring) | |||||
| Number of vessels | 1 | 2 | 1 | 1 | 1 |
| Total effort (days) | 61 | 100 | 36 | 42 | 59 |
| Mean fishing duration (hrs per day) | 7.1 | 6.3 | 6.7 | 6 | 5.1 |
| Fishing footprint (number of c-squares) | 11 | 13 | 18 | 8 | 11 |
| Mean fishing intensity (hrs per c-square) | 30.6 | 46.2 | 13.4 | 33.9 | 32.1 |
| Fishing intensity range (hrs per c-square) | 0.25-143 | 0.3-297 | 0.22-82.2 | 0.77-113 | 0.35-134 |
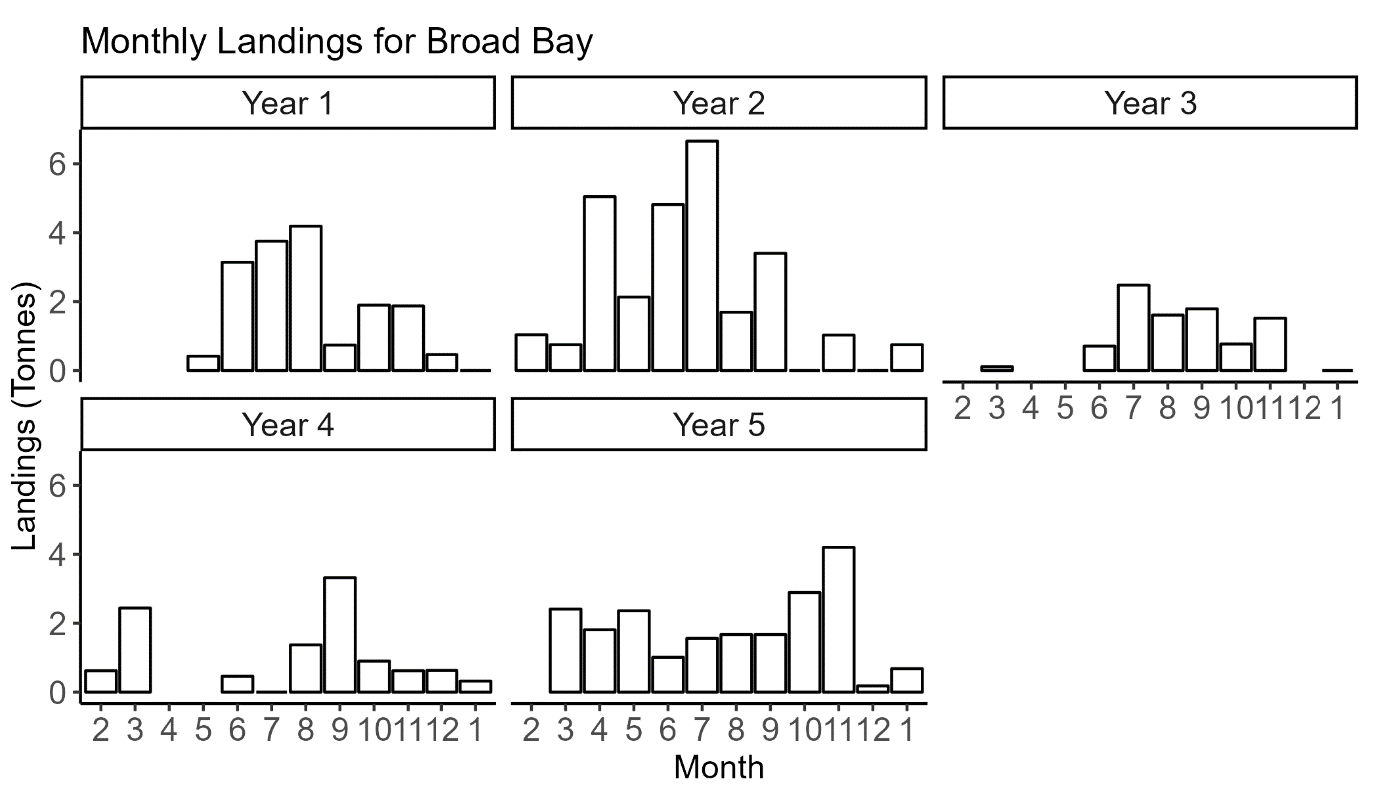
Total razor clam landings were highest in Year 2 (27.3 t), with a peak of over 6 t in July of that year (Figure A4.1).
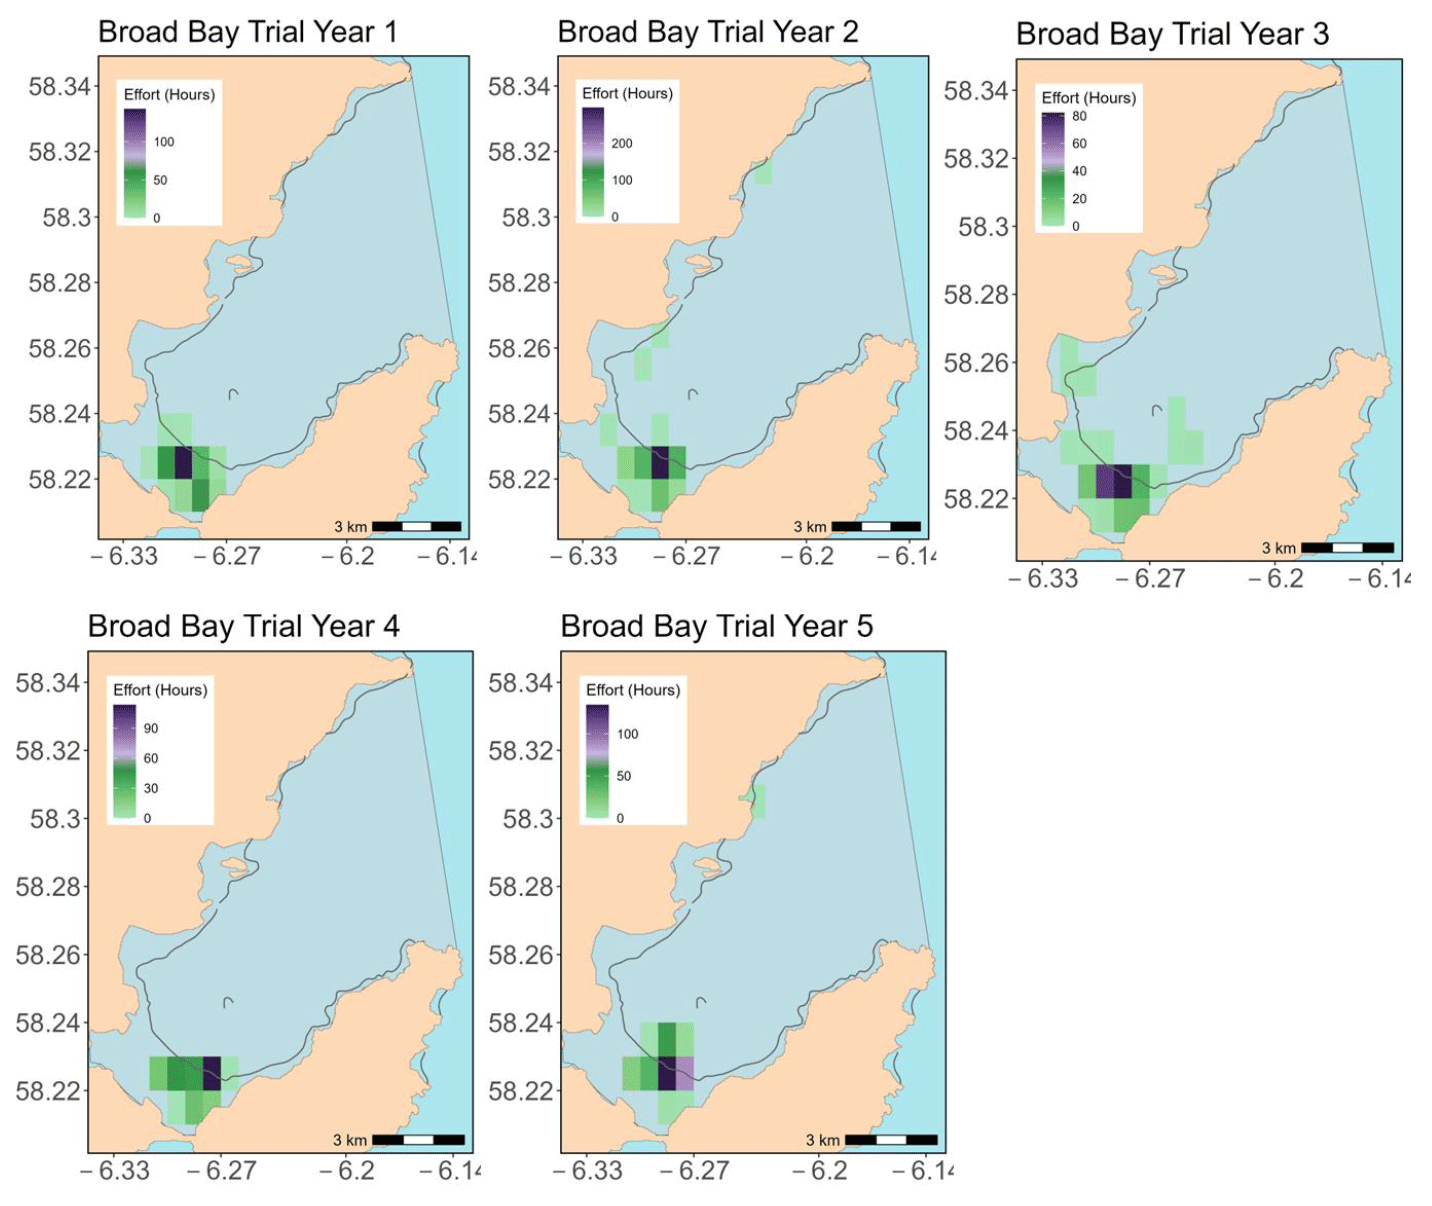
Fishing for razor clams has occurred at the inner end of the Bay, extending along the northern shore, predominantly within and adjacent to the 10 m contour line (Figure A4.2). Fishing effort was greater in Trial Year 2 compared to other years (Table A4.1). This is due to two vessels fishing during Year 2 and only one in all other trial years. The average fishing hours per cell fished and maximum per cell fishing hours in Year 2 were almost double the values observed in other trial years (Table A4.1).
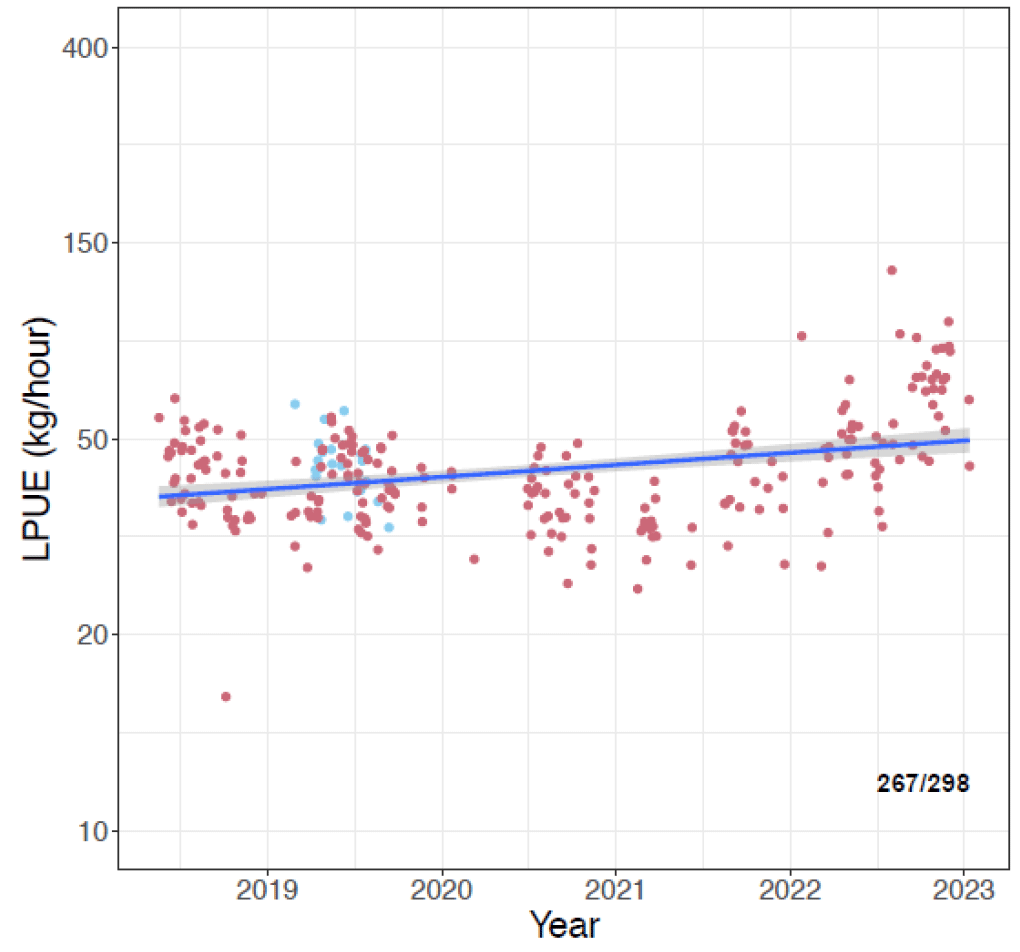
The LPUE for the Broad Bay trial area has remained relatively consistent with vessels landing on average 40-50 kg of razor clams per hour over days with fishing activity. There is little difference observed in the LPUEs between the two vessels that have fished the trial area, although there are far fewer data points for the vessel which only fished in 2019 (shown in red) (Figure A4.3).
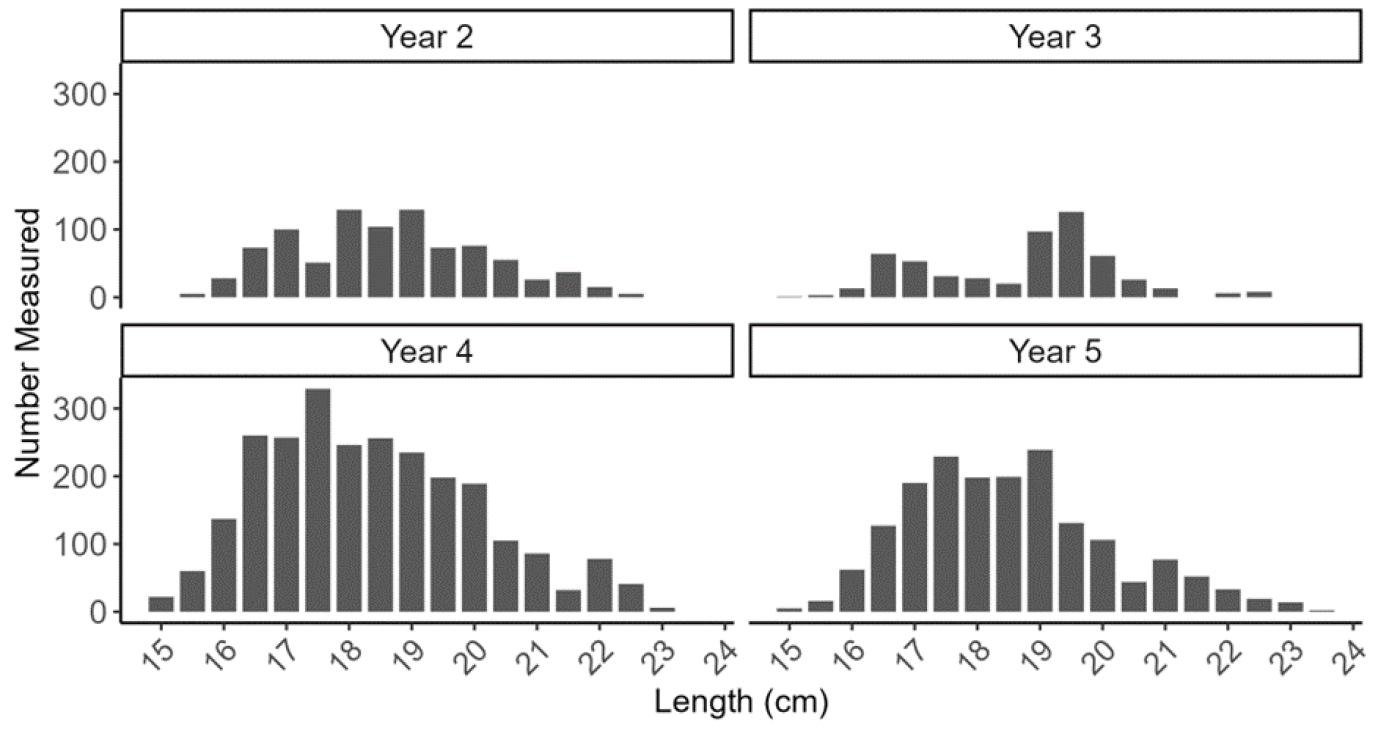
For Broad Bay, a total of 26 razor clam self-sample data sheets have been submitted by fishers and processers from the start of the trial until January 2023 (Table A4.2). Lengths of the landed razor clams sampled were between 15 and 23.5 cm (Figure A4.4) with the highest number of samples (and measurements) submitted in year 4.
| Year 1 | Year 2 | Year 3 | Year 4 | Year 5 | |
|---|---|---|---|---|---|
| Feb | - | 2 | - | 1 | - |
| Mar | - | 2 | - | 3 | - |
| Apr | - | - | - | - | 1 |
| May | - | - | - | - | 1 |
| Jun | - | - | - | 1 | - |
| Jul | - | - | 1 | - | 1 |
| Aug | - | - | 1 | 1 | - |
| Sep | - | 1 | 1 | - | 1 |
| Oct | - | - | - | 1 | - |
| Nov | - | - | - | 1 | 1 |
| Dec | - | - | - | 1 | 1 |
| Jan | - | - | 1 | 1 | 1 |
| Total | 0 | 5 | 4 | 10 | 7 |
4.1.2 Trial Area 2 Sound of Harris
This trial area does not have any classified razor clam harvesting areas as designated by Food Standards Scotland and REM data indicates no fishing has taken place.
4.1.3 Trial Area 3 Benbecula
This trial area does not have any classified razor clam harvesting areas as designated by Food Standards Scotland and REM data indicates no fishing has taken place.
4.1.4 Trial Area 4 Sound of Barra
This trial area does not have any classified razor clam harvesting areas as designated by Food Standards Scotland and REM data indicates no fishing has taken place.
4.2 Zone 2 West coast NW
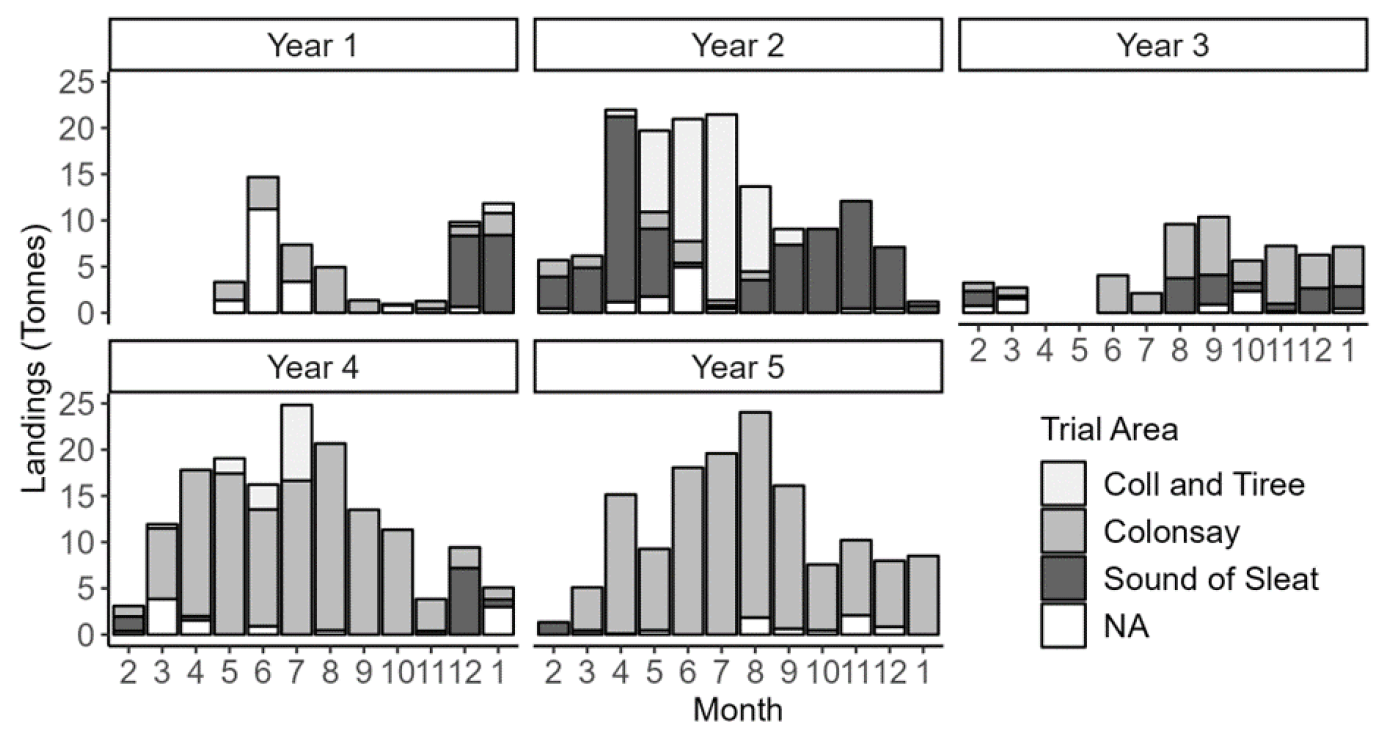
The West coast NW (Zone 2) encompasses three trial areas: the Sound of Sleat, Colonsay and Coll and Tiree. Eight vessels have derogations to fish for razor clams in the West coast NW zone. The total annual landings for the West coast NW zone have fluctuated between 37.7 and 147 t, with the highest total landings in Year 4 (Table A4.3, Figure A4.5). Colonsay is the trial area with the highest landings in the West coast NW zone with 342.2 t landed over the five year trial period (Table A4.3). The reported landings were highest in July of Year 2 with 25 t landed across the three trial areas in total. There is a seasonal trend in razor clam landings, with peaks in the summer months and reduced landings in the winter months (Figure A4.5). 9% (50 t) of landings associated with fishing in the West Coast NW zone had no trial area assigned.
| Year 1 | Year 2 | Year 3 | Year 4 | Year 5 | Total | |
|---|---|---|---|---|---|---|
| Coll and Tiree | 1.5 | 53.8 | - | 13 | - | 68.3 |
| Colonsay | 20.1 | 9.2 | 36.8 | 123.3 | 134.8 | 342.2 |
| Sound of Sleat | 16.1 | 75.5 | 15.5 | 10.4 | 1.8 | 119.3 |
| Total | 37.7 | 138.5 | 52.3 | 146.7 | 136.6 | 511.8 |
4.2.1 Trial Area 5 Sound of Sleat
Annual landings of razor clams in the Sound of Sleat trial area have fluctuated between 1.8 to 75.5 t (Table A4.4; Figure A4.6). Reported landings were highest in Year 2 of the trial with a peak in April with removals of around 20 t, which was almost double the removals of the next highest month for this trial area. There appears to be a drop in landings in the summer months in this area with few to no landings in June and July (Figure A4.6).
| Year 1 | Year 2 | Year 3 | Year 4 | Year 5 | |
|---|---|---|---|---|---|
| Landings (source: logbook) | |||||
| Landings (t) | 16.1 | 75.5 | 15.5 | 10.4 | 1.8 |
| Average daily landings (kg) | 379 | 393 | 353 | 377 | 254 |
| Effort (source: electronic monitoring) | |||||
| Number of vessels | 3 | 5 | 2 | 2 | 1 |
| Total effort (days) | 43 | 193 | 43 | 27 | 7 |
| Mean fishing duration (hrs per day) | 5.9 | 7.8 | 8.6 | 7.2 | 6.8 |
| Fishing footprint (number of c-squares) | 15 | 27 | 37 | 14 | 6 |
| Mean fishing intensity (hrs per c-square) | 17.5 | 52.4 | 10.4 | 14.4 | 7.97 |
| Fishing intensity range (hrs per c-square) | 0.05-89.2 | 0.03-254 | 0.02-74.4 | 0.02-41.2 | 1.15-19.6 |
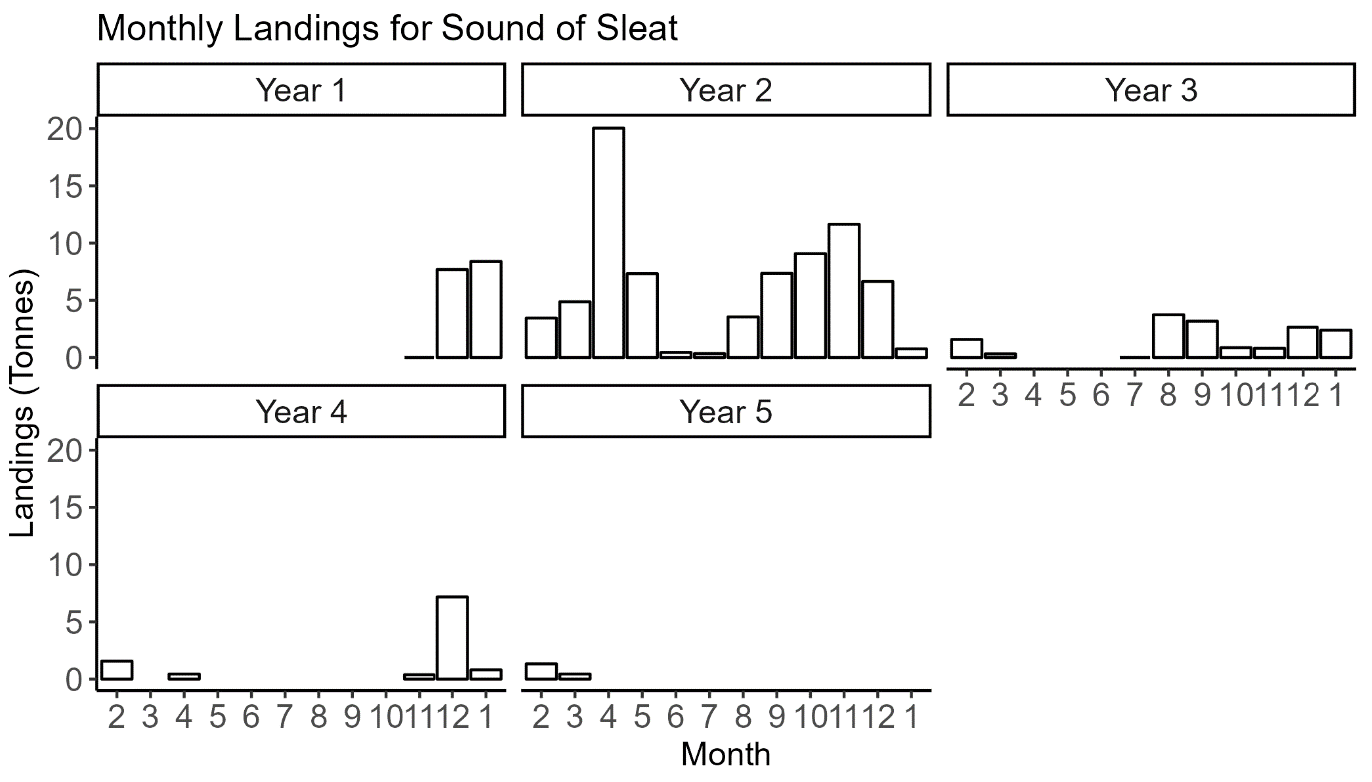
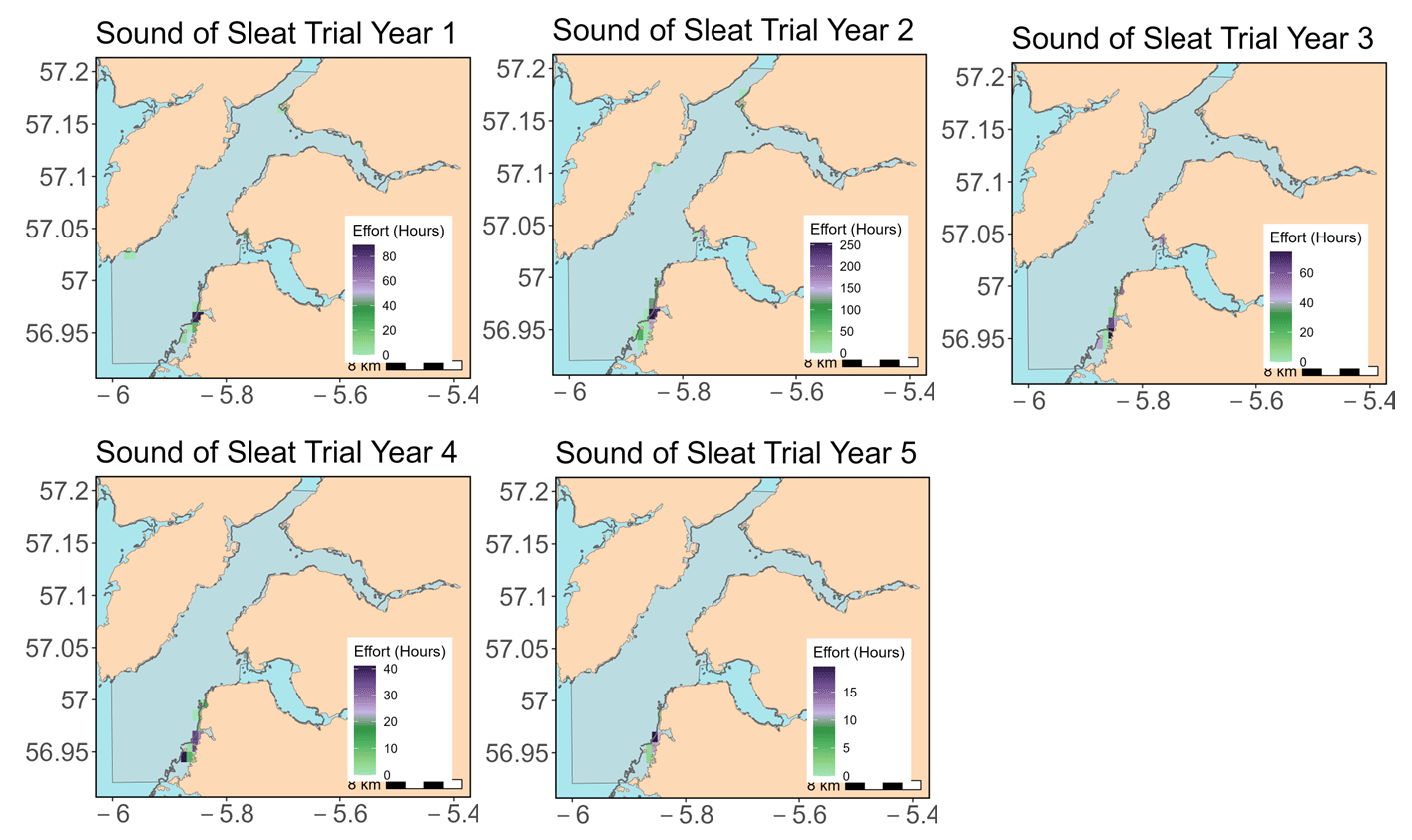
Fishing effort is aggregated along the southern shoreline from Mallaig to the Arisaig Skerries with a handful of other small discrete patches. Fishing effort (days) was greatest in Trial Year 2 when the number of unique vessels fishing in this area (five vessels) was also highest.
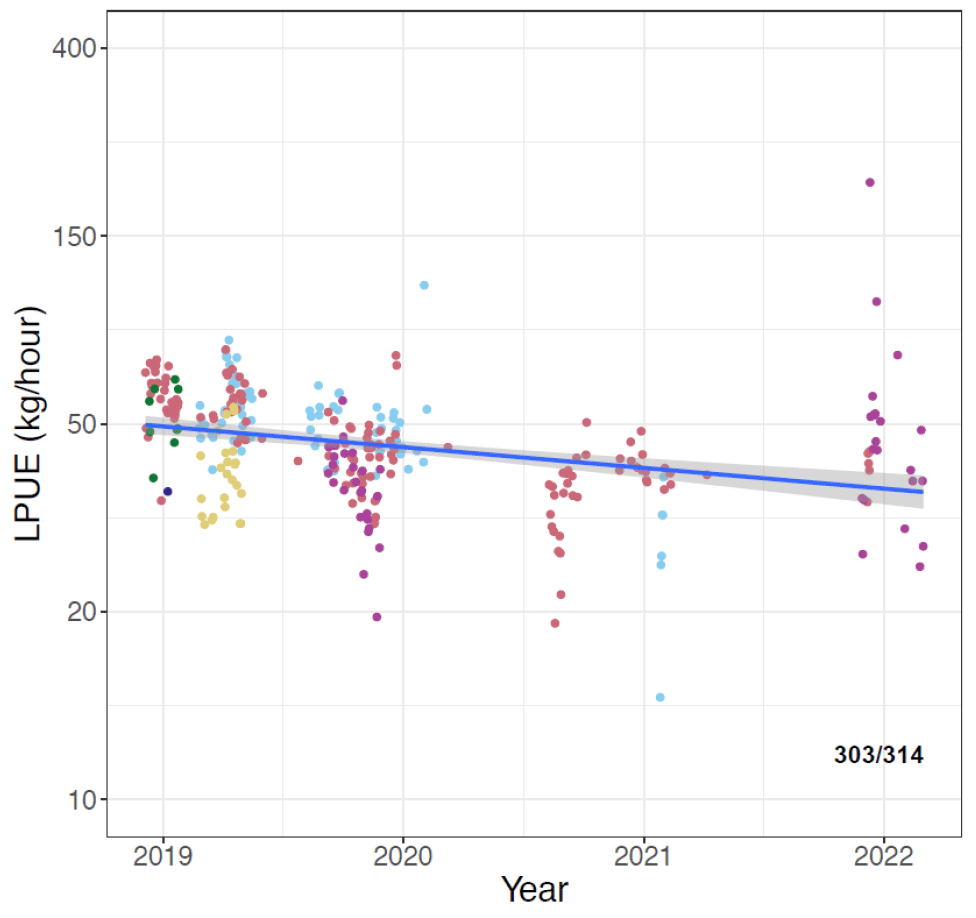
The variability of the LPUE estimates is high, particularly for one or two vessels (purple and gold in Figure A4.8), and shows a slight declining trend from around 50 kg to 40 kg per hour over the years of 2019-2022 when this area has been fished.
For the Sound of Sleat, a total of seven self-sampling data sheets have been submitted by trial participant and associated fish processors since the start of the trial to January 2023 (Table A4.5). Lengths of the landed razor clams sampled were between 10 and 22.5 cm (Figure A4.9).
| Year 1 | Year 2 | Year 3 | Year 4 | Year 5 | |
|---|---|---|---|---|---|
| Feb | - | - | 1 | 1 | - |
| Mar | - | - | 1 | - | - |
| Apr | - | 1 | - | - | - |
| May | - | - | - | - | - |
| Jun | - | - | - | - | - |
| Jul | - | - | - | - | - |
| Aug | - | - | - | - | - |
| Sep | - | 1 | - | - | - |
| Oct | - | 1 | - | - | - |
| Nov | - | 1 | - | - | - |
| Dec | - | - | - | - | - |
| Jan | - | - | - | - | - |
| Total | 0 | 4 | 2 | 1 | 0 |
4.2.2 Trial Area 6 Coll and Tiree
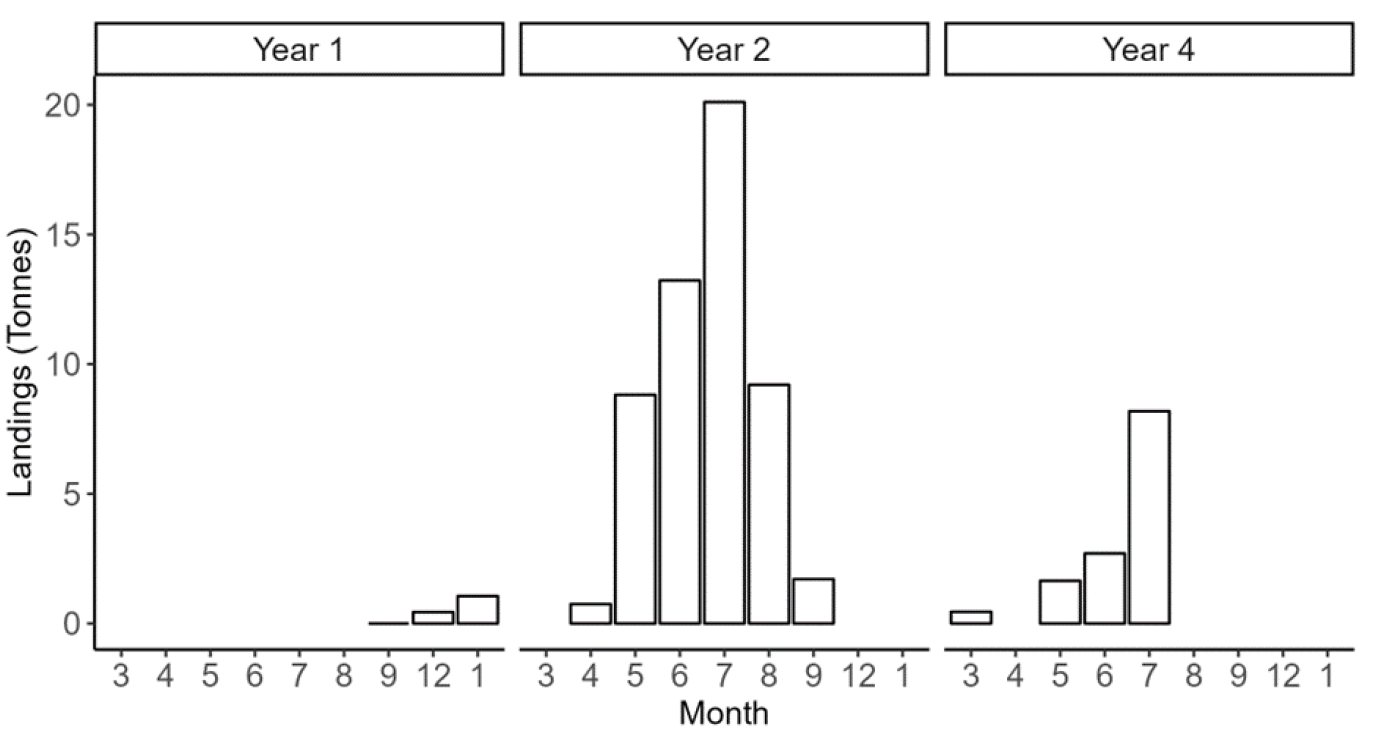
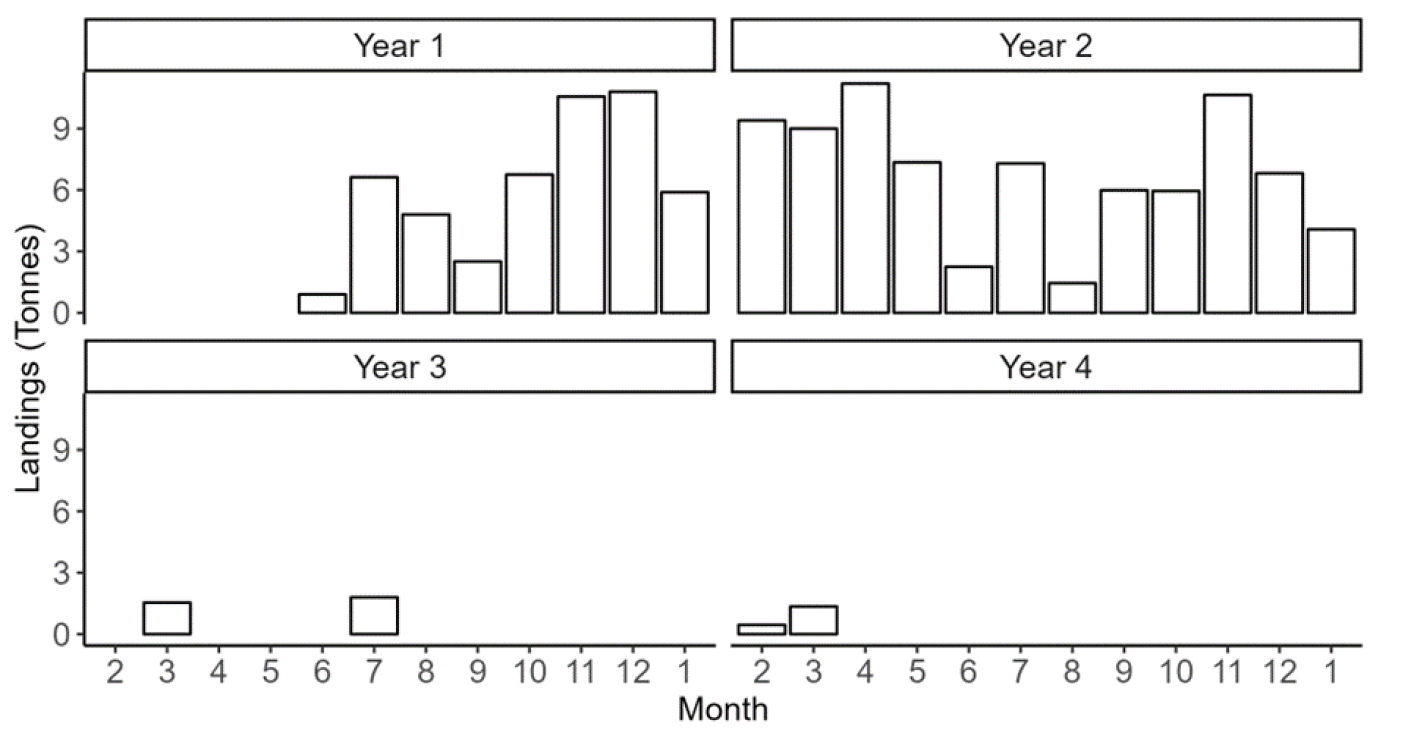
Annual landings of razor clams in the Coll and Tiree trial area have fluctuated between 0 and 53.8 t (Table A4.6; Figure A4.10) with no landings in Year 3 or 5 of the trial. Reported landings were highest in Year 2, with the highest reported landings (20 t) for any single month in the trial period occurring in July of Year 2. This trial area appears to be fished exclusively in the summer months, with little to no landings in the winter months (Figure A4.10).
| Year 1 | Year 2 | Year 3 | Year 4 | Year 5 | |
|---|---|---|---|---|---|
| Landings (source: logbook) | |||||
| Landings (t) | 1.5 | 53.8 | - | 13 | - |
| Average daily landings (kg) | 373 | 408 | - | 382 | - |
| Effort (source: electronic monitoring) | |||||
| Number of vessels | 2 | 6 | - | 3 | - |
| Total effort (days) | 5 | 137 | - | 34 | - |
| Mean fishing duration (hrs per day) | 5.3 | 7.5 | - | 7.2 | - |
| Fishing footprint (number of c-squares) | 5 | 10 | - | 11 | - |
| Mean fishing intensity (hrs per c-square) | 3.95 | 78.8 | - | 19.9 | - |
| Fishing intensity range (hrs per c-square) | 0.03-13.8 | 1.57-390 | - | 0.22-98.4 | - |
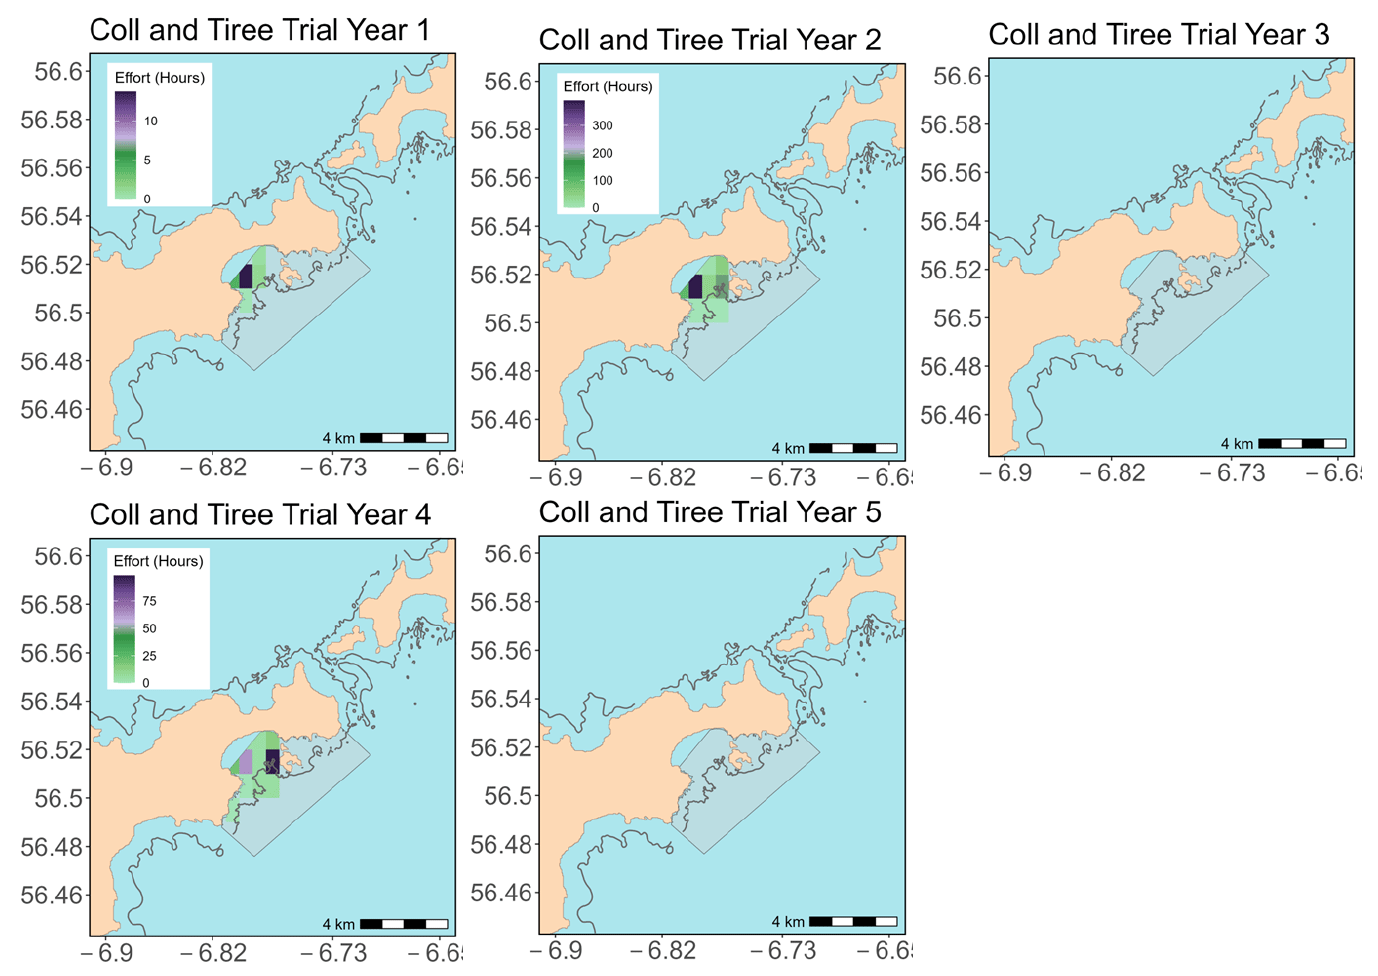
The fishing footprint was small in Trial Year 1 with the two unique fishing vessel fishing in only five grid cells for an average of four hours each. Fishing effort over the duration of the trial (Figure A4.11) has been contained within Gott Bay and southwards towards Scarinish with little to no fishing extending deeper than 10 m.
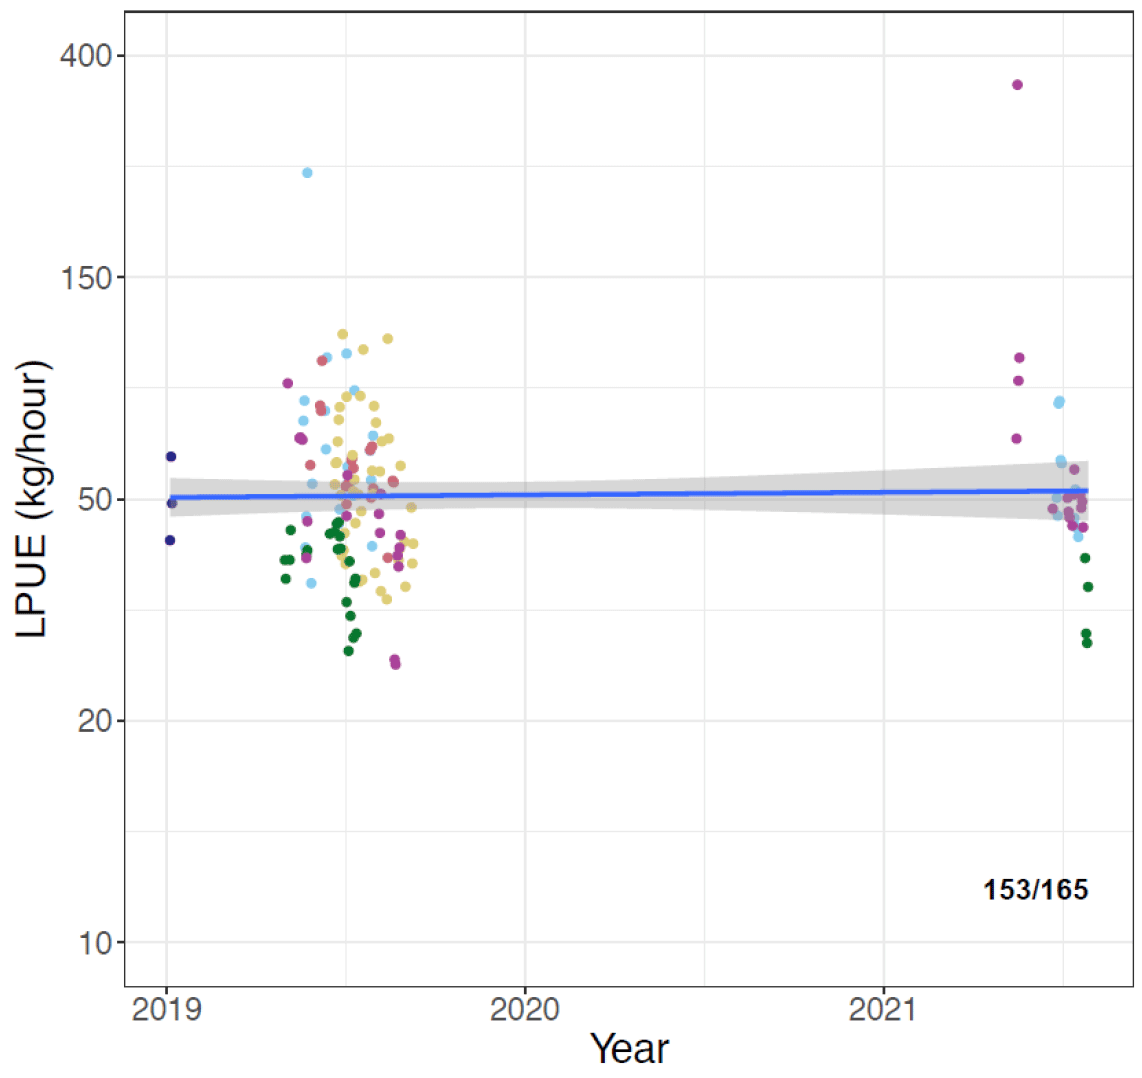
The LPUE estimates for Coll and Tiree have shown very little change over time (~50 kg/hour) (Figure A4.12) however the fishery has been inactive throughout larger periods of the time-series and in comparison, to other trial areas.
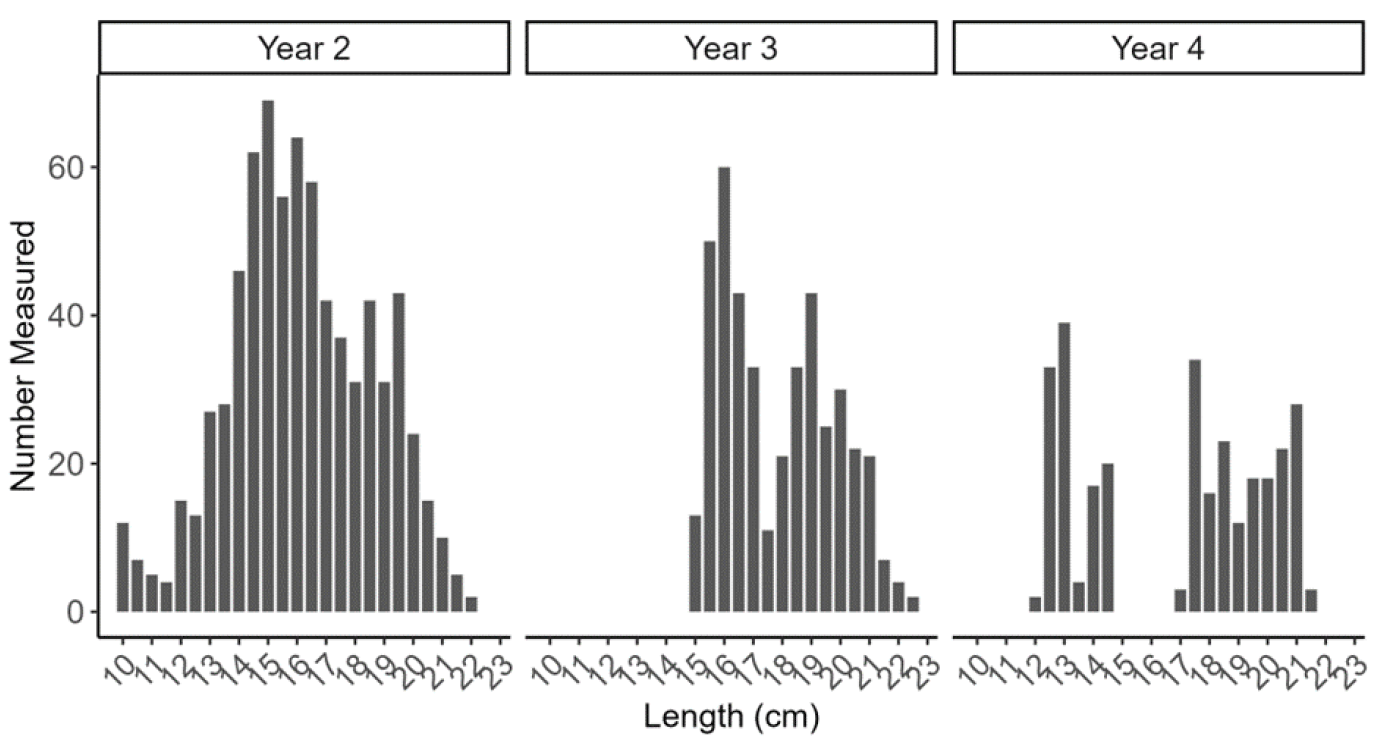
Trial participants and associated processors provided measurements of the lengths of razor clams landed. For Coll and Tiree, a total of 11 self-sample data sheets have been submitted since the start of the trial to January 2023 (Table A4.7). Lengths of the landed razor clams sampled were between 11 and 22.5 cm (Figure A4.13) with the highest number of samples (and measurements) submitted in year 2.
| Year 1 | Year 2 | Year 3 | Year 4 | Year 5 | |
|---|---|---|---|---|---|
| Feb | - | - | - | - | - |
| Mar | - | - | - | - | - |
| Apr | - | 1 | - | - | - |
| May | - | 2 | - | - | - |
| Jun | - | 3 | - | 1 | - |
| Jul | - | 1 | - | 1 | - |
| Aug | - | 1 | - | - | - |
| Sep | - | - | - | - | - |
| Oct | - | - | - | - | - |
| Nov | - | - | - | - | - |
| Dec | - | - | - | - | - |
| Jan | 1 | - | - | - | - |
| Total | 1 | 8 | 0 | 2 | 0 |
4.2.3 Trial Area 7 Colonsay
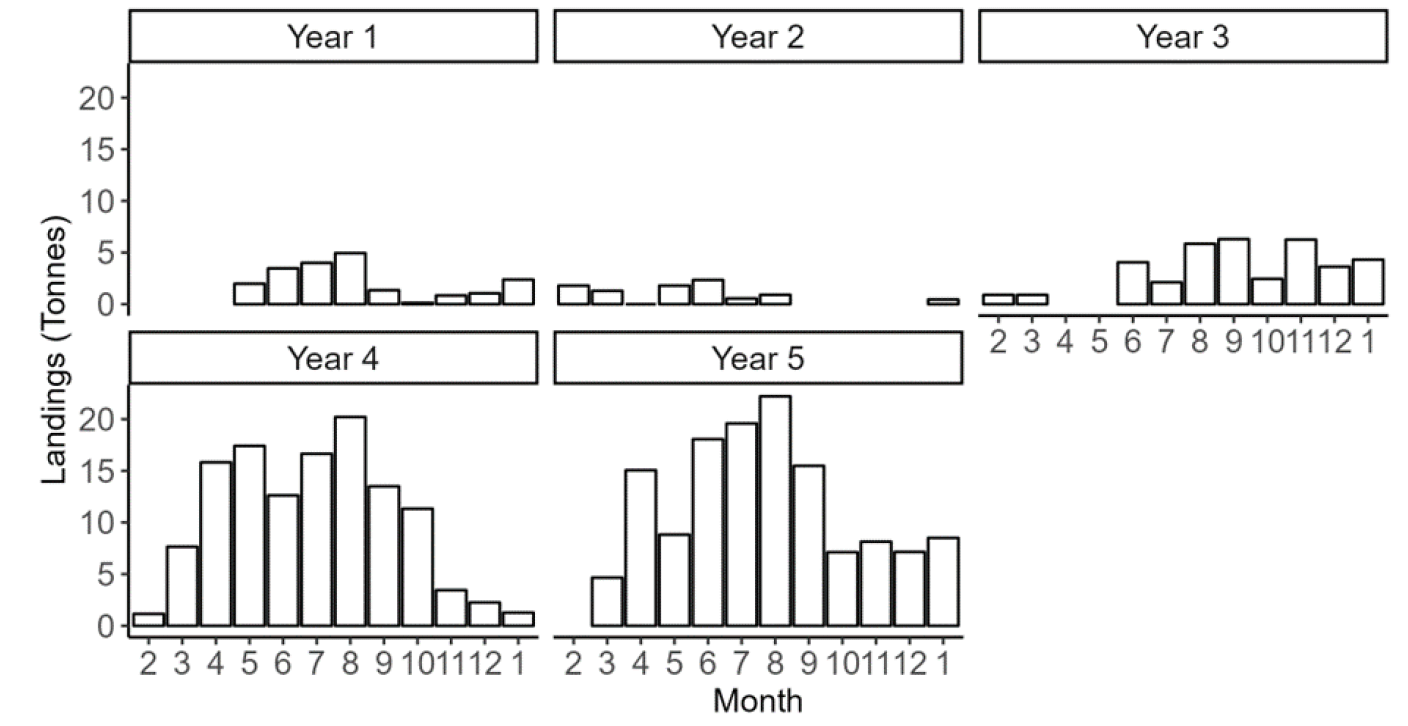
Annual landings of razor clams in the Colonsay trial area have fluctuated between 9.2-134.8 t (Table A4.8; Figure A4.14). The reported landings were highest in Year 5 with the highest reported landings (>20 t) for any single month in the trial period occurring in August of Year 5 (Figure A4.14).
| Year 1 | Year 2 | Year 3 | Year 4 | Year 5 | |
|---|---|---|---|---|---|
| Landings (source: logbook) | |||||
| Landings (t) | 20.1 | 9.2 | 36.8 | 123.3 | 134.8 |
| Average daily landings (kg) | 347 | 362 | 432 | 433 | 408 |
| Effort (source: electronic monitoring) | |||||
| Number of vessels | 4 | 3 | 3 | 6 | 7 |
| Total effort (days) | 64 | 27 | 85 | 341 | 357 |
| Mean fishing duration (hrs per day) | 7.8 | 6.8 | 5 | 5.6 | 5.7 |
| Fishing footprint (number of c-squares) | 8 | 7 | 8 | 27 | 15 |
| Mean fishing intensity (hrs per c-square) | 3.09 | 7.9 | 51.7 | 68.8 | 134 |
| Fishing intensity range (hrs per c-square) | 0.87-7.4 | 0.18-27.2 | 0.07-124 | 0.05-448 | 0.07-412 |
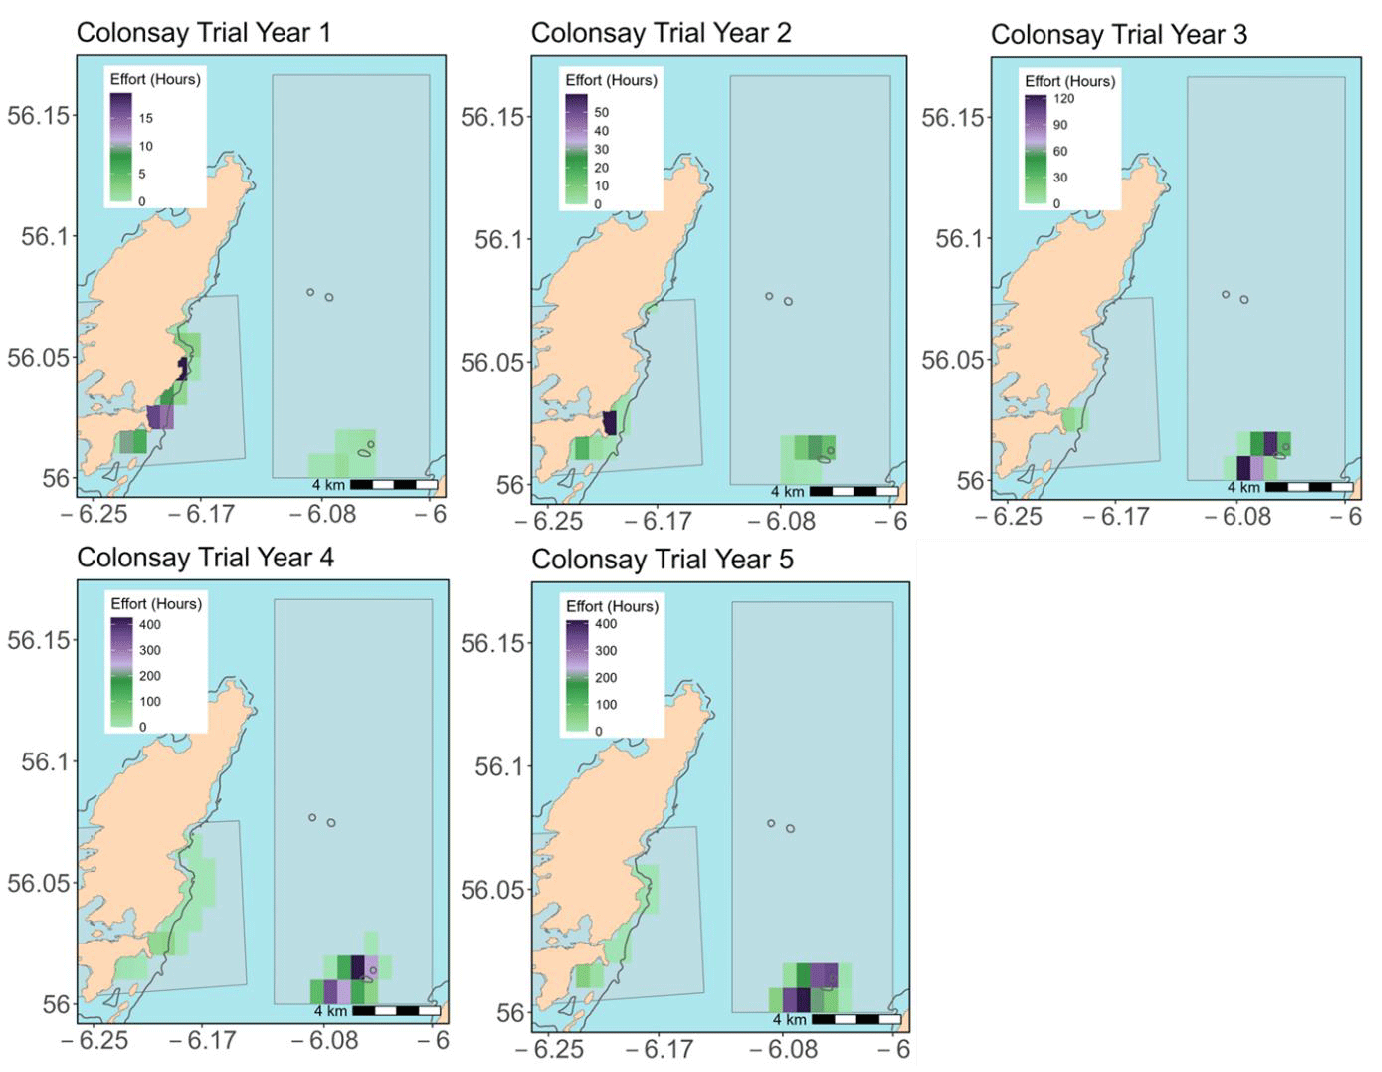
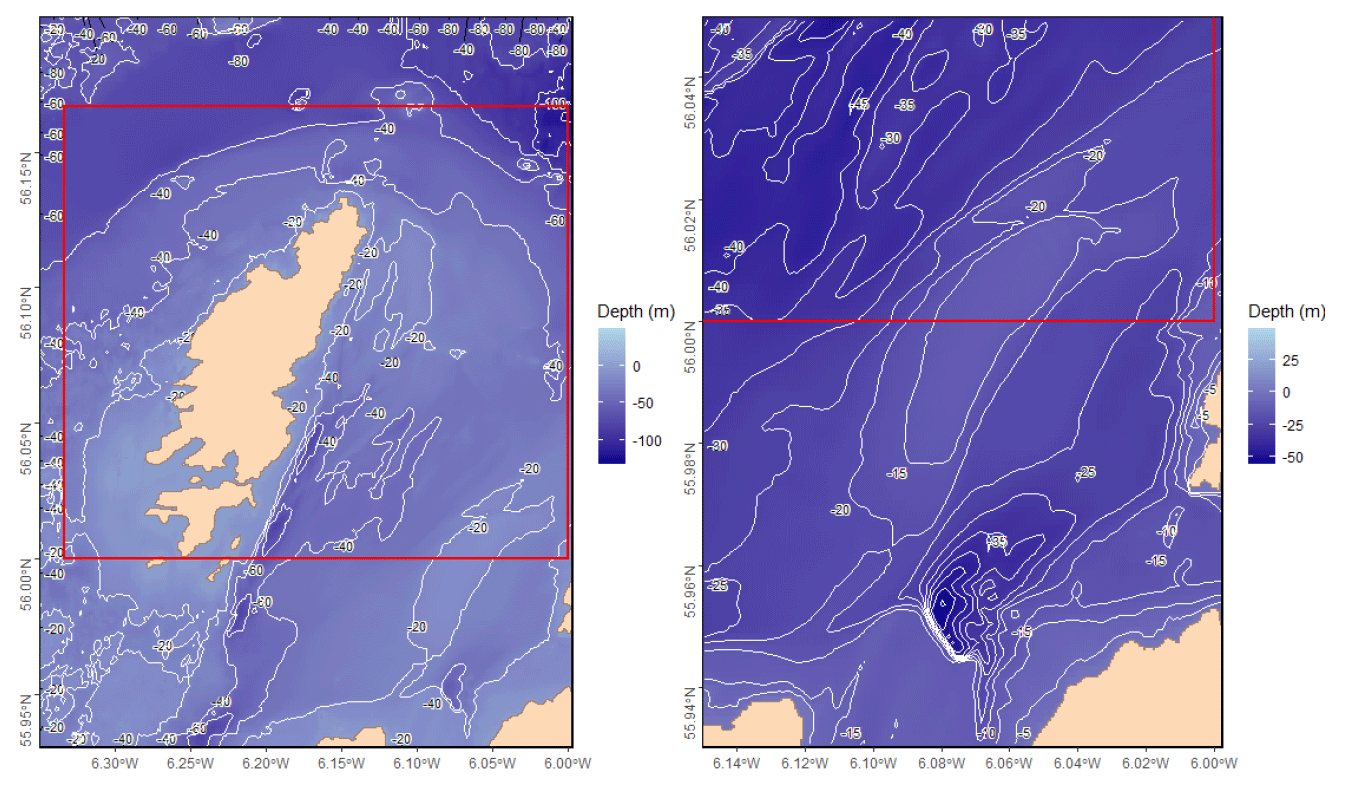
The spatial distribution of the fishery shows that there is both an inshore fishery, along the south eastern coastline of Colonsay extending along Oronsay, and an offshore fishery at the Tarbert bank (Figure A4.15) The area fished at the bank is at depths greater than 10 m but shallower than 20 m (Figures A4.16). Over the years of the time-series, the extent of both of these fishing areas has fluctuated as shown by the number of grid cells fished (10-29). This trial area is of particular interest as fishers have requested a change to the trial area boundary. Future surveys are planned for this trial area to investigate razor clam density on the Tarbert bank.
The LPUE estimates for the Colonsay trial area show an increasing trend (Figure A4.17), with both the values for vessels who have fished throughout the time-series and new entrants to the trial area having high LPUEs in 2021-22. The linear regression model trendline suggests an increase from ~50 to 120 kg per hour with the time variable explaining 25% of the variation in the LPUE value.
Trial participants and associated processors provided measurements of the lengths of razor clams landed. For Colonsay, a total of 54 self-sample data sheets have been submitted since the start of the trial to January 2023 (Table A4.9). Lengths of the landed razor clams sampled were between 10.5 and 23cm (Figure A4.18) with the highest number of samples (and measurements) submitted in Year 5.
| Year 1 | Year 2 | Year 3 | Year 4 | Year 5 | |
|---|---|---|---|---|---|
| Feb | - | 1 | 2 | - | - |
| Mar | - | 1 | - | 3 | 1 |
| Apr | - | - | - | 3 | 5 |
| May | - | - | - | 2 | 2 |
| Jun | - | - | - | 4 | 2 |
| Jul | - | - | 1 | 1 | 1 |
| Aug | - | - | 1 | 2 | 6 |
| Sep | - | - | 1 | - | 3 |
| Oct | - | - | 1 | 1 | - |
| Nov | - | - | 1 | 2 | 2 |
| Dec | - | - | - | - | 2 |
| Jan | - | - | - | - | 3 |
| Total | 0 | 2 | 7 | 18 | 27 |
4.3 Zone 3 West coast SW
The West coast SW zone includes three trial areas: Gigha, Firth of Clyde and Wigtown Bay. Twelve vessels have derogations to fish for razor clams in the West coast SW zone (Table A4.10). A total of 13 unique vessels have been detected fishing in this zone using EM (two vessels left the trial and were replaced in the same year).
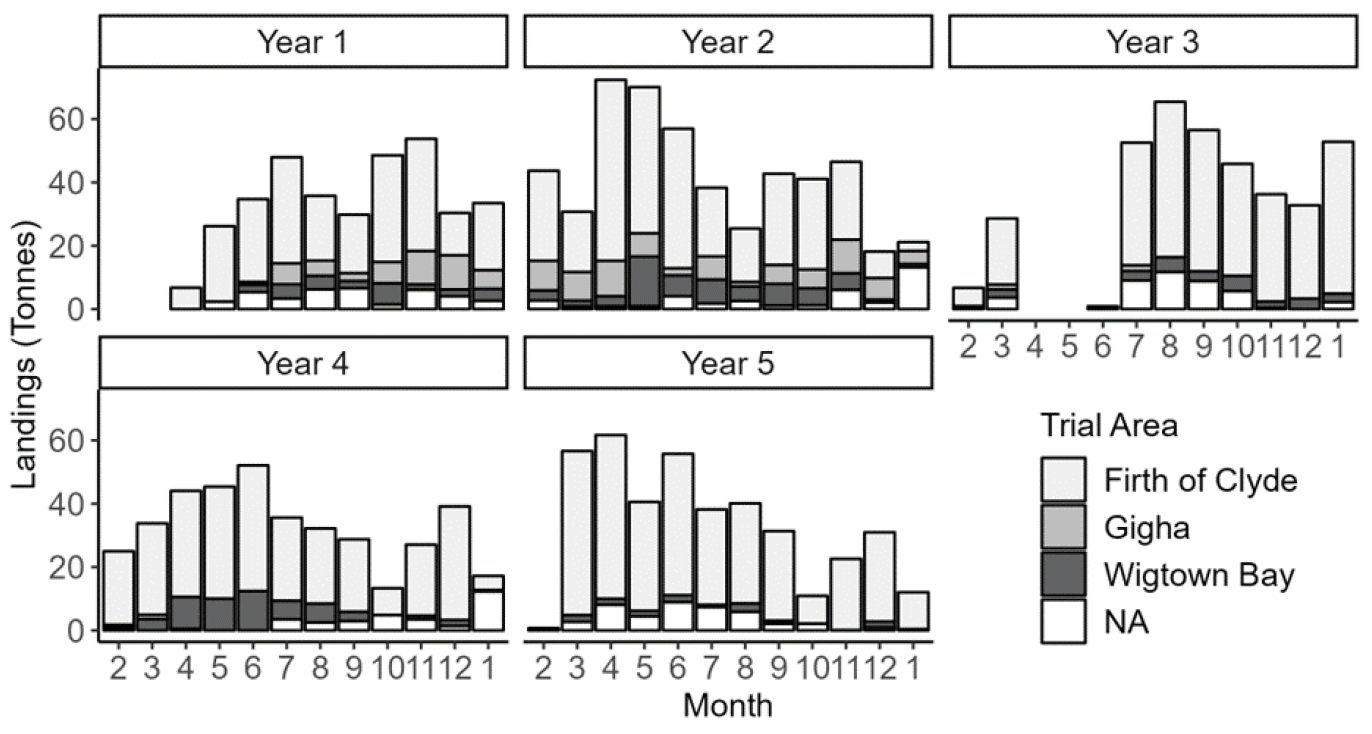
The total annual landings for the West coast SW zone have fluctuated between 309.2 and 469.8 t, with the highest total landings in Year 2 (Table A4.10). The Firth of Clyde is the trial area with the highest landings in the West coast SW zone landing over 80% of the total landings for the West Coast SW zone. The landings by month show some bimodality, with peaks in both early summer and autumn. In 2020 (Year 3) in the months following the covid suspension of the fishery (March-June) there were consistently high landings in all months to the end of the year (Figure A4.19). 9% (193t) of landings associated with fishing in the West Coast SW zone had no trial area assigned.
| Year 1 | Year 2 | Year 3 | Year 4 | Year 5 | Total | |
|---|---|---|---|---|---|---|
| Firth of Clyde | 232.9 | 326.9 | 306.8 | 304.8 | 344.6 | 1516 |
| Gigha | 48.8 | 81.4 | 3.3 | 1.8 | - | 135.3 |
| Wigtown Bay | 27.5 | 61.5 | 25.9 | 54.7 | 14.3 | 183.9 |
| Total | 309.2 | 469.8 | 336 | 361.3 | 358.9 | 1835.2 |
4.3.1 Trial Area 8 Gigha
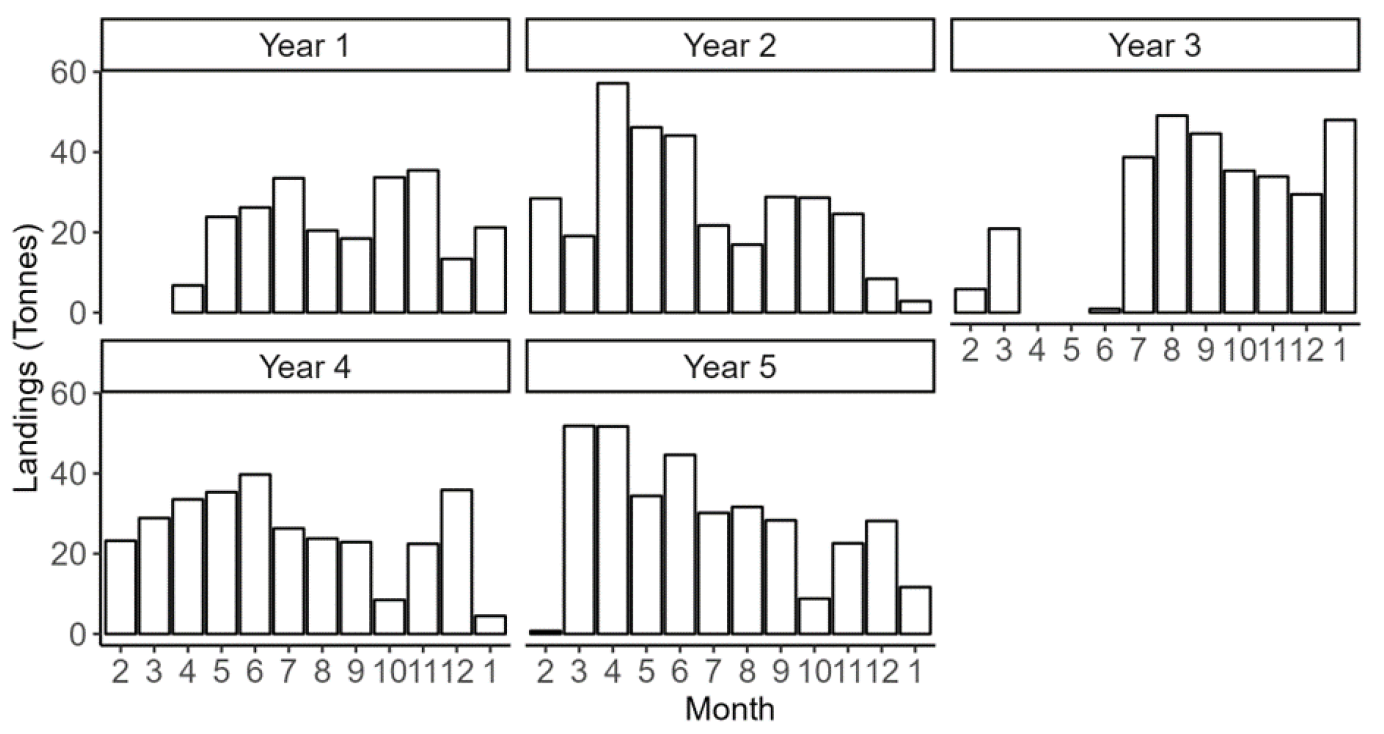
Annual landings of razor clams from the Gigha trial area have fluctuated between 1.8- 81.4 t (Table A4.11; Figure A4.20) with landings in Years 3 and 4 of the trial extremely low (3.3 and 1.8 t) in comparison to both Year 1 and 2 (48.8 and 81 t respectively). At the time of reporting there had been no fishing activity or reported landings in Year 5. The Gigha trial area appears to show lower landings in the summer months compared to the winter months, which is an opposing trend to the landing seasonality seen in most other trial areas.
| Year 1 | Year 2 | Year 3 | Year 4 | Year 5 | |
|---|---|---|---|---|---|
| Landings (source: logbook) | |||||
| Landings (t) | 48.8 | 81.4 | 3.3 | 1.8 | - |
| Average daily landings (kg) | 431 | 430 | 418 | 450 | - |
| Effort (source: electronic monitoring) | |||||
| Number of vessels | 2 | 2 | 2 | 1 | - |
| Total effort (days) | 116 | 192 | 8 | 4 | - |
| Mean fishing duration (hrs per day) | 8.3 | 8.5 | 6.5 | 5.8 | - |
| Fishing footprint (number of c-squares) | 40 | 48 | 10 | 19 | - |
| Mean fishing intensity (hrs per c-square) | 31.9 | 34.7 | 5.21 | 1.42 | - |
| Fishing intensity range (hrs per c-square) | 0.08-166 | 0.02-299 | 0.8-12.0 | 0.05-14 | - |
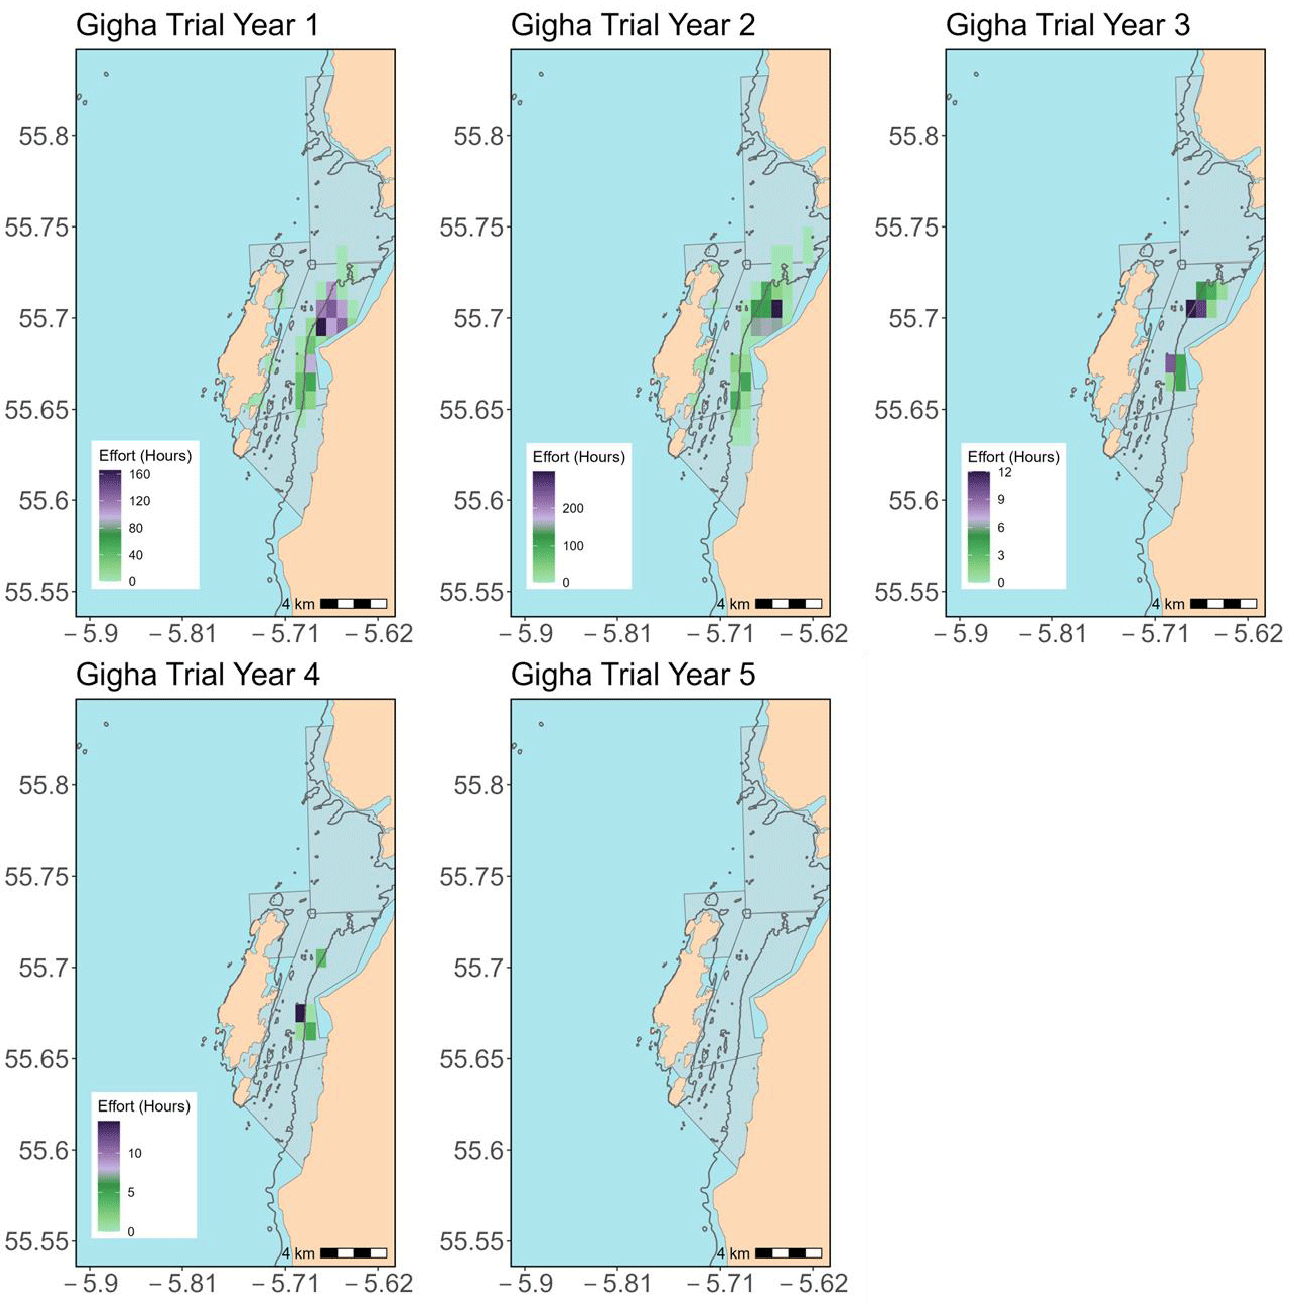
Fishing effort within the trial area has occurred primarily along the mainland east of the Isle of Gigha (Figure A4.21). The spatial footprint of the fishery decreased in Years 3 and 4 (10, and 19 c-squares fished respectively) in comparison Years 1 and 2. This reflects the large reduction in effort (days) and averaged fishing intensity (hrs per c-square) (Table A4.11).
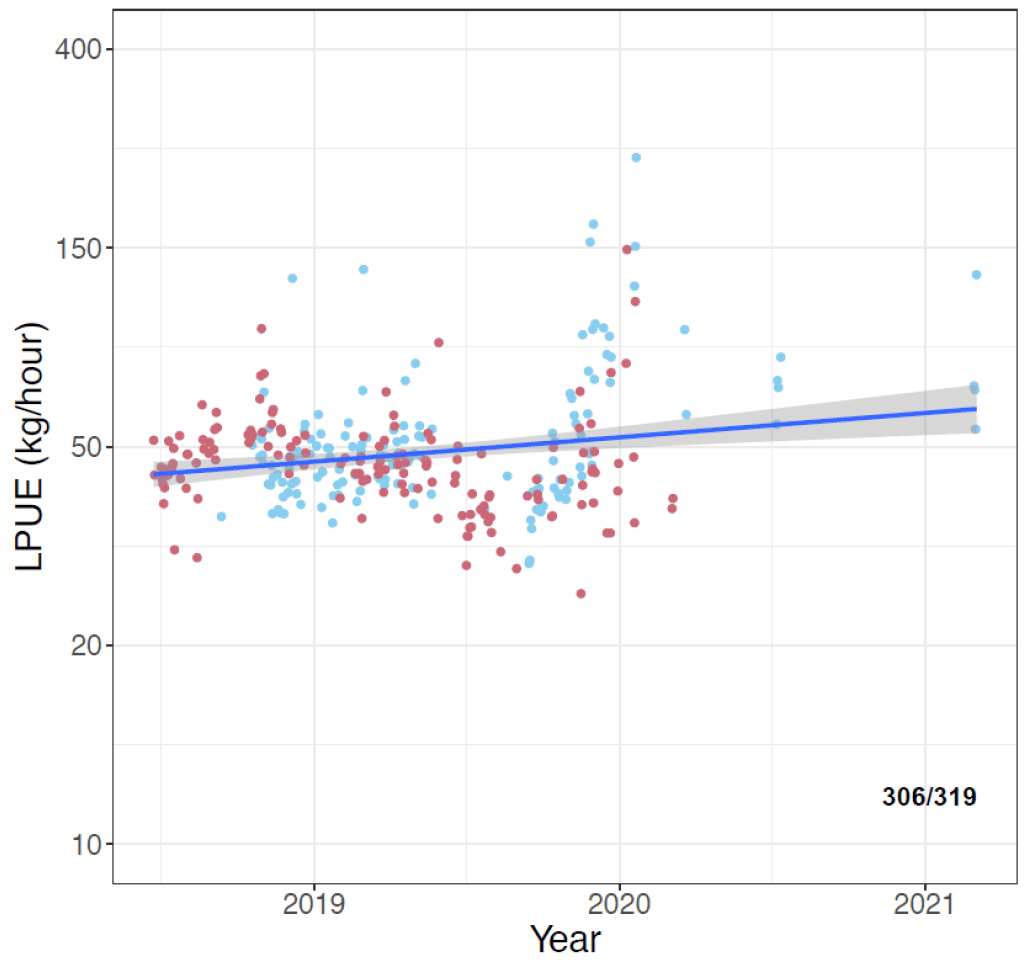
The LPUE trend for the Gigha trial area appears to be stable throughout the time-series at ~50 kg per (Figure A4.22) hour, although there was minimal activity in 2020-2021 so the confidence around the stability of the LPUE in the more recent period is less certain.
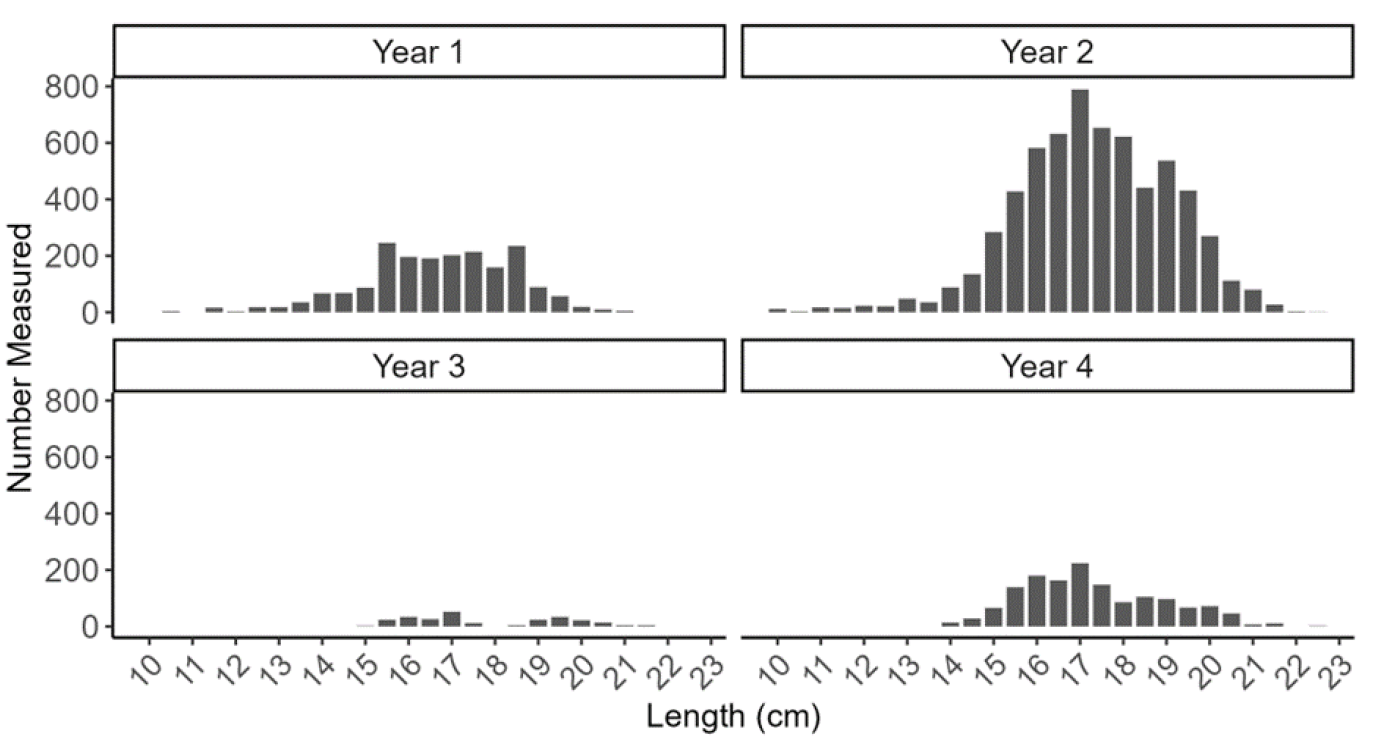
Trial participants and associated processors provided measurements of the lengths of razor clams landed. For Gigha, a total of 41 self-sample data sheets have been submitted since the start of the trial to January 2023 (Table A4.12). Lengths of the landed razor clams sampled were between 10 and 22.5 cm (Figure A4.23) with the highest number of samples (and measurements) submitted in Year 2.
| Year 1 | Year 2 | Year 3 | Year 4 | Year 5 | |
|---|---|---|---|---|---|
| Feb | - | 5 | - | 1 | - |
| Mar | - | 4 | - | 1 | - |
| Apr | - | 2 | - | - | - |
| May | - | 3 | - | - | - |
| Jun | - | - | - | - | - |
| Jul | - | 2 | 1 | - | - |
| Aug | - | 1 | - | - | - |
| Sep | - | 2 | - | 1 | - |
| Oct | 1 | 2 | - | 3 | - |
| Nov | 4 | 2 | - | - | - |
| Dec | - | 2 | - | - | - |
| Jan | 3 | 1 | - | - | - |
| Total | 8 | 26 | 1 | 6 | 0 |
4.3.2 Trial Area 9 Firth of Clyde
In the Firth of Clyde trial area, a maximum of 12 unique vessels used their derogation to fish razor clams in any year. The total effort per year ranged from 561 to 851 days and vessels reported an average daily landing of 422 kg (average over the five trial years) (Table A4.13). The daily landings for this trial area have remained consistent with a variation in landings of 24 kg over the five year trial period. The average fishing duration has also remained consistent with a range of 5.6 to 6.6 hours per day.
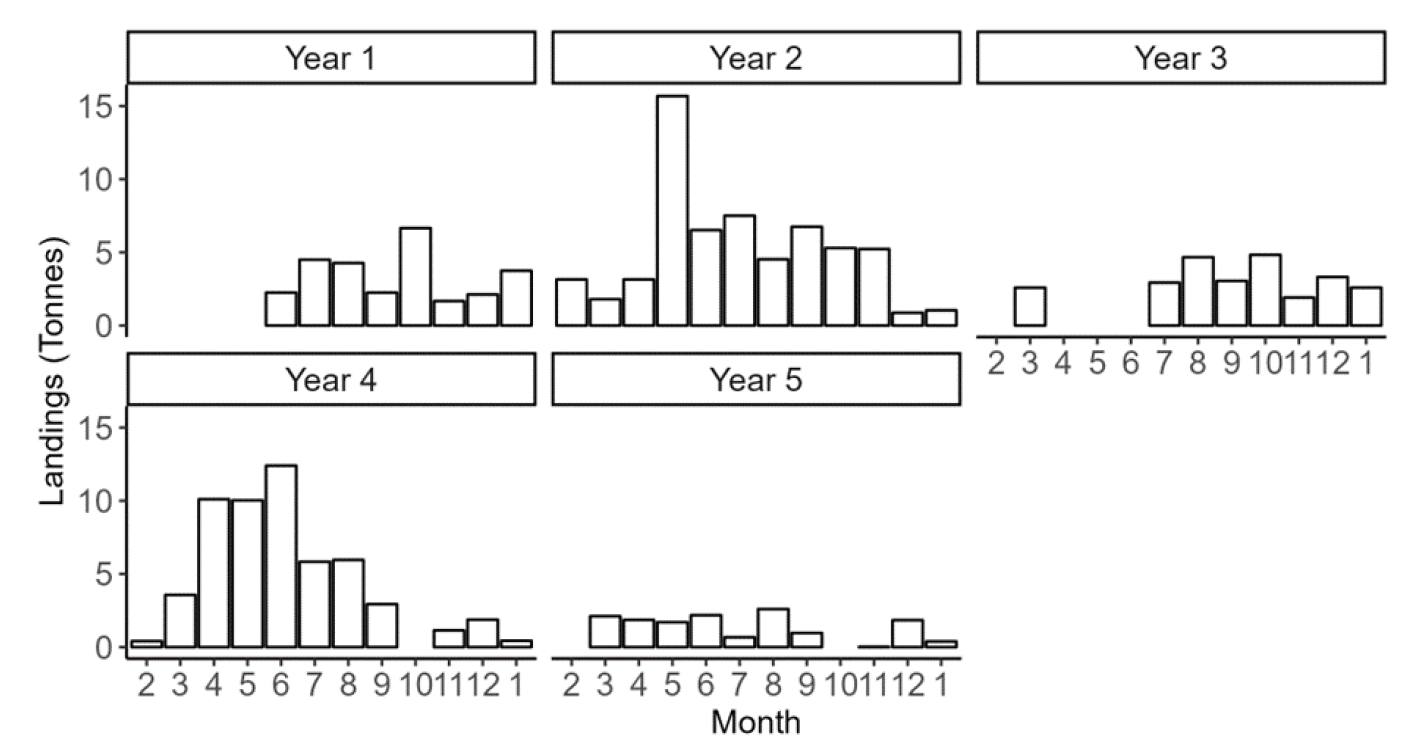
Annual landings of razor clams in the Firth of Clyde trial area have fluctuated between 232.9 -344.6 t (Table A4.12; Figure A4.24) and are the highest of any trial area in any zone. The highest reported landings for any month in the trial period were in April of Year 2 with over 50 t landed.
| Year 1 | Year 2 | Year 3 | Year 4 | Year 5 | |
|---|---|---|---|---|---|
| Landings (source: logbook) | |||||
| Landings (t) | 232.9 | 326.9 | 306.8 | 304.8 | 344.6 |
| Average daily landings (kg) | 423 | 428 | 425 | 430 | 406 |
| Effort (source: electronic monitoring) | |||||
| Number of vessels | 11 | 10 | 10 | 12 | 10 |
| Total effort (days) | 561 | 786 | 787 | 784 | 851 |
| Mean fishing duration (hrs per day) | 5.6 | 5.7 | 5.7 | 5.8 | 6.6 |
| Fishing footprint (number of c-squares) | 182 | 151 | 146 | 149 | 138 |
| Mean fishing intensity (hrs per c-square) | 17.7 | 28.6 | 34.6 | 34.3 | 46 |
| Fishing intensity range (hrs per c-square) | 0.02-186 | 0.02-397 | 0.07-292 | 0.02-243 | 0.05-302 |
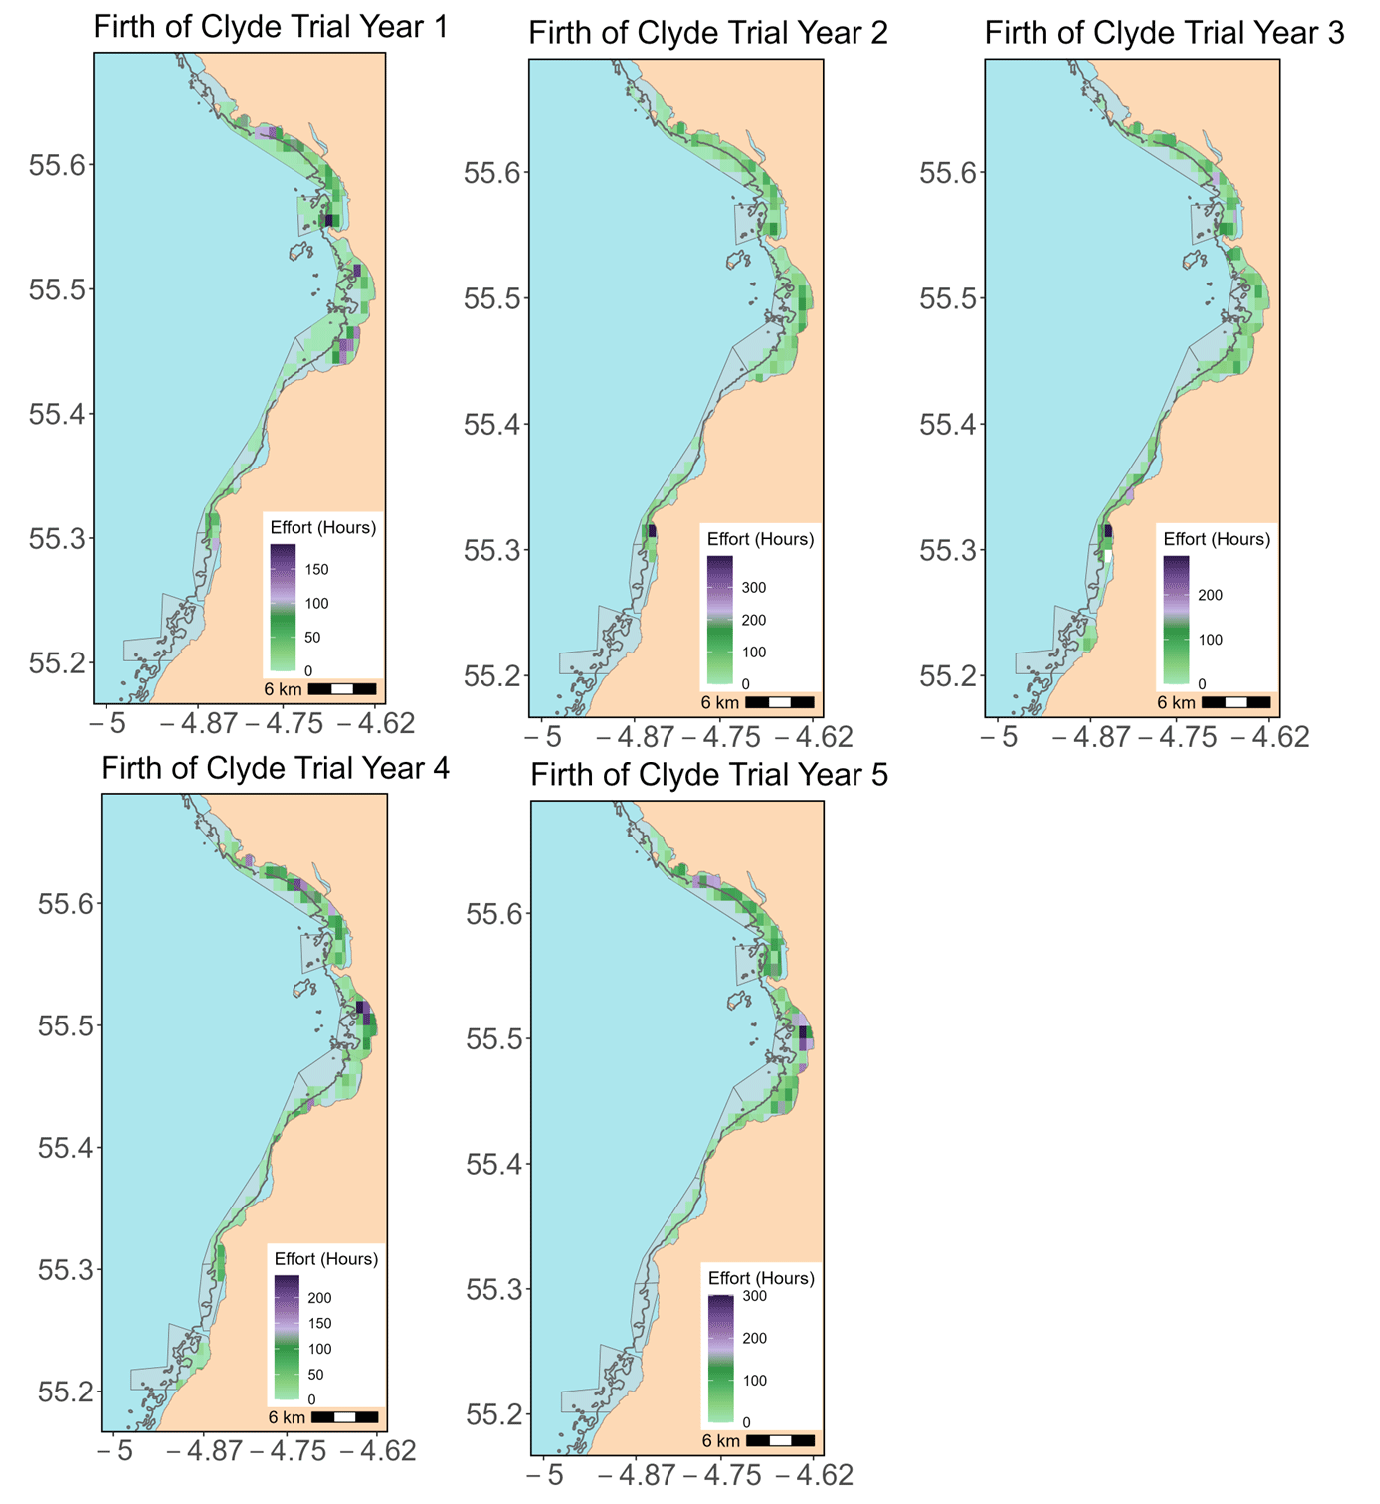
The spatial distribution of fishing activity within the Firth of Clyde trial area indicates that from Ardrossan to Dunure almost all the waters shallower than 10 m are fished. With the northern part of the classified waters also fished out to the seaward boundary beyond this depth. In Years 3 and 4 the fishing footprint extended further south (Figure A4.25).
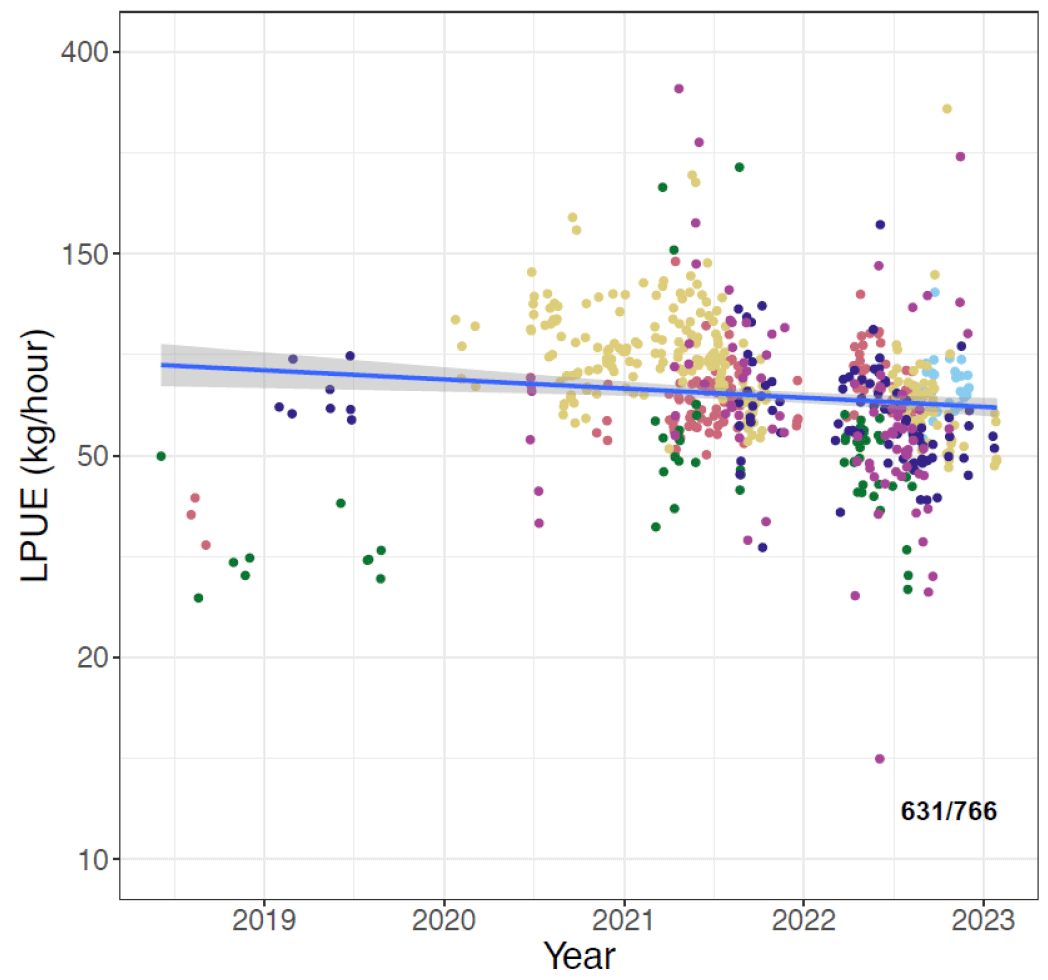
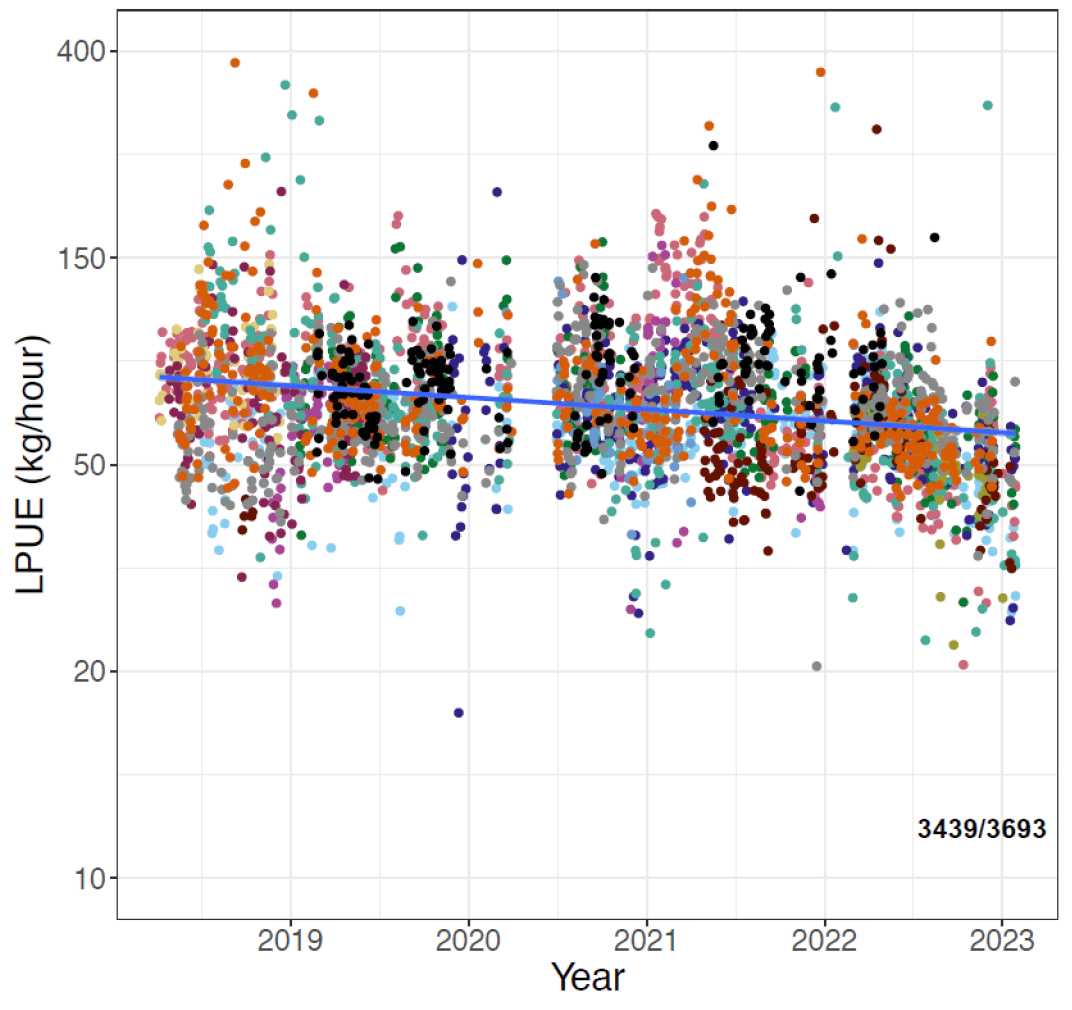
The variability of LPUE estimates for the Firth of Clyde trial area have remained consistent throughout the trial period with LPUEs commonly within the 50-125 kg per hour range (Figure A4.26). This trial area has the highest number of active vessels of all the areas, the majority of which have remained active within this trial area throughout the five year trial period, generating a large quantity of LPUE estimates.
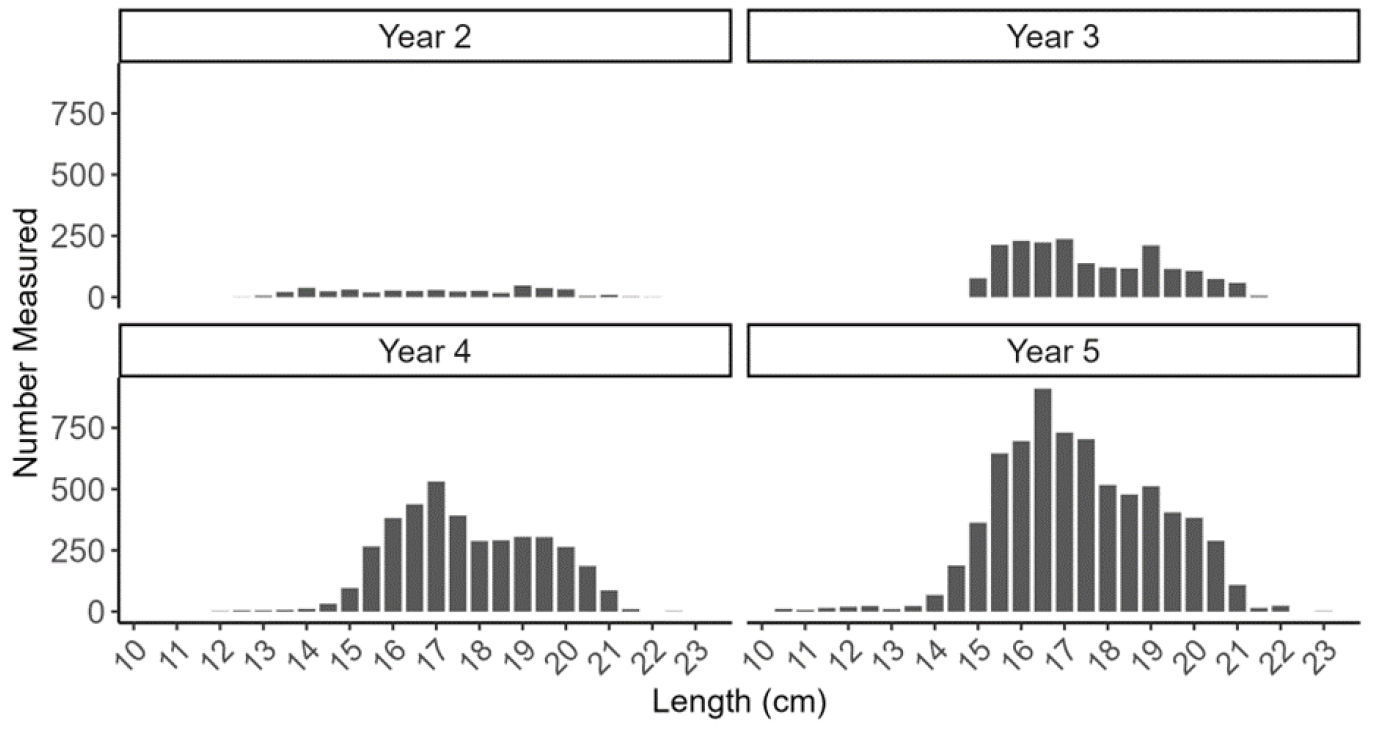
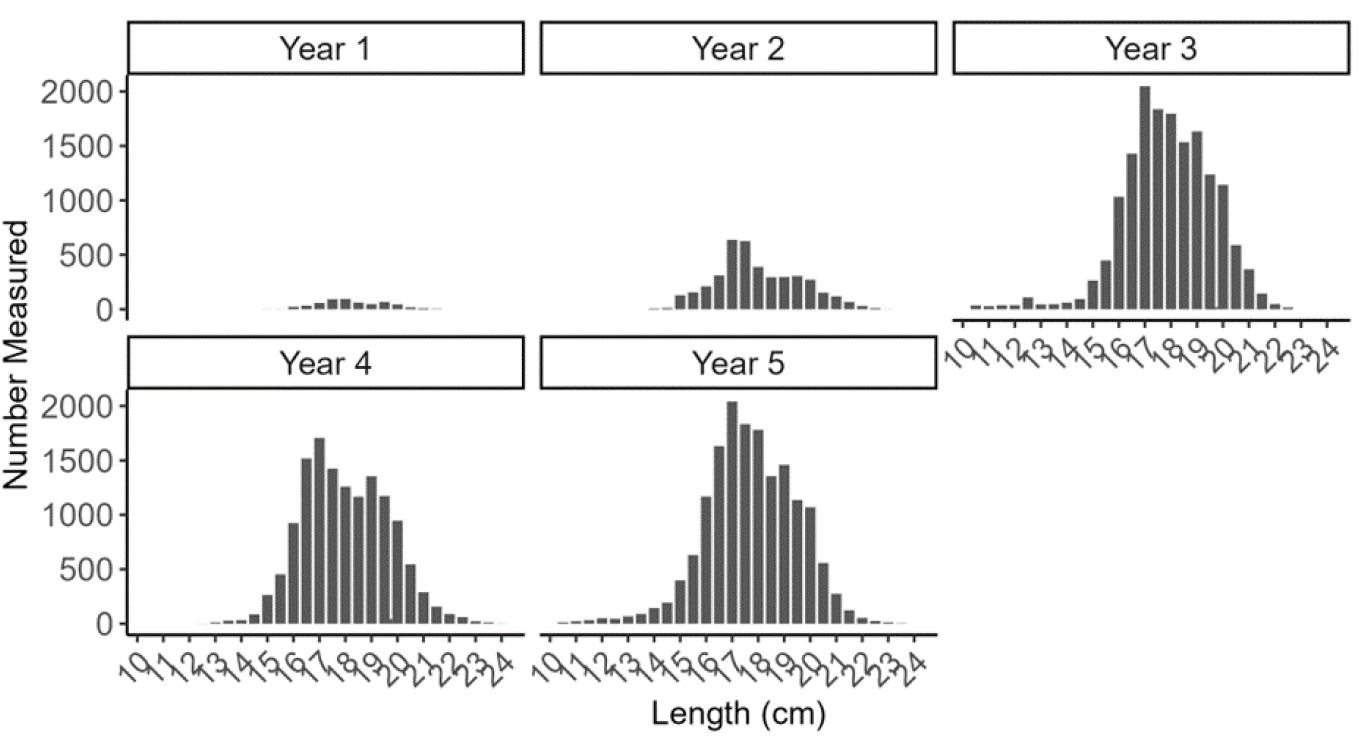
Trial participants and associated processors provided measurements of the lengths of razor clams landed. For the Firth of Clyde, a total of 235 self-sample data sheets have been submitted since the start of the trial to January 2023 (Table A4.14). Lengths of the landed razor clams sampled were between 10.5 and 23.5 cm (Figure A4.27) with the highest number of samples (and measurements) submitted in year 5.
| Year 1 | Year 2 | Year 3 | Year 4 | Year 5 | |
|---|---|---|---|---|---|
| Feb | - | - | 2 | 6 | - |
| Mar | - | - | 2 | 8 | 13 |
| Apr | - | - | - | 5 | 13 |
| May | - | - | - | 4 | 4 |
| Jun | - | 1 | - | 7 | 8 |
| Jul | - | 4 | 6 | 1 | 5 |
| Aug | - | 2 | 16 | 9 | 4 |
| Sep | 1 | 1 | 17 | 8 | 7 |
| Oct | - | 3 | 8 | 2 | 4 |
| Nov | - | 4 | 10 | 7 | 8 |
| Dec | 1 | 1 | 5 | 2 | 6 |
| Jan | - | 1 | 9 | 5 | 5 |
| Total | 2 | 17 | 75 | 64 | 77 |
4.3.3 Trial Area 10 Wigtown Bay
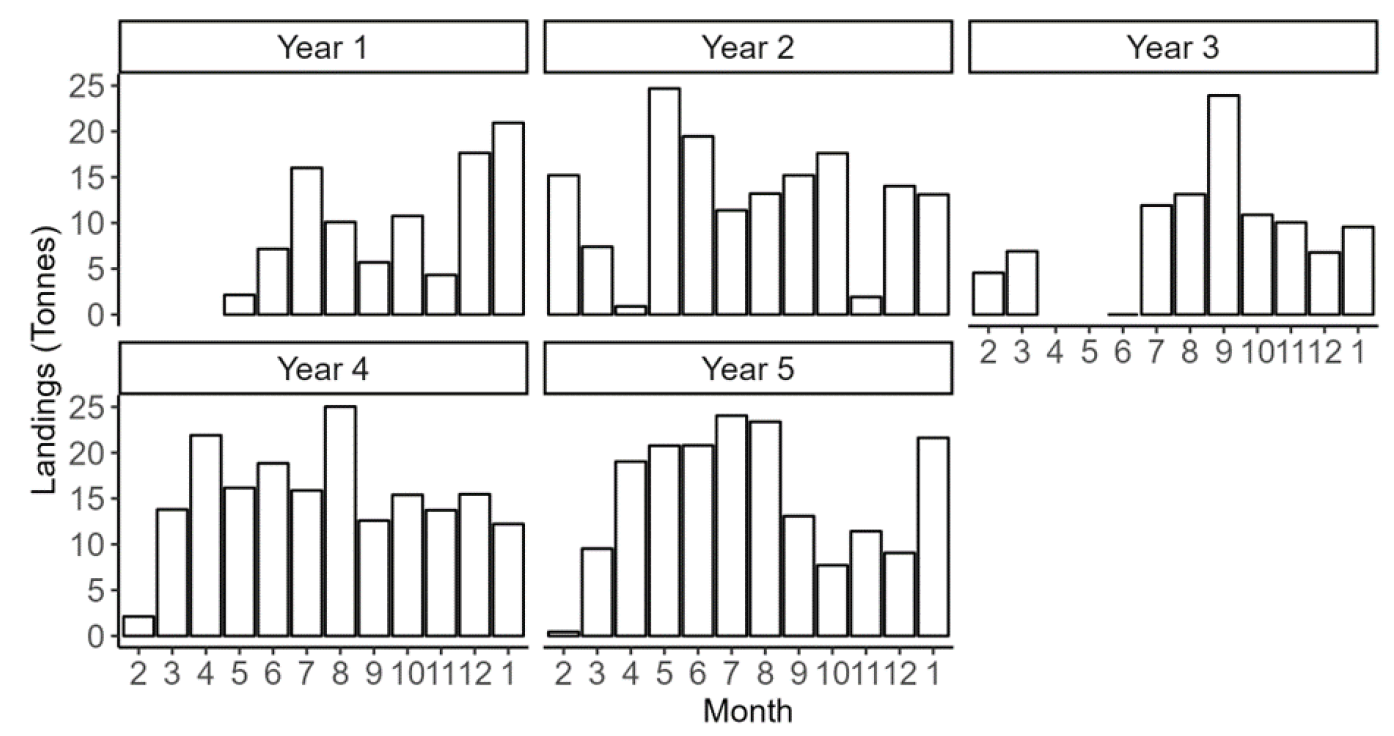
Only two unique vessels have utilised derogations to fish for razor clams in Wigtown Bay in any given year. The total effort allocation used in this area ranged from 43 to 144 days and vessels reported an average daily landing of 402 kg (average over the five trial years) (Table A4.15). Annual landings of razor clams in the Wigtown Bay trial area have fluctuated between 14.3-61.5 t. Reported razor clam landings were highest in Year 2, and the highest reported landings for any month in the trial period were in May of Year 2 with over 15 t landed (Figure A4.28).
| Year 1 | Year 2 | Year 3 | Year 4 | Year 5 | |
|---|---|---|---|---|---|
| Landings (source: logbook) | |||||
| Landings (t) | 27.5 | 61.5 | 25.9 | 54.7 | 14.3 |
| Average daily landings (kg) | 416 | 436 | 424 | 393 | 341 |
| Effort (source: electronic monitoring) | |||||
| Number of vessels | 2 | 2 | 2 | 2 | 1 |
| Total effort (days) | 67 | 144 | 64 | 139 | 43 |
| Mean fishing duration (hrs per day) | 4.3 | 3.6 | 3.9 | 4.7 | 5.2 |
| Fishing footprint (number of c-squares) | 13 | 19 | 12 | 23 | 19 |
| Mean fishing intensity (hrs per c-square) | 19 | 22.3 | 21.3 | 29.6 | 14.2 |
| Fishing intensity range (hrs per c-square) | 0.12-65.4 | 0.13-106 | 0.05-99.8 | 0.22-272 | 0.55-56.1 |
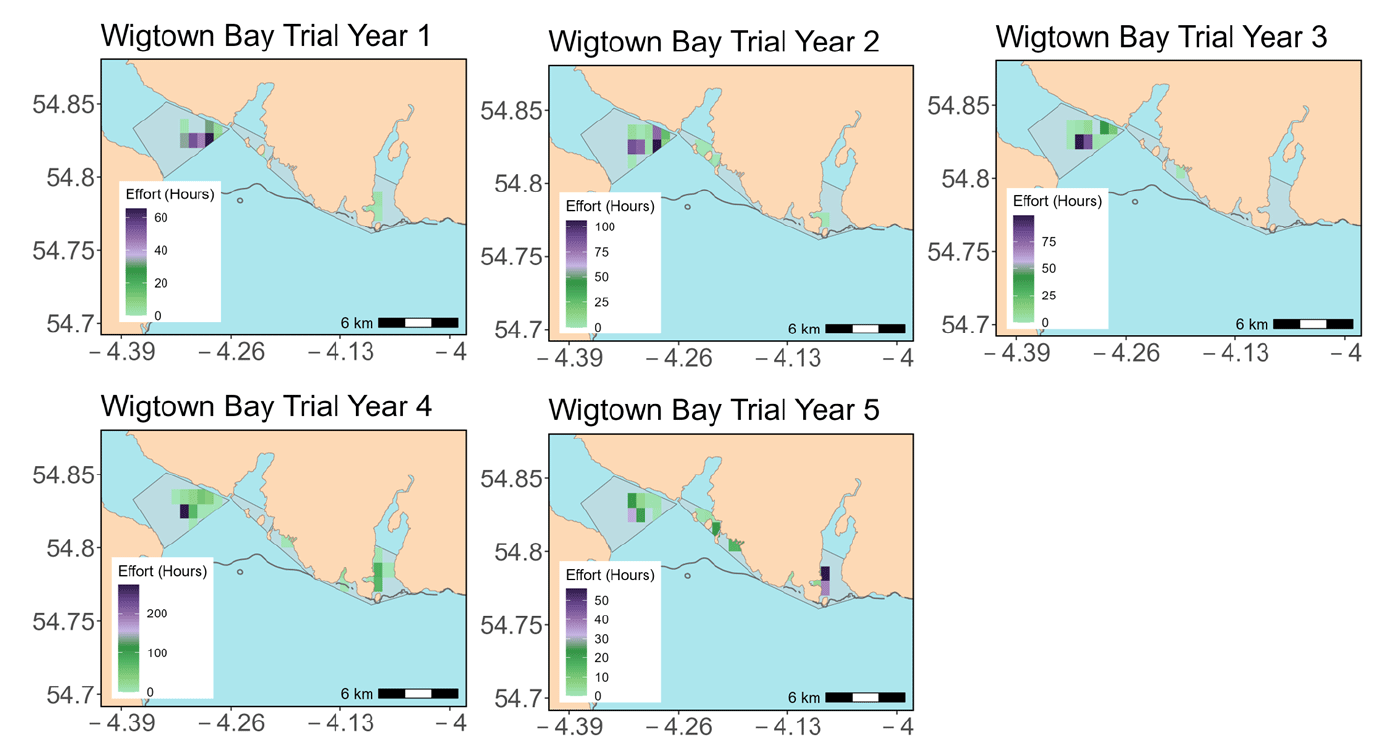
The razor fishery in Wigtown Bay is targeted by two vessels who primarily fish in the north western region of the trial area (Wigtown Bay), but will also fish along the coastline at Fleet Bay and Kirkcudbirght Bay (Figure A4.29). The fishing footprint in the Wigtown Bay trial area has ranged between 12-23 c-squares and occurs on the central and eastern area of the Bay. There is evidence of increasing fishing intensity (hrs per c-square) and increasing maximum fishing intensity per c-square throughout the time-series, except for Year 3 which was similar to Year 2 values as opposed to increasing (Table A4.15). This was likely due to the closure of the fishery in April-June 2020 as a result of COVID-19 measures which prevented fishing in what would have been the most active period of the year.
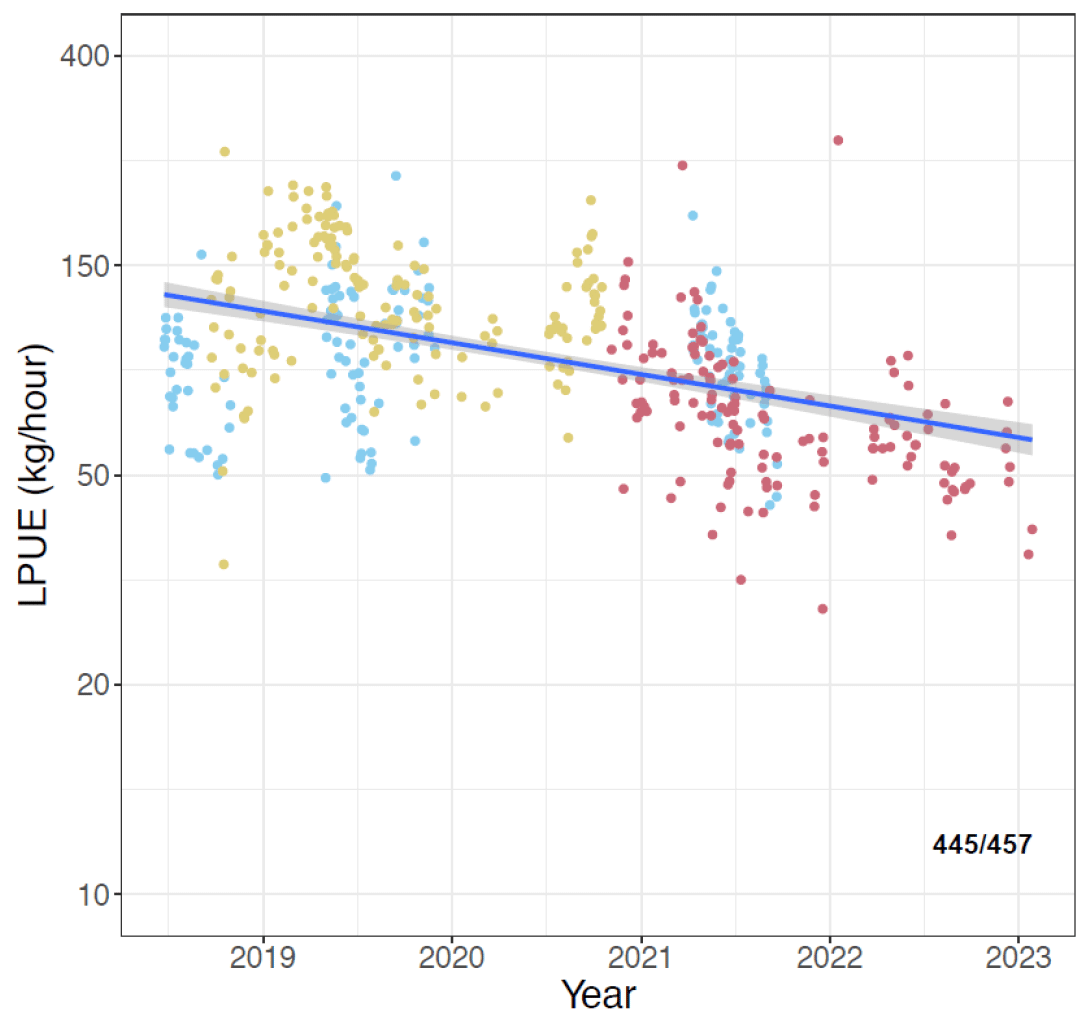
The LPUE estimates for Wigtown Bay in the early period of the trial (2019) were quite high (~125-150 kg per hour) (Figure A4.30) in comparison to many of the other trial areas. However, the linear regression line of best fit appears to show a decline, albeit statistically very weak. This may be due to a new vessel having entered the fishery (shown in green in Figure A4.30) which has lower LPUE values than the two established vessels within the trial area.
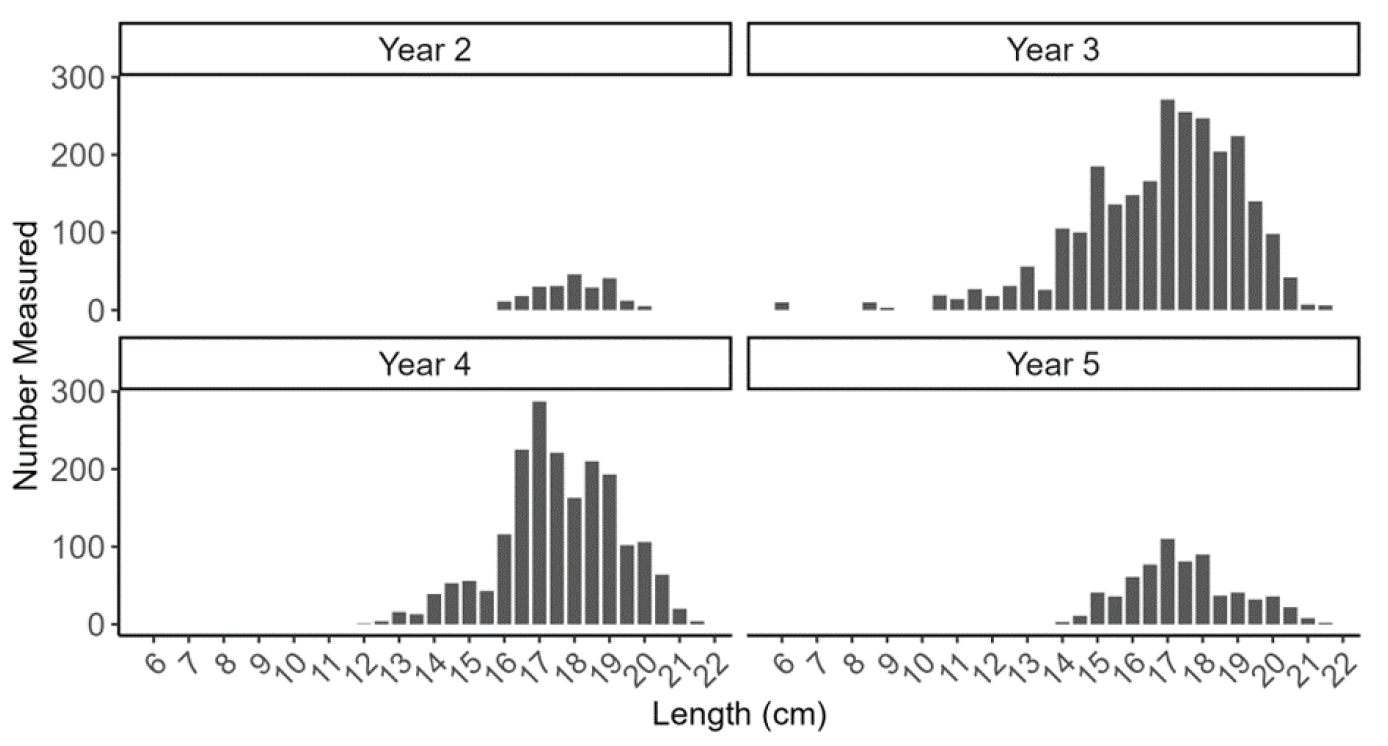
Trial participants and associated processors provided measurements of the lengths of razor clams landed. For Wigtown Bay, a total of 22 self-sample data sheets have been submitted since the start of the trial to January 2023 (Table A4.16). Lengths of the landed razor clams sampled were between six and 21.5 cm (Figure A4.31) with the highest number of samples (and measurements) submitted in Trial Year 3. The small razor clams that were sampled in Year 3 were due to a request for fishers to submit smaller razor clams as part of the live sampling scheme. Fishers were reminded that the self-sampling data are only for the landed portion of the catch.
| Year 1 | Year 2 | Year 3 | Year 4 | Year 5 | |
|---|---|---|---|---|---|
| Feb | - | - | - | - | - |
| Mar | - | - | 1 | 1 | - |
| Apr | - | - | - | - | 1 |
| May | - | - | - | 1 | 1 |
| Jun | - | - | - | 3 | - |
| Jul | - | - | 1 | 1 | - |
| Aug | - | - | 3 | 2 | - |
| Sep | - | - | 1 | - | - |
| Oct | - | - | 1 | - | - |
| Nov | - | - | - | - | - |
| Dec | - | - | 1 | - | 1 |
| Jan | - | 2 | 1 | - | - |
| Total | 0 | 2 | 9 | 8 | 3 |
4.4 Zone 4 Firth of Forth
The Firth of Forth zone includes one trial area: Firth of Forth. Four vessels currently hold derogations to fish for razor clams in this zone (Table A4.17). Five unique vessels have been detected fishing in this zone using EM, the additional vessel is explained by one vessel leaving the trial and being replaced in the same year. 7% (53.2 t) of landings associated with fishing in the Firth of Forth zone had no trial area assigned.
4.4.1 Trial Area 11 Firth of Forth
Total effort for the Firth of Forth ranged from 231 to 428 days and vessels reported an average daily landing of 422 kg (average over the five trial years) (Table A4.17). Annual landings of razor clams in the Firth of Forth trial area have fluctuated between 94.8-183.2 t. The reported landings were highest in Year 4 (Figure A4.32).
| Year 1 | Year 2 | Year 3 | Year 4 | Year 5 | |
|---|---|---|---|---|---|
| Landings (source: logbook) | |||||
| Landings (t) | 94.8 | 154.1 | 97.7 | 183.2 | 180.9 |
| Average daily landings (kg) | 417 | 422 | 411 | 433 | 430 |
| Effort (source: electronic monitoring) | |||||
| Number of vessels | 4 | 5 | 4 | 4 | 4 |
| Total effort (days) | 231 | 383 | 272 | 428 | 421 |
| Mean fishing duration (hrs per day) | 4.3 | 4.8 | 5.4 | 6.1 | 6 |
| Fishing footprint (number of c-squares) | 24 | 29 | 33 | 52 | 40 |
| Mean fishing intensity (hrs per c-square) | 33.2 | 55.8 | 52.5 | 52.3 | 73.1 |
| Fishing intensity range (hrs per c-square) | 0.25-257 | 0.08-515 | 0.27-259 | 0.07-570 | 0.3-463 |
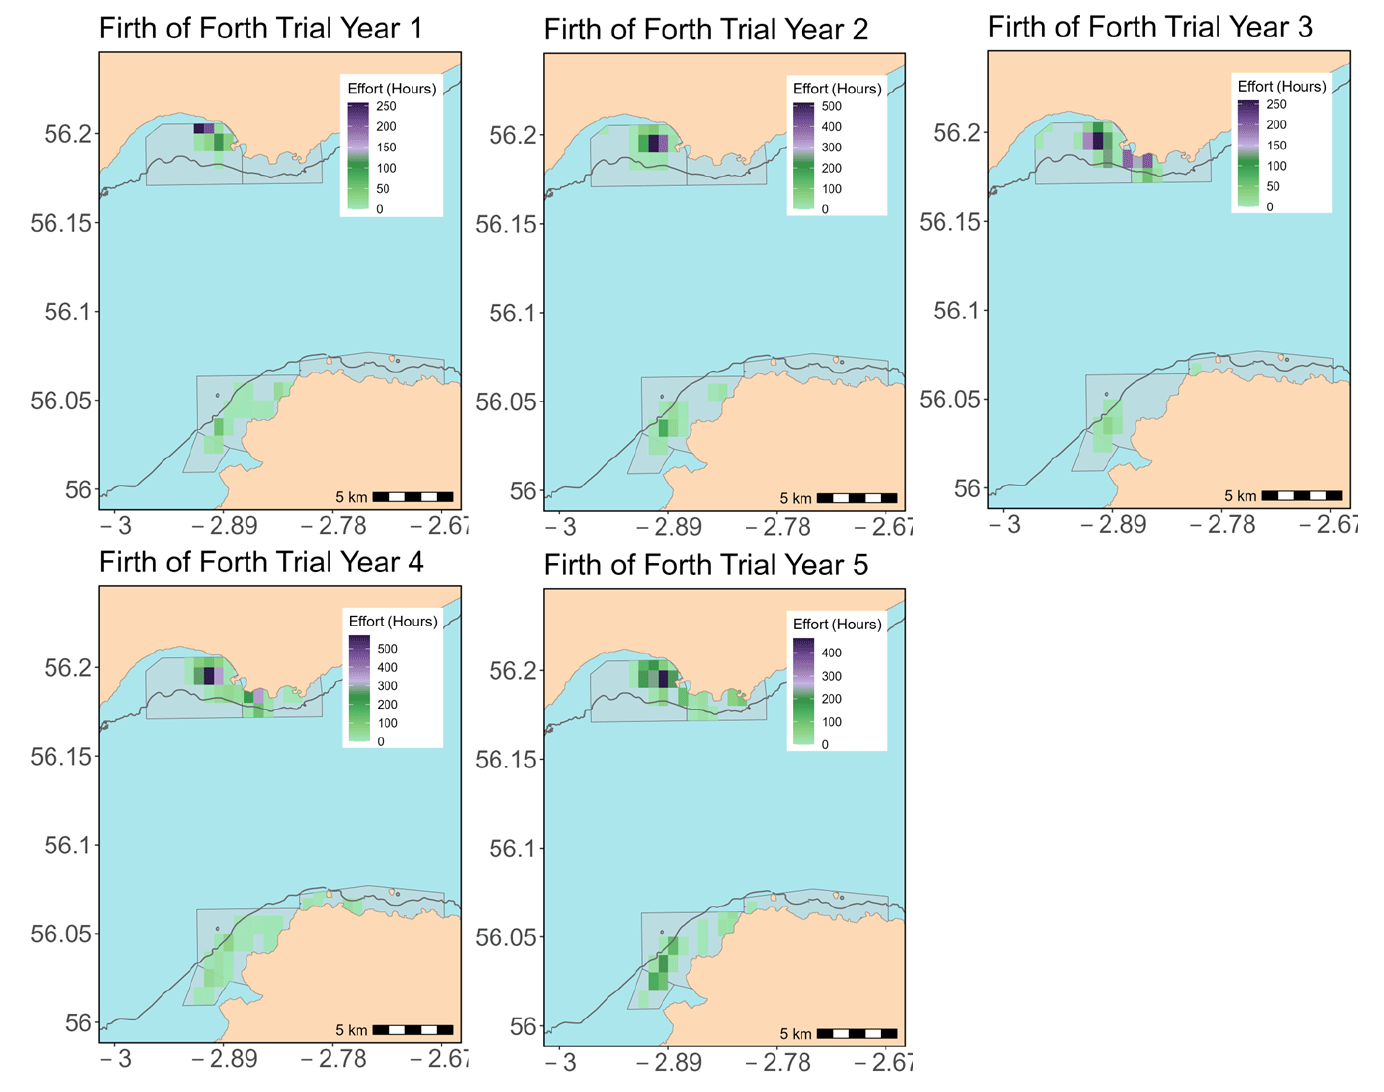
The Firth of Forth is located on the east coast of Scotland. The spatial distribution of the fishery reveals that vessels predominantly fish in the northern part of the trial area (Largo Bay), although there has been fishing activity recorded in the southern part of the trial area at Gullane Point (Figure A4.33). The fishing footprint within the Firth of Forth has increased over the time-series, from 24 grid cells in Year 1 to 52 in Year 4. The highest concentrations of effort and maximum fishing intensity (hrs per c-square) have occurred in the eastern area of Largo Bay, just west of Ruddons point (Figure 50).
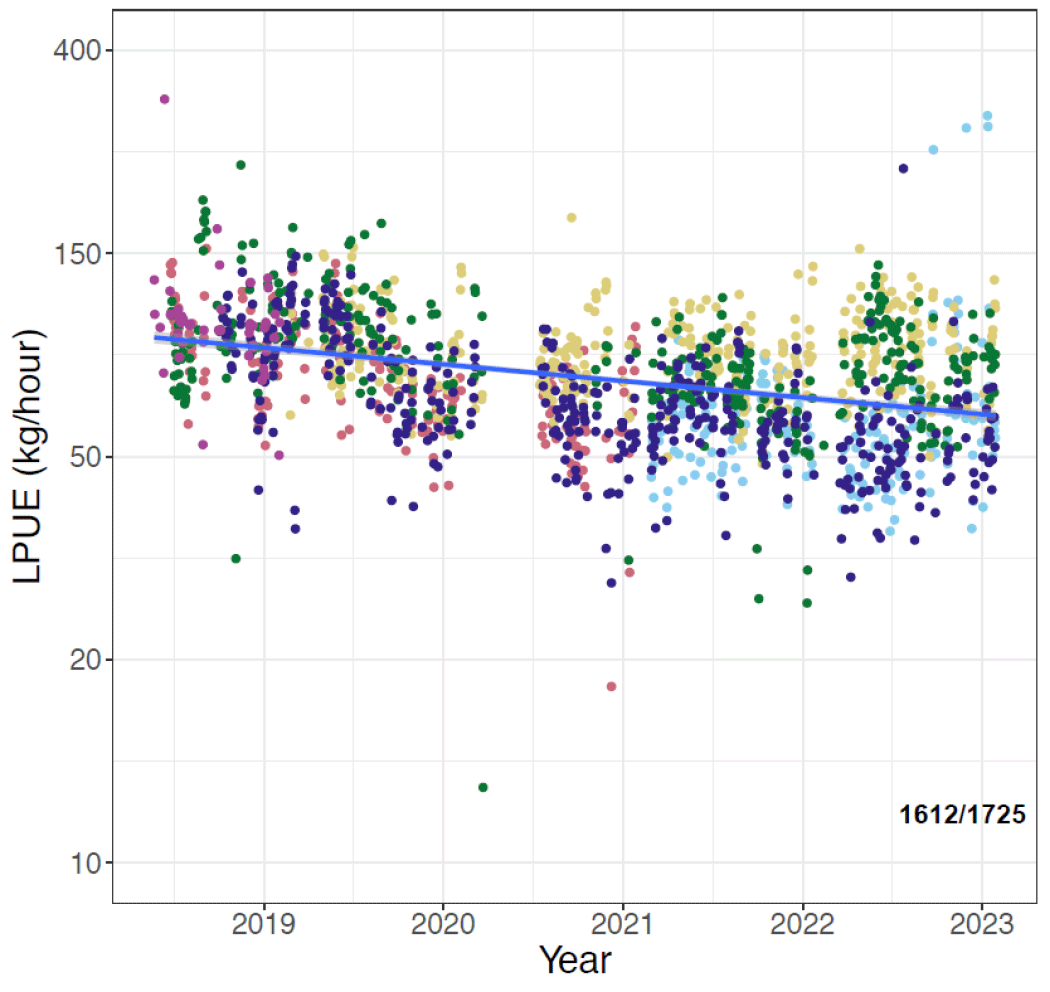
The Firth of Forth is another trial area that has exhibited a higher LPUE at the start of the trial. The linear regression model suggests some evidence of a declining trend in LPUE (Figure A4.34). The slightly lower LPUEs observed in 2021 into 2022 may be a result of the footprint expansion around the southern Gullane Point being less productive grounds or heavier fishing and greater competition in the northern Ruddon point area reducing productivity.
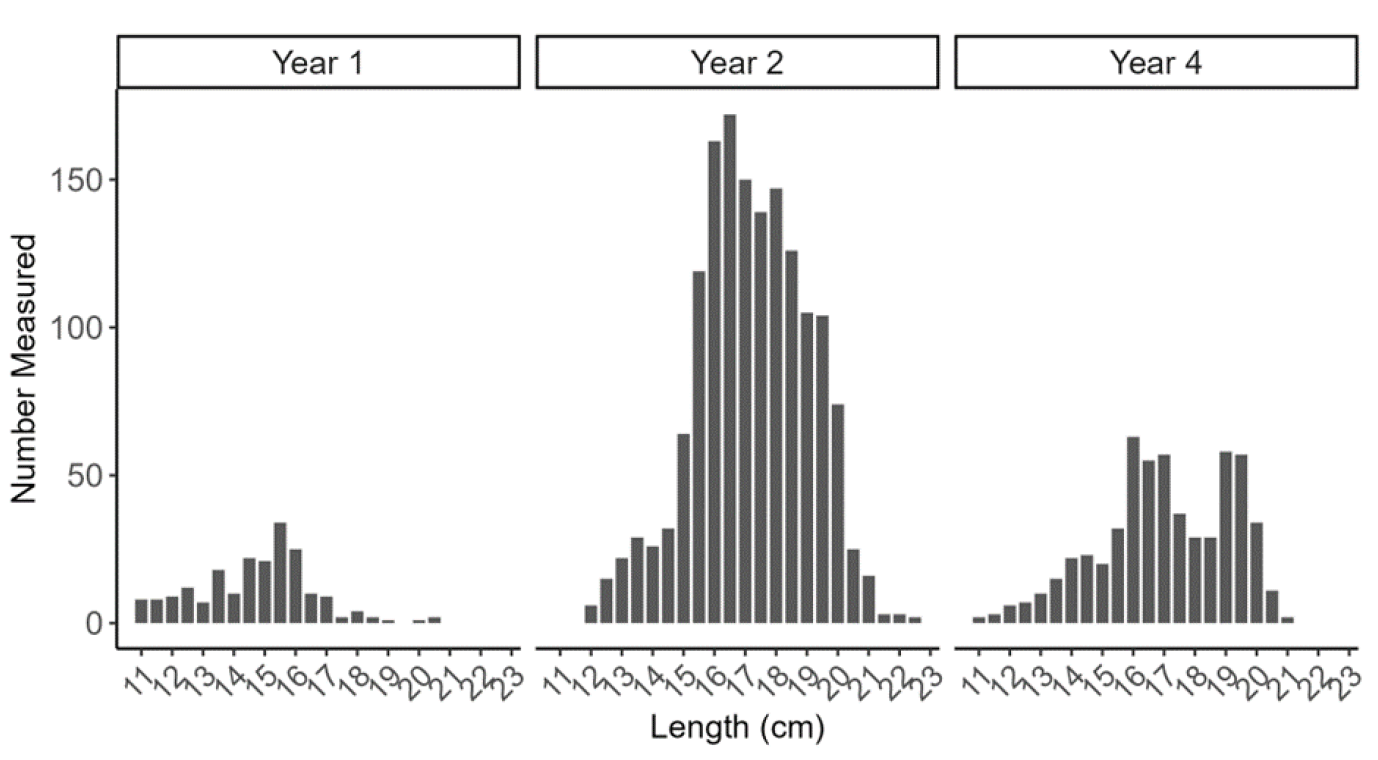
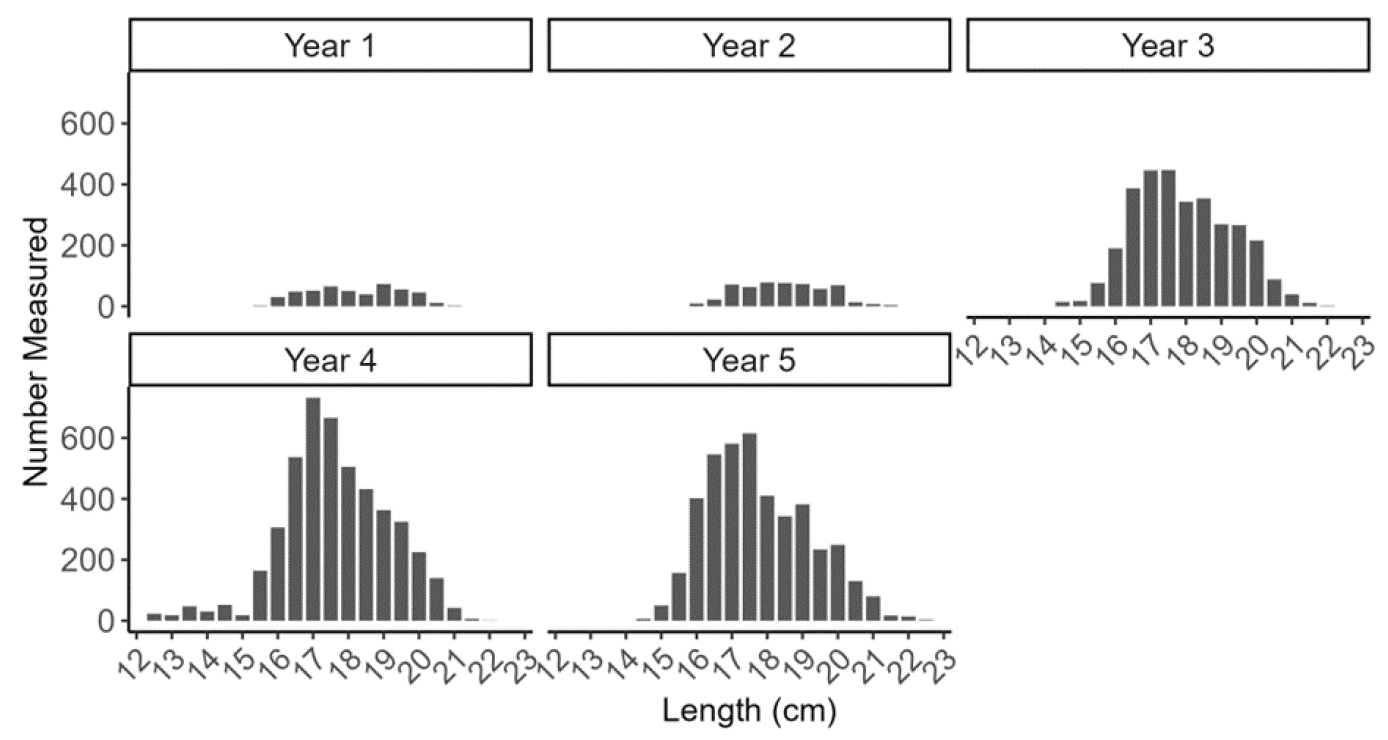
Trial participants and associated processors provided measurements of the lengths of razor clams landed. For the Firth of Forth, a total of 59 self-sample data sheets have been submitted since the start of the trial to January 2023 (Table A4.18). Lengths of the landed razor clams sampled were between 12.5 and 22.5 cm (Figure A4.35) with the highest number of samples (and measurements) submitted in Trial Year 4.
| Year 1 | Year 2 | Year 3 | Year 4 | Year 5 | |
|---|---|---|---|---|---|
| Feb | - | - | - | - | - |
| Mar | - | - | - | 3 | - |
| Apr | - | - | - | 2 | 4 |
| May | - | - | - | 2 | 2 |
| Jun | - | - | - | 4 | 3 |
| Jul | - | 1 | 3 | 1 | 3 |
| Aug | - | - | 3 | 3 | - |
| Sep | 1 | - | 2 | 2 | 2 |
| Oct | - | 1 | 2 | 1 | - |
| Nov | 1 | - | 1 | 1 | 1 |
| Dec | - | - | 4 | 1 | 1 |
| Jan | - | - | 1 | 1 | 2 |
| Total | 2 | 2 | 16 | 21 | 18 |
Contact
There is a problem
Thanks for your feedback