Scottish scientific electrofishery for razor clams trial - biological and ecological goals: progress report
Report summarising data and main findings from the trial to date.
Appendix 5
Data Science Accelerator Programme (DSAP)
Over three months participants had the chance to experiment with different data science techniques and open-source software. Each participant or team was assigned a dedicated mentor and benefitted from peer support from others in their cohort. Cohort 19 of the Data Science Accelerator ran from 25 August to 6 December 2021 and the title of the project was: “Creating a data pipeline to improve reporting on electronic monitoring (EM) and logbook data from the scientific trial for the razor clam electrofishery in Scottish waters.” The technical steps taken during the project are outlined in Table 6.
The specific aims of this DSAP project were:
1. To document the “current” data pipeline using professional/data analytics style diagrams.
2. To make a relational database to store the electronic monitoring and other MSS data sets. A database solution that facilitates links to R and GIS software was preferred.
3. To produce automated periodic reporting.
| Step | Rationale of tool | Use for project |
|---|---|---|
| Created GitHub accounts for mentees and mentor and created a private GitHub repository (“RazClamSciTrial”) for the project. | Git is one of the most common software tools for version control – the practice of tracking and managing changes to software code. Its use is being promoted in the SG Analytical Tools online. | Using GitHub allowed colleagues to share resources, scripts and discuss issues using the issue boards section with our mentor. GitHub also ensured that the most up to date versions of codes were available to/and being used by project staff. |
| Installed gitbash on off-SCOTS laptops to read and write content to/from the GitHub repository | Git bash is a command line windows application which provides a connection to GitHub repositories to efficiently manipulate files and directories. | |
| Installed docker and enabled Windows Subsystem for Linux (WSL) and Hyper-V on off-SCOTS laptops. | Docker containers emulate virtual machines but are much more efficient in terms of system resource. They isolate the software requirements of the project from the environment solving the “it works on my machine” headache. | The use of Docker ensured the same software and version were being used by all project managers, particularly in the installation stage of the database, and allowed all colleagues to have the same access to the required software. |
| Created a yaml script for deploying a new postgres database (deployed in a docker container) that is specified in sql setup and schema files | YAML is a data serialization language that is often used to create configuration files with any programming language. PostgreSQL is an open-source relational database system best suited for systems requiring complex queries and data analysis as opposed to just data storage. |
Using a yaml script (saved on GitHub) ensured that we had the same initial set up for the tables in the database on PostgreSQL. This meant the baseline configuration was the same since we could not have simultaneous access to the same database. |
| Wrote a generic R script for pushing data to the newly created database | R is a widely used open-source programming language by researchers for statistical computing and graphics and is supported on SCOTS systems. | R is easily accessible to SG staff at MSS and we use it frequently for data analysis because of its functionality and reproducibility. New coding was learnt to connect to the database and push and pull data to and from the database through R. |
| Created additional sql file for use within PostgreSQL to modify the column names of database tables | The created database tables can be edited by modifying the configuration YAML files and creating a new database instance or by running SQL commands to manipulate the schema and data within the pgAdmin client. | SQL files saved in GitHub allowed the manipulation of the database table column names and data types to better suit the data and outputs required. By using the SQL files colleagues ensured they had the same tables saved in their database to the same specifications. |
| Devised a set of tests to run on data prior to it being pushed to the database. Deployed tests using pointblank R package to run tests in a combined format with output. Wrote 2 testing quality control R scripts one for each of the electronic monitoring and logbook data inputs. | The R pointblank package allows you to methodically validate your data through pipelines using easily readable consecutive validation steps with several reporting options. User defined thresholds for failure rates allow for the determination of appropriate reporting actions. Other workflows include the organization of metadata. | Pointblank was a new R package that we learnt to use to quality check the raw data and compare this data to the data already in the database prior to pushing the data. This should detect any issues with refreshes of the landings and EM input data sets and produces a QC report and CSVs of rows failing QC tests that can be sent to the relevant colleagues to resolve. |
| Wrote Rmarkdown scripts to generate html reports on the data contained in the database for dissemination to policy and compliance colleagues, and in future stakeholders. | Rmarkdown allows users to save/share code with collaborators along with tables, figures and text describing the interpretation within a single report file. These are dynamic and interactive report templates that can be run with the latest data. It ensures reproducibility and consistency. | Rmarkdown scripts allowed the generation of html reports that summarise the landings data and allows colleagues to download relevant data contained within the html report. These reports can be emailed to relevant colleagues in science, compliance and policy every quarter as a means of updating scientific interpretations of landings and EM input data. |
| Experimented with email_blast() function of poingblank r package for sending automated emails with results of validation tests (i.e., actioned emails to be generated on test fails) | This function is useful for sending an email message that explains the results of pointblank data validation tests. It can be used to send results of test fails to the relevant data holders to rectify. | The email_blast function of Pointblank in R was tested to automatically email the QC produced reports to the relevant colleagues. However, issues were encountered when trying to send these emails from SCOTS email addresses due to security limitations on functionality, so this has been put on hold from the moment. |
| Created a UML diagram for new data pipeline using appropriate software www.diagram.net and familiarised ourselves with other forums for diagram creation. | Diagrams.net is a free open-source cross platform graph drawing software. Its interface can be used to create diagrams including unified modelling language (UML) diagrams to visually represent a system with its actors, roles, actions etc to better understand or document information about the system. | Diagrams.net was used to create a data pipeline of the processes created and further developed through this project and how these relate to one another and to which colleagues and data sets. It is thought this diagram will evolve as the data analysis methodology progresses and it should help non data analyst colleagues to understand the use and integration of data sets. |
Project results are documented against the initial project objectives.
1. To document the “current” data pipeline using professional/data analytics style diagrams.
A diagram describing the pipeline of the data processing and analysis performed by MSS for the razor clam electro fishery in Scottish waters was developed using a free online developer (www.diagrams.net). The diagram shows the steps taken from data being extracted or received by science staff through QC checks of the data before being pushed into a specially designed razor clam database (Figure A5.1) and finally generating scientific reports.
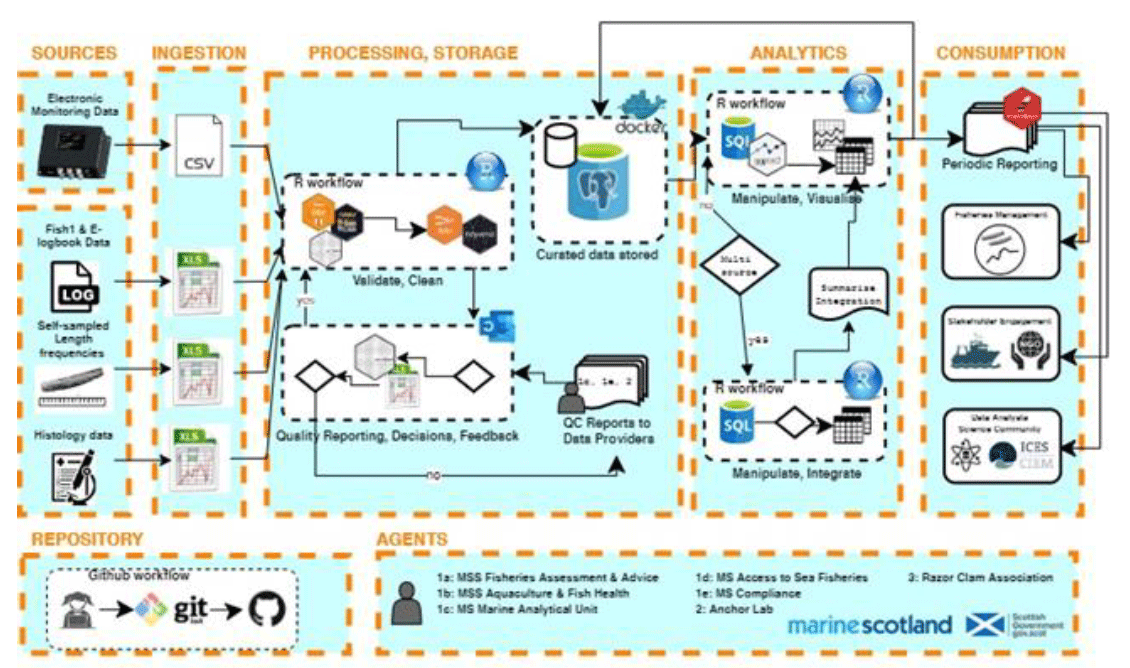
The diagram clearly demonstrates the steps taken by analysts and highlights where and when decisions are made based on the data quality identified, and what knock-on effects this can have to level of completeness and uncertainty associated with scientific results and interpretation further along the pipeline. It also identifies which staff groups within MD are involved at what stages of the process and what data they provide and/or require, as well as demonstrating what steps will be taken by staff with the data to produce the required outputs.
2. To make a relational database to store the electronic monitoring and other MD data sets. A database solution that facilitates links to R and GIS software was preferred.
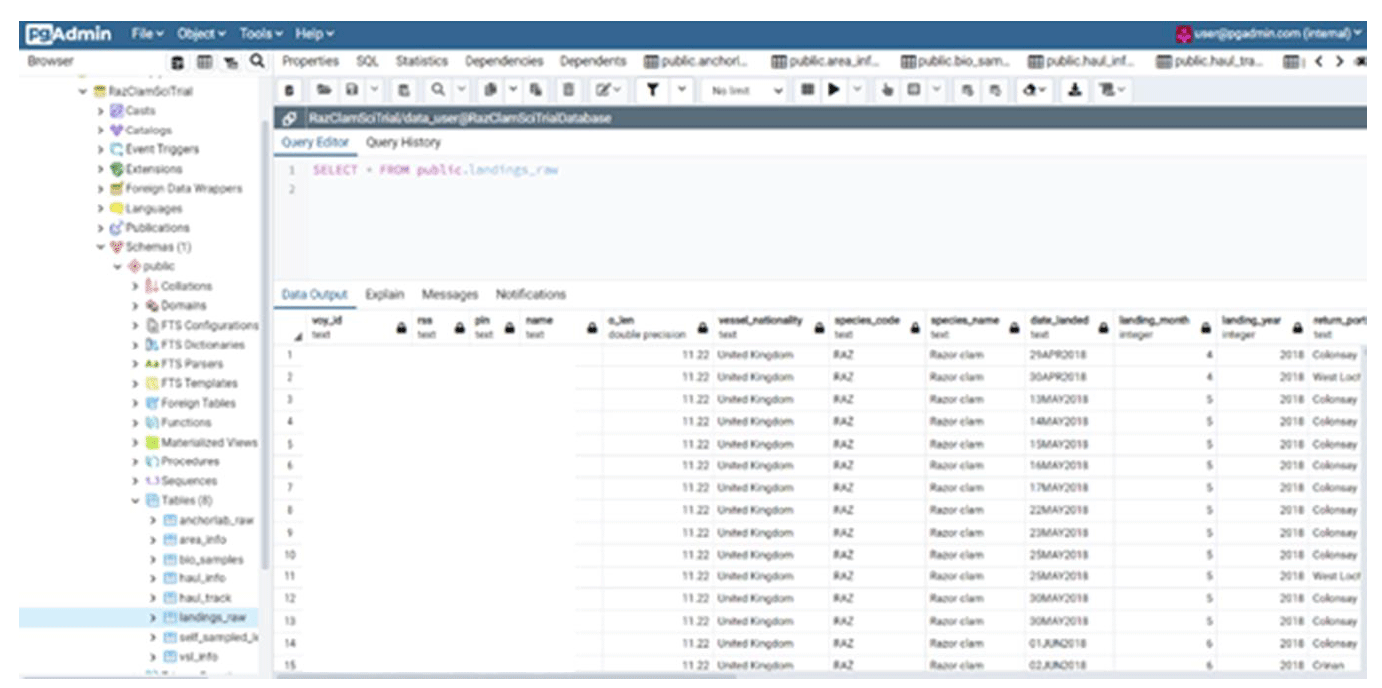
A YAML script with a database schema of the desired data tables was created. Docker was employed to create a container that ran a postgreSQL database instance using the YAML schema configuration provided. This database instance was then accessed via internet explorer using the pgAdmin client (Figure 57). Using SQL commands through R the empty database tables in the database were populated for both raw data sources (electronic monitoring and logbook). These data in the database could then be read back into R to be processed to populate further tables or conduct scientific analysis. This process required trial and error to incrementally tweak the database schema to ensure that the specified fields were the correct data type and length and used correct naming conventions to be compatible with our existing data files.
Upon receiving new/updates to the data sets the newest data due to be added to the database undergoes an R Pointblank QC process. This process compares newly received data extracts to the previous data contained within the database to ensure that it is accurate, complete and meets common sense assumptions such as that the landings will be greater etc. The Pointblank process produces a report that can flag any failures in the QC process which can then be highlighted to the relevant staff or MS areas responsible for this data.
3. To produce automated periodic reporting
R markdown is a widely used tool for creating automated, reproducible share-worthy reports which can generate static or interactive outputs in several formats (word, pdf, html, PowerPoint etc). Such documents can be reproduced to reflect updated data on a routine basis as was the aim for this project and are dynamic to change based on input data.
Prior to the DSAP project starting analysts had produced some basic Rmarkdown reports which generated word documents for the scientific output of the razor clam electrofishery in Scottish waters. These were simplistic in containing a few figures and with rudimentary formatting of how the code and results were being shown. During the DSAP project significant progress has been made in shortlisting the types of figures and tables that would be of interest to various MS groups and developing Rmarkdown html outputs. Having created a database these reports now read directly from the database as opposed to temporary .csv and .xlsx files. A greater emphasis was directed towards the creation of interactive reports whereby a greater amount of data and figures are included but formatted in tabs that users can click through to maintain short document lengths overall. There are also buttons to either show supporting data tables or just view corresponding figures. This will enable project staff and wider MS colleagues to take values/figures from these reports for routine dissemination tasks without needing to specifically request them from analysts. Where staff have requested data to support their analysis in the past these datasets have been incorporated into the reports and are accessible via download buttons within the report.
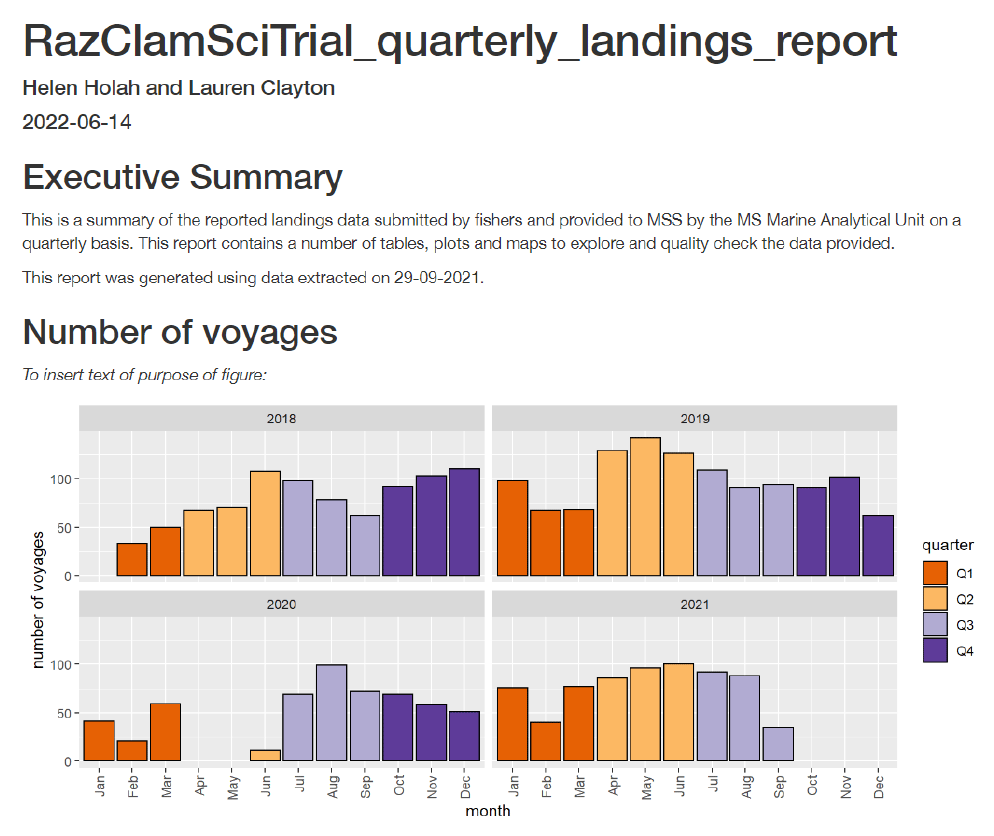
RazClamSciTrial_quarterly_landings_report_v0.1 (A38544704)
At present these html reports have been developed for the raw data sources (electronic monitoring and landings) the short-term plan is to present these documents to the staff working on the razor trial project to gather feedback on the usefulness of the content developed, any additional content required and to discuss whether the level of data anonymity matches the required level for interpretation. In future reports containing aggregated data sets could be shared with stakeholders.
An automated emailing function (R Documentation; email_blast) was tested within the Pointblank QC script with the intention that this would email the QC report (known as an “agent”) to relevant colleagues, who had provided the data that was being quality checked, automatically after the agent had been created. The email function worked in conjunction with a personal Gmail account sending the email to a Scottish Government email account. However, due to the numerous securities encountered with IT we were unable to use the email function to send from a Scottish Government email account. Given that the data contained in the agent would be of a sensitive nature (attributable to individual vessels) it would not be appropriate in full implementation of this pipeline to send such data via personal email servers. As such the addition of automated email functionality has been omitted from the project pipeline at this stage until permissions can be changed to allow automated emailing between Scottish Government email accounts or an alternative solution is found.
Managing, gathering and using our information while protecting it sufficiently and sharing appropriately with the public and stakeholders is a key priority of the SG information management strategy and aligns with the SG’s vision of being open, capable and responsive (Scottish Government Information Management Strategy, 2021). The DSAP project successfully managed to develop a documented pipeline and repeatable process for integrating, analysing and reporting on a new source of fisheries data from electronic monitoring (EM) systems. EM is a key component to the SG’s Future Fisheries Management policy and is a tool to deliver confidence and accountability of Scottish fisheries to the public as well as improving our scientific knowledge and evidence base in the longer term and it is hoped that the knowledge gained from this project can be utilised for other work areas.
The creation of the database did pose some issues in terms of accessibility to staff, as the database instance was only accessible to the local host (individual off-SCOTS laptop user), which meant that the database was not shared or able to be edited by other staff. Whilst the code to create and populate the database was available to all users via GitHub and could therefore be replicated on any machine, any changes or updates made to the database instance once created were only visible to the individual user. Since the completion of the DSAP project a solution to this issue has been found by the Marine Scotland Data Manager. Using our YAML database configuration and scheme the database has been replicated on the marlab environment and is now accessible to all MSS staff who hold marlab accounts and have access to virtual machines or off-SCOTS machines.
Having a shared and accessible database to all MSS staff involved in the project holding all the electronic monitoring, logbook, biological self-sampling, and histology data will be of huge benefit to the razor clam project. Many of the individual MSS staff working on aspects of the project require data from multiple data sets to inform their own analysis and this can now be facilitated by shared access rather than individual requests between staff. The postgreSQL database is accessible via R which facilitates replication of all existing analysis work that had been done with .csv and .xlsx files prior to the database creation. The database developed will allow integration with QGIS however this has been identified for future exploration and analytical skill development as all data visualisation spatial or otherwise is currently done within R.
Contact
There is a problem
Thanks for your feedback