Scottish scientific electrofishery for razor clams trial - biological and ecological goals: progress report
Report summarising data and main findings from the trial to date.
2. Data collection and Methods
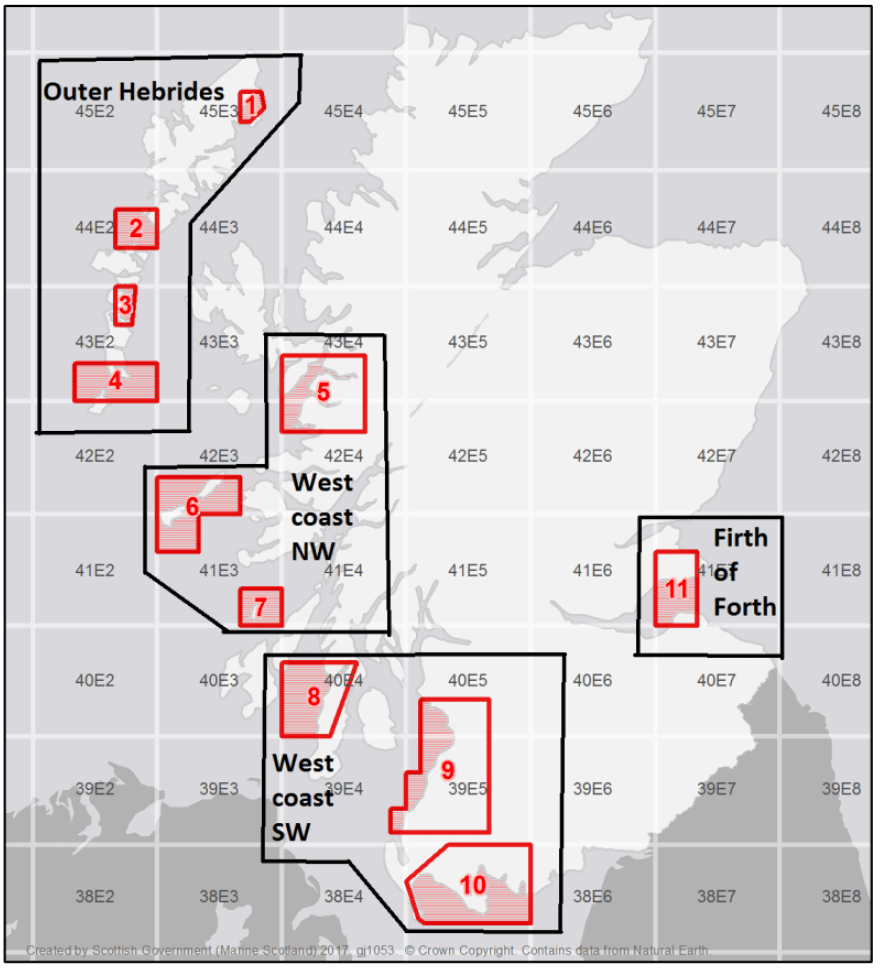
Eleven trial areas (grouped into four zones) were established based on the consultation process, engagement with fishers and wider stakeholders including representatives from processing and export businesses (Figure 2, Table 1). These eleven areas were further refined to consider restrictions due to the Scottish Marine Protected Areas (MPA) network, the presence of suitably classified waters for harvesting by Food Standard Scotland (FSS), and advice from Nature Scotland regarding Habitats Regulations Assessments and the potential impacts or mitigations for protected features. Fishing for razor clams is only permitted in the classified shellfish harvesting areas which are published on a weekly basis (Shellfish results | Food Standards Scotland). Trial area 4 (Sound of Barra) and the Luce Bay area of Trial Area 10 would further require an appropriate assessment and are currently not part of the trial.
| Zone | Zone Name | Trial Area No. | Trial Area Name | Site Name |
|---|---|---|---|---|
| 1 | Outer Hebrides | 1 | Broad Bay | Broad Bay Aiginish |
| 2 | Sound of Harris | |||
| 3 | Benbecula | South Ford Faoileann | ||
| 4 | Sound of Barra | No Classified Areas | ||
| 2 | West coast NW | 5 | Sound of Sleat | |
| 6 | Coll and Tiree | Coll razors | ||
| 7 | Colonsay | Colonsay East of the Strand | ||
| West Jura | ||||
| Tarbert Bank | ||||
| 3 | West coast SW | 8 | Gigha | Sound of Gigha |
| 9 | Firth of Clyde | Stevenston Sands Razors | ||
| North Bay | ||||
| Croy Bay | ||||
| Girvan South Razors | ||||
| Prestwick Shore | ||||
| 10 | Wigtown Bay | Wigtown Bay: Islands of Fleet | ||
| Fleet Bay Razors | ||||
| Kirkcudbright Bay Razors | ||||
| Luce Bay – Not Classified | ||||
| 4 | Firth of Forth | 11 | Firth of Forth | Forth Estuary: Largo Bay |
| Gullane Point North | ||||
| Gullane Point South |
2.1 Fisheries Data
Official Scottish landings and effort data (for UK vessels landing into Scotland) are collated by Marine Directorate compliance from fishers’ logbooks and sales notes and entered into fisheries databases (COMPASS and iFISH). These data were used for a number of purposes including: to monitor fishing activity in combination with information on vessel activity (as detected by on-board REM systems), in the calculation of landings per unit effort (LPUE) and in the stock assessments (Section 2.4).
All vessels participating in the trial carry REM systems which record details of vessel position and status of the electrofishing gear at ten second intervals. These raw data (vessel identifiers, latitude, longitude, speed (knots) and current (amps) of the electrofishing generator), obtained from the REM provider (Anchorlab) via the software interface “BlackBox Analyzer,” were downloaded and processed. Individual fishing activities were identified as periods where the electrical current output exceeded a threshold of four amps for a minimum of ten minutes. The latitude and longitude of all REM data points comprising an individual fishing activity were joined to generate electrofishing tracks.
The electrofishing tracks were used to map the fishery footprint, both as raw tracks and with the data points of tracks aggregated within c-squares (0.01×0.01 degree squares), and to estimate electrofishing effort (hours) and intensity (hours per c-square). The term “fishing footprint” in this report refers to the seabed areas that have been electro-fished during this trial. The duration (hours) of each fishing activity was calculated as the time difference between the first data point of the electrofishing activity track and the last data point. The durations of individual fishing activities were summed per 24-hour period to give an effort measure (hours/day) at the same temporal resolution as the reported landings.
Summaries of the landings, effort, fishing footprint and intensity of the razor clam fishery are included in the results section and more fully (for each trial area) in Appendix 4. The following are descriptions of the metrics (calculated for each trial year) used in those summaries:
Trial Year – A trial year runs from 1 February to 31 January the following year.
Landings (t) – Sum of annual reported landings (iFish) of all vessels which used their derogations to land razor clams.
Average daily landings (kg) – Average (mean) of all reported daily landings (iFish) of all vessels. There were 123 daily landings observations (~1.4% of all landings) since 1 February 2018 that exceeded the permitted 450 kg daily allowance, ranging from 451-4450 kg. Most of these records were believed to be anomalies where the landings of several days had been mis-entered during the logbook tabulation process. Because the split of landings across multiple days could not be verified, these records were excluded from the calculation of the average daily landing.
Number of vessels – The number of vessels which used their derogations to land razor clams.
Total effort (days) – Sum of days with REM-detected fishing activity, for which the on-board electronic monitoring system detected >1 hour of electrofishing activity, across all vessels.
Fishing footprint (number of c-squares) – Count of c-squares (0.01×0.01 degree squares) with fishing activity.
Average fishing duration (hrs per day) – Average (mean) daily electrofishing effort (hrs) across all vessels and days, for which the on-board electronic monitoring system detected >1 hour of electrofishing activity.
Range of fishing intensity (hrs per c-square) – Minimum and maximum electrofishing intensity (hrs) values over fished c-squares (0.01×0.01 degree squares).
Average fishing intensity (hrs per c-square) – Average (mean) electrofishing intensity (hrs) across all fished c-squares (0.01×0.01 degree squares).
Landings per unit effort (LPUE) were calculated as landings (kg) per hour fished by dividing the reported landings (kg) by the number of hours fished (derived from REM) for each vessel on each day fished. This was achieved by matching each reported landing to the corresponding REM sensor data for each vessel and day combination. An LPUE data point was calculated for each fishing day for each vessel, and these were plotted as a time-series (by trial area) to allow visual inferences of the overall trends.
On average, approximately 10% of logbook reported landings per year could not be linked to REM data and vice versa. The activity date associated with a reported landing was often found to have no corresponding REM detected fishing activity (or vice versa). This was typically due to missing or late data entry of landings data, or REM system malfunctions. A decision tree was used to assess the potential utility of those landings records and REM data which could not be linked (Appendix 2).
Challenges identified in integrating REM data with existing fisheries data collection methods included: the high volume of REM data; accessibility and data management responsibilities of the different data sources; the different spatial and temporal resolution of the data, particularly between the tracking and logbook data; and the quality of logbook data.
Marine Directorate science staff participated in the Scottish Government Data Science Accelerator Programme (DSAP) to identify and demonstrate analytical tools that could be utilised to assist with integration of new and emerging high-tech sources of fisheries data generated (Appendix 5). DSAP is a Scottish Government capability-building programme that provides analysts from across the public sector the opportunity to develop their data science skills. It is supported by the Government Digital Service (GDS), Office for National Statistics (ONS) Data Science Campus, the Government Office for Science and the Analysis Function (Introduction to the Data Science and Data Visualisation Accelerator programmes - GOV.UK (www.gov.uk)) .
The DSAP project aimed to demonstrate how data analytic tools can be applied to improve dynamic science reporting on the fishing effort of the razor clam electrofishing fleet in Scottish waters. Although this work was not initially planned as part of the razor clam trial, this was an extremely useful opportunity to gain exposure to data science tools that will be needed to address the scalability issues when rolling out tracking and monitoring to all Scottish vessels. Further information is available in Appendix 5.
2.2 Biological Data
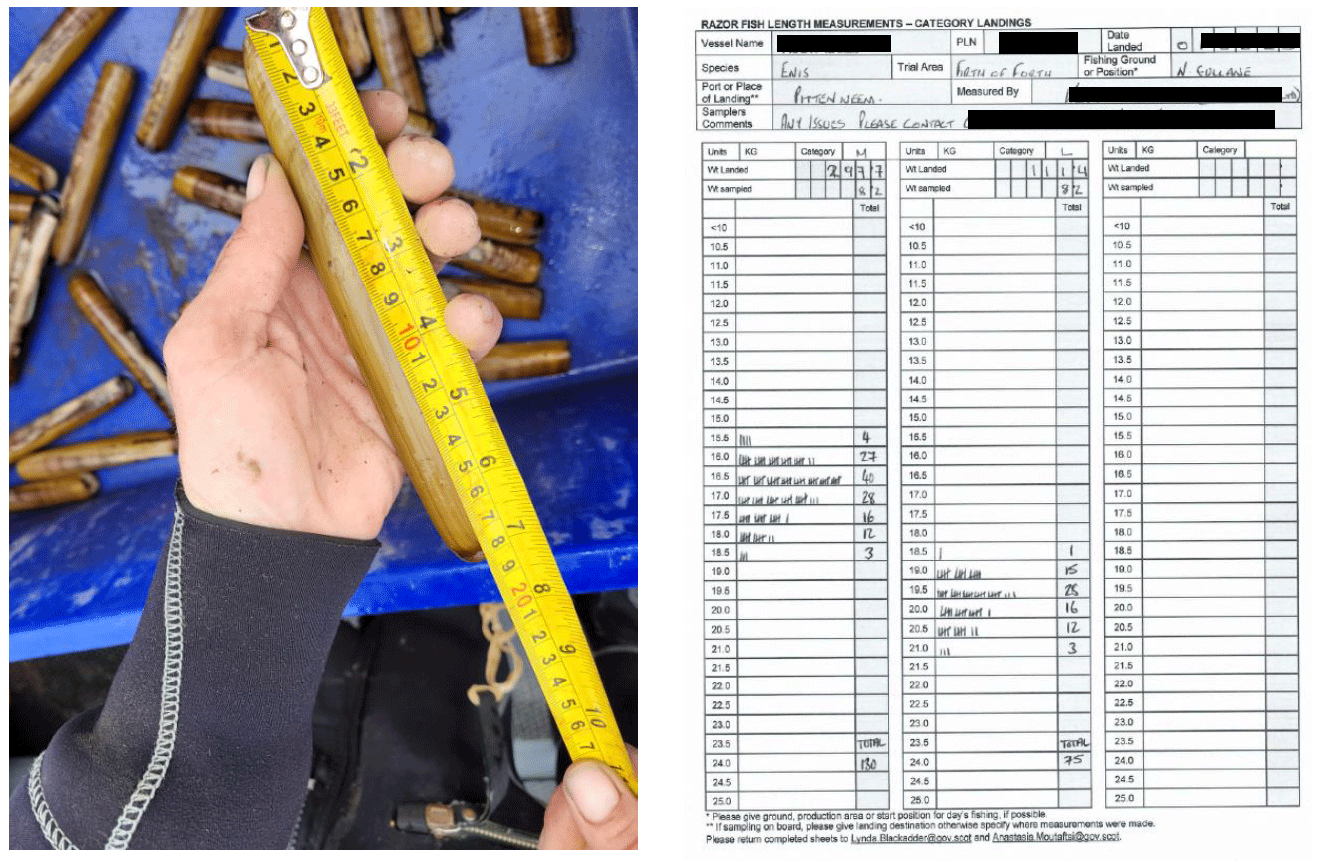
To gather information on the length of landed razor clams, detailed instructions for sampling and measuring razor clams were sent to trial participants and the associated processors. Length measurements (recorded as numbers of razor clams at length in 0.5 cm intervals), the total weight of the sample measured, and the total weight of the landing from which the sample was taken were recorded onto data sheets (Figure 3). The vessel name, vessel PLN (port, letter and number), date of fishing activity, the name of the trial zone (Outer Hebrides, West Coast NW, West Coast SW or Firth of Forth) and name of the trial area, were also detailed along with additional information on fishing ground if known (shellfish production area, local bed or site). As a minimum, vessels had to submit one sample per month when fishing.
Since August 2018, samples of live razor clams collected by trial participants have been transported to the Marine Laboratory in Aberdeen on an approximately monthly basis for processing. Detailed instructions specified the collection of 200 live razor clams across the whole size range encountered on the seabed, both above and below the minimum landing size (100 mm). Razor clams were accompanied by a sample sheet specifying vessel details, date, and location of capture.
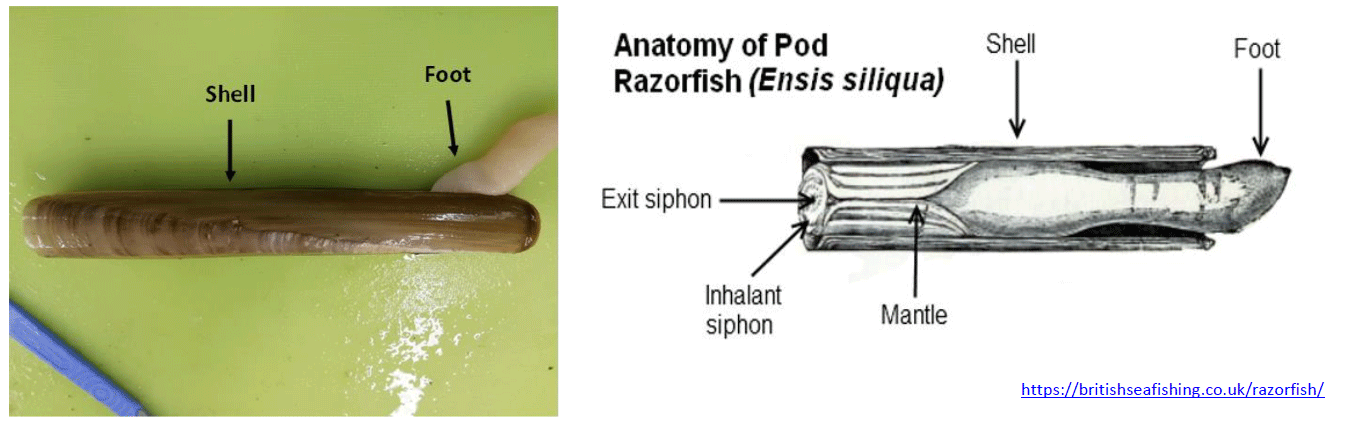
Each razor clam was weighed (to the nearest 0.1 g) and the shell measured (length, width and height) to the nearest mm below using digital callipers (Figure 4). The razor clam was then dissected, and an attempt was made to identify the sex of the individual by macroscopic examination before the flesh and the empty shell were weighed to the nearest 0.1 g. A selection of empty shells was frozen and retained for ageing purposes (see Section 2.5).
Dissected razor clams were examined macroscopically to assess if sex could be determined by visual inspection (Darriba et al., 2005 and Gaspar and Monteiro, 1998). A small section of gonad was removed from the area covering the anterior abductor muscle and anterior area of the foot. The tissue was fixed in Davidson’s seawater for 24 hours, processed by the standard paraffin wax technique, and cut (3 µm) using a rotary microtome. Haematoxylin and eosin (H & E) stained sections were then examined for gametogenic development in accordance with Darriba et al., 2005 (Table 2). These data were used to assess the likely time of spawning activity for razor clams.
| Stage | Definition | Description of gonad |
|---|---|---|
| 0 | Sexual rest | Few follicles and small. Sex distinguishable. Protogonia in mitosis. |
| I | Start of gametogenesis | Follicle size increases. Spermatogonia and spermatocytes in males. |
| II | Advanced gametogenesis | Follicle size increases and occupies the entire tissue. Germinal cells in all phases of gametogenesis. |
| IIIA | Ripe | Polygonal follicle almost full ripe gametes. Spermatozoa occupy most follicle. Free ripe polygonal oocytes in the lumen. |
| IIIB | Start of spawning | Gonoducts with mature gametes in emission. Spermatozoa lose radial disposition. Free ripe rounded oocytes in the lumen and empty spaces. |
| IV | Exhaustion | Follicles small and practically empty. Residual gametes degrading. |
Razor clam tissue samples were also collected for genomic analysis in a study of population connectivity. This is part of a Super DTP PhD project (Lydia McGill – The Scottish Universities Partnership for Environmental Research (st-andrews.ac.uk) ) at the University of the Highlands and Islands which aims to study relationships between razor clam stocks and to determine source, sink and self-recruiting populations.
Razor clam shells were frozen and retained for age determination as part of the PhD project based at the Scottish Association for Marine Science (SAMS) (see Section 2.5). This was done with a view to deriving estimates of area specific growth parameters for use in length-based stock assessments.
Sampling of live razor clams was suspended from April 2020 to March 2021 because of the COVID-19 pandemic but resumed on a reduced basis from April 2021. The need to implement COVID-safe work practices meant sampling was reduced to focus on only four trial areas (Firth of Clyde, Firth of Forth, Gigha and Broad Bay) and the number of live razor clams was reduced from 200 to 30 individuals so that samples could be processed while following physical distancing guidelines.
Individual length and weight data collected during the live razor clam sampling were used to derive length-weight relationships (LWRs) for each trial area. LWRs were based on the equation where is weight (g), is length (mm), and a and b are estimated parameters. This becomes a linear equation after a logarithmic transformation where log( is the intercept and is the slope which were estimated in R 3.6.3 using the equation:
log 𝑊 = log 𝑎 + 𝑏 log 𝐿
The length-weight relationship was assessed on data collected between 2018 and 2020 for the trial areas of Broad Bay, Coll and Tiree, Colonsay, Firth of Clyde, Firth of Forth, Gigha, Sound of Sleet and Wigton Bay. Variables of “Zone name,” “Trial area,” “Production area” and “Month” were included in initial modelling and were systematically removed from the full model after testing with analysis of variance (ANOVA) if found to be statistically insignificant.
2.3 Surveys
The Marine Directorate has worked in collaboration with SAMS to develop survey methodologies for razor clams. Surveys to determine razor clam densities were conducted in the Sound of Harris and Firth of Clyde in 2017 (prior to the trial commencing; Fox, 2018). This work established the application of electrofishing with towed video as a new survey method for razor clams (Fox et al., 2019).
Planned surveys of razor clam grounds in the Firth of Forth and the Firth of Clyde were scheduled for 2019 but had to be deferred for operational reasons. Survey work in the Firth of Forth was carried out in March 2020 by SAMS (Fox, 2021). Although the work was curtailed and the report delayed because of the COVID-19 pandemic, it provided data on the densities of razor clams on fishing grounds and data on other organisms observed. Further surveys were planned for 2021 and 2022 but issues securing appropriate funding meant these were not undertaken. A survey of the Tarbert Bank was completed in February and March 2023 (Fox, 2023).
2.4 Stock assessment
Length Cohort Analysis (LCA)
Length Cohort Analysis (LCA) is a commonly-used method of assessing stocks for which commercial catch length frequency distribution data are available. This assessment method has been used in the past by Marine Directorate in the assessment of other species such as crabs and lobsters (Mesquita et al., 2023). The LCA method uses commercial catch composition data (length frequency data) and estimates of growth parameters and natural mortality to estimate fishing mortality at length.
The decision-making process to select the razor clam trial areas with sufficient data to run the LCA was based on four main criteria as detailed in Appendix 3. Both the Firth of Forth and Firth of Clyde met all the required criteria for LCA to be carried out. Length frequency data from self-sampling were combined with official landings data to provide a raised annual landings-at-length distribution. Data were averaged over a three-year period (2020-2022) and aggregated into 5 mm length bin size categories.
The LCA results were used to calculate the yield-per-recruit (YPR) and biomass-per-recruit (BPR) relative to changes in fishing mortality (F) which can be used to provide an indication of stock status in terms of growth overfishing. The relationship between YPR and F is typically dome-shaped. Low levels of F result in low landings as few individuals are caught, while high levels of F may also result in a reduction in yield (in addition to biomass) from a particular cohort as animals are caught before they have had time to grow to a size that would contribute much weight to the yield (growth overfishing). In between these lies FMAX, the fishing mortality rate that maximizes YPR for a particular pattern of fishing mortality at length. For data limited stocks such as razor clams, it is not possible to directly estimate the maximum sustainable yield (MSY) and hence, FMAX was used as a proxy for FMSY. This approach has been extensively used for other species with limited data, such as crab and lobster (Mesquita et al., 2023).
All FMSY proxy values remain preliminary and may be modified following further data exploration and analysis. A summary of stock status in terms of fishing mortality in relation to FMSY was provided for each of the trial areas. A stock was classified as being fished “at FMSY” when the estimated F was within 10% of FMSY (above or below).
Growth parameters, including natural mortality, are essential input parameters for an LCA. The growth information used for the current razor clam stock assessments was based on von Bertalanffy’s[1] parameters derived from data collected on E. siliqua in the 1990’s and early 2000’s from various locations in Scotland (Breen, et al., 2011) (Table 3) .
| Area | Linf | K |
|---|---|---|
| Orkney | 212 | 0.134 |
| Lewis | 188 | 0.223 |
| Brora | 196 | 0.107 |
| Golspie | 185 | 0.146 |
| Ailort | 190 | 0.225 |
| Kentra (April 2001) | 192 | 0.216 |
| Kentra (November 2001) | 180 | 0.435 |
| Hunterston | 207 | 0.265 |
According to the estimates presented in Table 3 the asymptotic size (Linf) ranged from 180 to 212 mm while the growth coefficient (K) varied between 0.11 and 027 year-1. None of the sites listed in Table 3 includes data from the Firth of Forth Area. The closest areas to the Firth of Forth would be two east coast sites in the Moray Firth (Brora and Golspie). Amongst the areas for which growth parameters estimates are available, Hunterston is the only site within the Firth of Clyde, although it is located slightly north of where the main trial fishery for razor clams takes place (from Ardrossan to Dunure). Given the lack of site-specific growth estimates for razor clams in the Firth of Forth and Firth of Clyde, the stock assessment LCAs were run using a number of different combinations of growth parameters. For Linf, values of 196 mm (Brora) and 207 mm (Hunterston) were assumed while for K, 0.11 (Brora) and 0.27 (Hunterston) were used. Exploratory analysis of razor clam length distributions in the two areas (Firth of Forth and Firth of Clyde) indicate that Linf estimates below 196 mm are possibly inappropriate to use for these stocks given that large animals well above 200 mm have been consistently observed in landings.
In Ria de Pontevedra, Spain, studies showed Linf estimates of razor clams in this region ranging between 140-172 mm, with K estimates ranging from 0.3-0.4 (Hernández-Otero et al., 2014). The higher asymptotic length (Linf) and lower growth coefficient (K) estimates for razor clams in Scotland suggest a slow growth combined with the achievement of larger sizes. The growth estimates from Hernández-Otero et al. (2014) in Spain imply that growth parameters for razor clams differ for this species depending on the geographical locations.
Natural mortality (M) is also an influential parameter in fish stock assessment (Kenchington, 2014; Powers, 2014). M is sometimes estimated through controlled experiments or tagging studies. For fish stocks, studies of ecological and empirical evidence have shown a significant basis for the prediction of M from a combination of Linf and K (Then et al., 2015) and maximum age (tmax). Where data from previous studies are unavailable, as is the case for razor clams in the Firth of Clyde and Firth of Forth, M can be estimated using empirical formulas (e.g. Then et al., 2015). Although several empirical formulas are used to estimate M, all these methods rely mainly on correlations with life history parameters (Then et al., 2015). Here, M estimates were obtained following methods by Hoenig (1983), and Alverson and Carney (1975). Both methods are based on maximum age estimates. The razor clam natural mortality M used in this study for the LCAs was estimated to be 0.16 and 0.1 (Table 4). These estimates are within the range previously estimated for this species (Breen et al., 2011).
| Growth parameters | Estimate | Method used |
|---|---|---|
| Linf (mm) | 196-207 | Linf estimates for Brora (east coast) and Hunterston (Firth of Clyde). Breen et al. (2011) |
| K | 0.11-0.27 | K estimates for Brora (east coast) and Hunterston (Firth of Clyde). Breen et al. (2011) |
| M | 0.1-0.16 | M=0.1 estimated following Hoenig’s method (Hoenig, 1983) M=0.16 estimated using the Alverson and Carney’s method (Alverson and Carney, 1975) |
The interquartile range of razor clam length in both areas was between 170 mm (25%) and 190 mm (75%). The LCA provides estimates of fishing mortality (F) for each length class which are averaged over a fixed length range to give an estimate of average fishing mortality for each stock (Fbar). The calculation of Fbar in the LCA carried out for these stocks was based on a fixed length interval (170-190 mm) corresponding to the interquartile range mentioned above. The use of a fixed length range to calculate Fbar also has the advantage of allowing comparisons of fishing mortality if new stock assessments are carried out in the future to detect trends in fishing mortality.
Geostatistics and survey-based abundance estimates
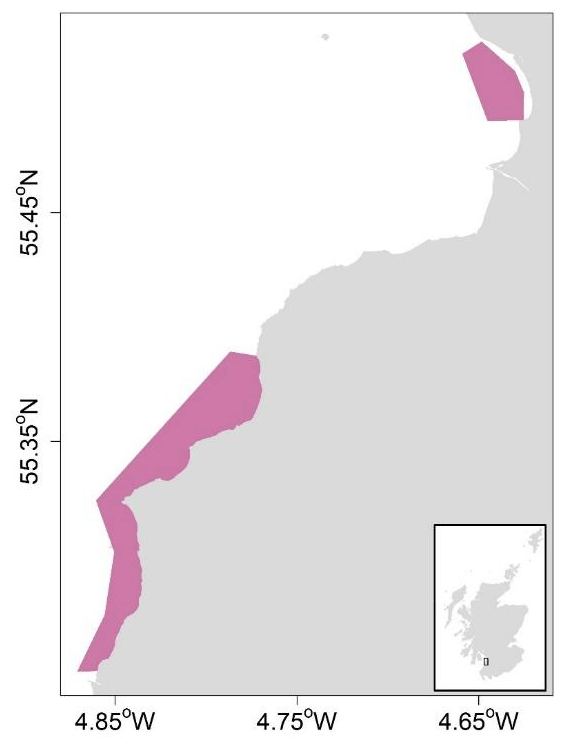
The use of geostatistics was explored to generate survey-based estimates of abundance for razor clams in Largo Bay (Firth of Forth trial area; Figure 5) and in Miekle Bay and Croy Bay (Firth of Clyde trial area; Figure 6), from which harvest rates based on spatially resolved fishery removals could be estimated.
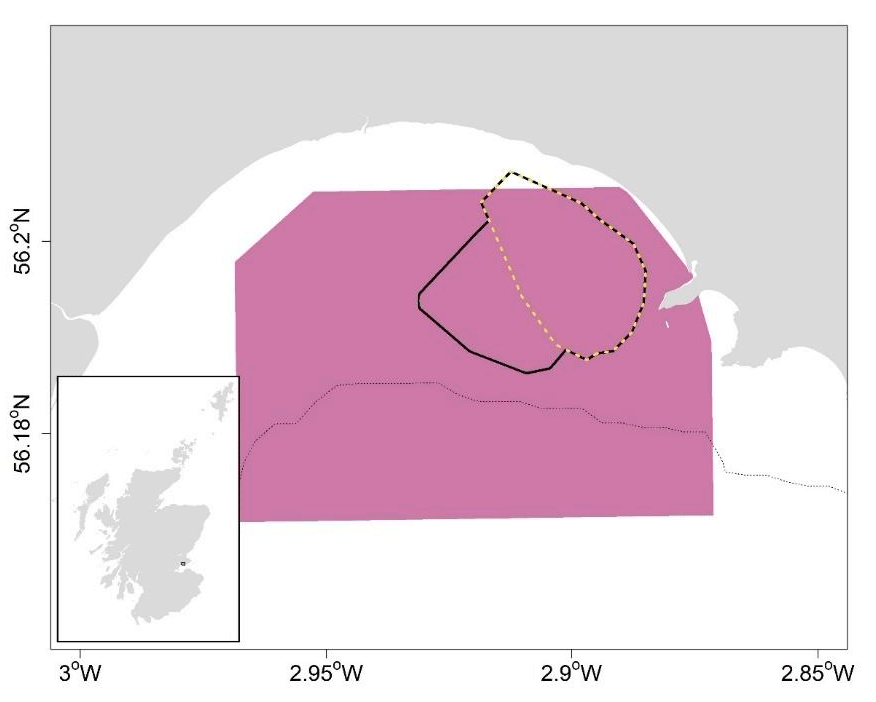
Geostatistical analyses were implemented in RGeostats (MINES ParisTech / ARMINES, 2020) to generate spatially explicit kriged surfaces of Largo Bay razor clam densities based on 2020 field survey data (Fox, 2021), as well as globally kriged mean density estimates raised to the estimation area (4.24 km2), to give total abundance. The first step in kriging involved modelling the spatial continuity of the variable of interest (i.e., razor clam density) using variography (Rivoirard et al., 2000). This is the calculation and modelling of variability in density as a function of sample separation distance. For each size category, an experimental variogram was calculated from the survey density data, to which exponential variogram models were fitted. Sensitivity of abundance estimates to variogram lag parameters was tested (Appendix 1).
Once an appropriate variogram model was obtained, kriged surfaces of razor clam densities across the estimation area were calculated. A grid size of 10 x 10 metres was used. Sensitivity of abundance estimates to kriging grid size was tested (Appendix 1). A globally kriged mean abundance (numbers m2) was calculated from each razor clam size category, and raised to the total area, with 95% confidence intervals calculated from the coefficient of variation.
Total landings for 2020, spatially resolved to the Largo Bay abundance estimation area, were obtained using REM data. These landings estimates were raised to the self-sampled length frequency data, giving total removals by numbers-at-length. Harvest rates were then calculated for each of the survey-based razor clam abundance size categories.
The Miekle Bay and Croy Bay surveys conducted in 2017 provided swept-area densities (numbers per m2) of razor clams in the Firth of Clyde (Fox, 2018). There were fewer stations sampled (compared to Largo Bay) with less complete areal coverage of the survey domain, and so a simpler method was required for abundance estimation. Arithmetic mean densities were calculated for each bay and raised to their total production areas (4.99 and 21.09 km2, respectively) to provide estimates of total abundance, with 95% confidence intervals calculated based on the standard error of the mean.
2.5 Organism and ecological impacts of electrofishing
A PhD project entitled, ‘Organism and ecological impacts of electrofishing in Scottish shallow coastal habitats’, funded through (NERC), was secured by SAMS with support from MSS. The PhD student is registered through the University of the Highlands and Islands (UHI) and based at the Scottish Association for Marine Science (SAMS) near Oban. The PhD aims to assess the ecological sustainability of a well-controlled electrofishery for razor clams in Scottish coastal seas. In particular, the project is focussed on investigating the effects of exposure to electric fields on the physiological performance of both target and non-target marine species.
Initial progress was severely impeded by the COVID-19 pandemic, making access to laboratories and other resources particularly difficult. Work has focussed on methodology for ageing razor clams so that age and size (length) data can be combined to generate growth curves for each site sampled, allowing growth rates to be compared between different fishery areas around the Scottish coast. Natural mortality will also be assessed based on maximum age estimates.
To examine the impacts of exposure to razor clam electrical fishing apparatus on marine animals, an electrical fishing rig was set up for use in tank-based experiments. The rig was supplied by one of the fishers involved in the trial and complies with current gear regulations. The experimental set up is similar to that used by Murray et al. (2014; 2016), allowing direct comparisons to be drawn between the present study and previous MSS-funded research.
Alongside lab-based work, there are tentative plans to conduct further field work to study benthic and infaunal communities which have been regularly exposed to fishing activity to gain a better understanding of the longer-term effects of the electrofishery upon seabed habitats. Future survey work is subject to available funding and staff resources.
Contact
There is a problem
Thanks for your feedback