Scottish scientific electrofishery for razor clams trial - biological and ecological goals: progress report
Report summarising data and main findings from the trial to date.
3. Results of biological data analysis
Length-weight relationships (LWR) are required to convert survey estimates (sizes of razor clams and numeric density) into biomass (weights) in the surveyed areas. Data were utilised from 5130 live razor clams from eight trial areas (Broad Bay, Coll and Tiree, Colonsay, Sound of Sleat, Firth of Clyde, Gigha, Wigtown Bay, Firth of Forth), across the four sampling zones (Outer Hebrides, West Coast NW, West Coast SW, Firth of Forth) from 2018 to 2020 (Table 5).
| Zone | Trial Area | Number of razor clams | ||
|---|---|---|---|---|
| 2018 | 2019 | 2020 | ||
| Outer Hebrides | Broad Bay | 118 | 431 | 100 |
| West Coast NW | Coll and Tiree | 51 | 118 | - |
| West Coast NW | Colonsay | 82 | - | 165 |
| West Coast NW | Sound of Sleat | - | 153 | - |
| West Coast SW | Firth of Clyde | 565 | 636 | 89 |
| West Coast SW | Gigha | 301 | 484 | - |
| West Coast SW | Wigtown Bay | 102 | 301 | - |
| Firth of Forth | Firth of Forth | 560 | 659 | 215 |
The razor clam LWR was derived using linear modelling and analysed using ANOVA. The factors of Trial Area and Trial Zone are linked with the Trial Areas being within the larger scale Trial Zones. While both are statistically significant in describing the LWR, it was decided to only include Trial Area as an explanatory variable to allow for more fine scale analysis, and stock assessments would be undertaken at this spatial resolution. Additionally, the variable of month was investigated but due to a lack of seasonal data for all trial areas it was decided not to include this in the final model. Length was log-transformed as a covariate, Trial Area as a factor and Weight (also log-transformed) as the dependent variable. The final model had a high coefficient of determination (R2= 0.96) with F8, 5107 = 7863, p < 0.001 (Table 6.).
| Trial Area | N | Len min (mm) | Len max (mm) | Wt min (g) | Wt max (g) | Log(a) | a | 95%CI (a) | b | 95%CI (b) | p |
|---|---|---|---|---|---|---|---|---|---|---|---|
| Broad Bay | 649 | 91.09 | 230 | 9.8 | 161.3 | -12.814 | 0.00000272 | ±0.239 | 3.293 | ±3.340 | < 0.001 |
| Coll and Tiree | 169 | 75.37 | 211 | 4.1 | 131.2 | -12.694 | 0.00000307 | ±0.449 | 3.289 | ±3.379 | > 0.1 |
| Colonsay | 247 | 54.6 | 210.5 | 1 | 160.7 | -13.076 | 0.00000209 | ±0.502 | 3.353 | ±3.453 | > 0.1 |
| Firth of Clyde | 1290 | 65.73 | 215 | 3.4 | 132.7 | -12.284 | 0.00000462 | ±0.315 | 3.208 | ±3.271 | < 0.001 |
| Firth of Forth | 1434 | 60.61 | 216 | 2.5 | 156 | -13.359 | 0.00000158 | ±0.307 | 3.425 | ±3.485 | < 0.001 |
| Gigha | 785 | 104.44 | 210 | 13.9 | 128.9 | -11.242 | 0.00001311 | ±0.396 | 2.995 | ±3.073 | < 0.001 |
| Sound of Sleat | 153 | 75.56 | 220 | 3.6 | 152.1 | -13.413 | 0.0000015 | ±0.559 | 3.421 | ±3.536 | < 0.05 |
| Wigtown Bay | 403 | 98.54 | 210.24 | 9.4 | 126.2 | -12.736 | 0.00000294 | ±0.468 | 3.296 | ±3.388 | > 0.1 |
For the maturity analyses, a total of 6338 live razor clams were sampled from August 2018 to December 2022 (Table 7). Not all trial zones or areas were sampled consistently, with most razor clams from the Firth of Clyde (total of 2053 razor clams over the time period) and Firth of Forth (1746 razor clams over the time period).
| Zone | Trial Area | Year 1 | Year 2 | Year 3 | Year 4 | Year 5 |
|---|---|---|---|---|---|---|
| Outer Hebrides | Broad Bay | 118 | 431 | 45 | 55 | 60 |
| West coast NW | Sound of Sleat | 153 | 20 | |||
| Coll and Tiree | 51 | 118 | ||||
| Colonsay | 82 | 120 | 53 | 25 | ||
| West coast SW | Gigha | 301 | 484 | |||
| Firth of Clyde | 565 | 725 | 253 | 510 | ||
| Wigtown Bay | 203 | 200 | ||||
| Firth of Forth | Firth of Forth | 660 | 615 | 159 | 237 | 75 |
| Total | 1980 | 2726 | 324 | 598 | 690 |
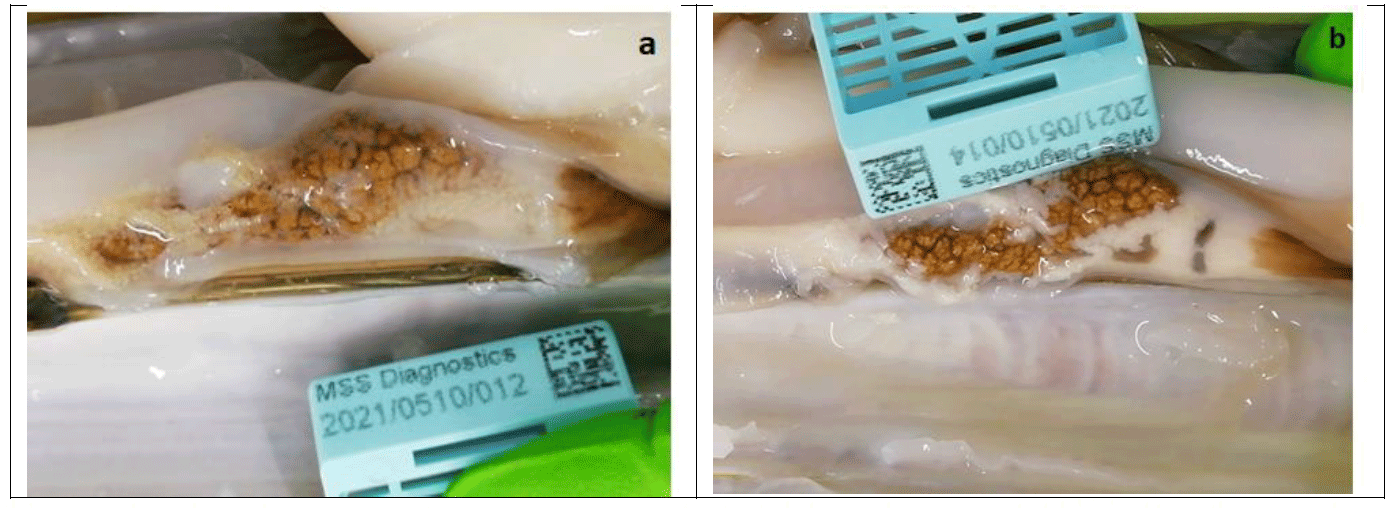
E. siliqua are generally gonochoric (with two distinct sexes: Darriba et al., 2005, Gaspar and Monteiro 1998) although previous work highlighted it was extremely difficult to accurately determine sex based on macroscopic examination (Marine Scotland, 2020). The gonads of E. siliqua displayed colour differentiation with female gonads a whitish colour and milky texture, and male gonads beige in colour with a more granular texture (Figure 7). However, it can be very challenging to distinguish between the two sexes and staff have to be trained appropriately to recognise the differences.

A total of 1468 razor clams (out of the 6338 live razor clams sampled) were further analysed by histological examination; 632 were identified as male, 731 as female, and two as hermaphrodite (Table 8). It was not possible to identify the sex of 103 of the razor clams because the individuals were in stage ‘0’ and either only protogonia cells were present or almost no gonadal tissue was available to be sampled. The data collected will undergo further analyses (samples are yet to be processed) and will be included as part of the PhD study in collaboration with SAMS.
| Sex | Statistics | 2019 | 2020 | 2021 | 2022 | Total |
|---|---|---|---|---|---|---|
| Unidentified (U) | No. individuals | 6 | 1 | 50 | 46 | 103 |
| Min length (mm) | 143.3 | 151.2 | 67.8 | 68.6 | ||
| Max length (mm) | 199.9 | 151.2 | 191.7 | 211.4 | ||
| Mean length (mm) | 176.6 | 151.2 | 129.5 | 114.7 | ||
| Mean weight (g) | 83.7 | 40.5 | 35.1 | 26.6 | ||
| Male (M) | No. individuals | 112 | 32 | 168 | 320 | 632 |
| Min length (mm) | 80.4 | 83.6 | 87.7 | 70.6 | ||
| Max length (mm) | 203 | 195.5 | 198.5 | 209 | ||
| Mean length (mm) | 150.4 | 153.5 | 155.4 | 159.1 | ||
| Mean weight (g) | 49.2 | 45.5 | 54.5 | 60.3 | ||
| Female (F) | No. individuals | 112 | 35 | 226 | 358 | 731 |
| Min length (mm) | 75.6 | 88.8 | 66.6 | 71.3 | ||
| Max length (mm) | 210 | 201.7 | 199.6 | 215.3 | ||
| Mean length (mm) | 151.7 | 154.2 | 153.9 | 158.9 | ||
| Mean weight (g) | 51 | 48.1 | 53.6 | 59.5 | ||
| Hermaphrodite (H) | No. individuals | 1 | 1 | 2 | ||
| Min length (mm) | 148.8 | 160.2 | ||||
| Max length (mm) | 148.8 | 160.2 | ||||
| Mean length (mm) | 148.8 | 160.2 | ||||
| Mean weight (g) | 46.7 | 44.9 |
The examination of histological sections of razor clam gonad identified six different stages (0, I, II, IIIA, IIIB, IV) of gonad development (Darriba et al., 2005, Gaspar and Monteiro 1998). Full images and description of the stages are available in Appendix 6.
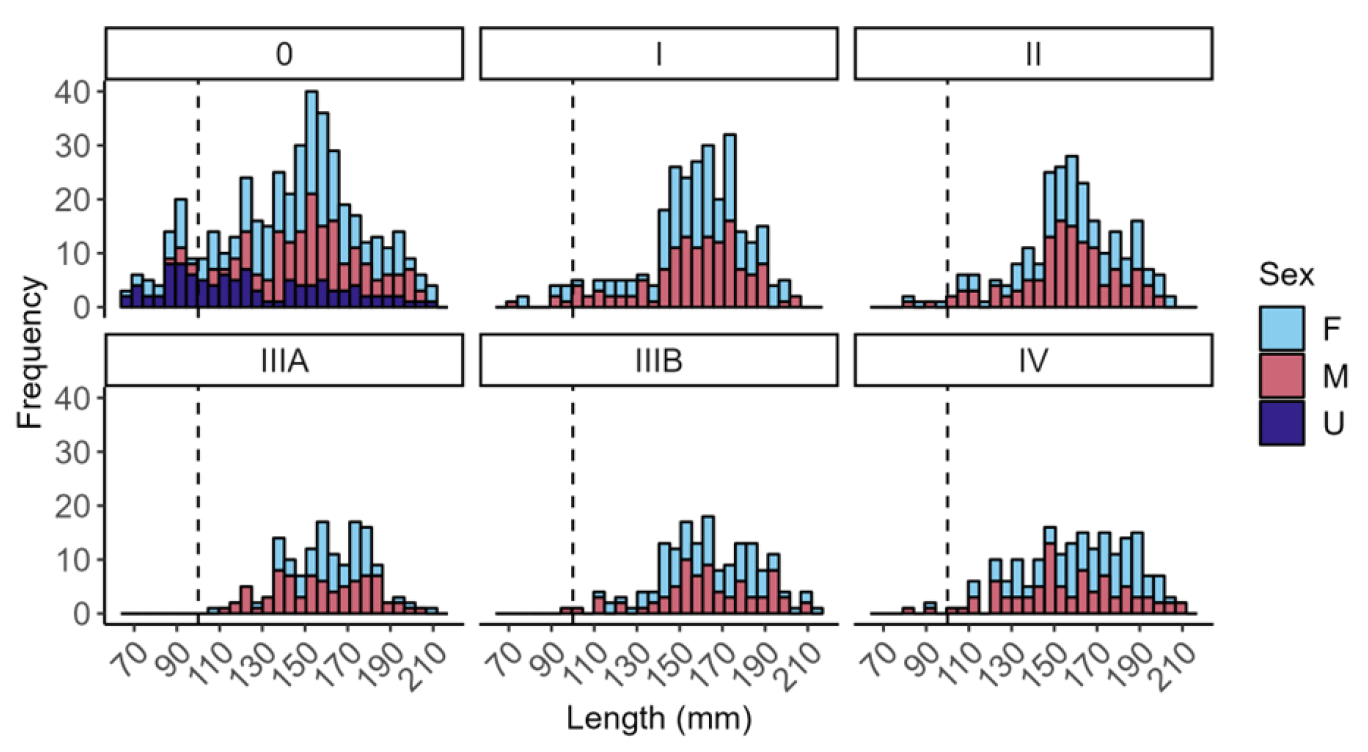
Investigation of the length frequency distribution of the live razor clams sampled for histology revealed that only 50 individuals were under the minimum landing size (MLS) of 100 mm (Figure 8). Of these individuals, 40 (80%) were identified as stage 0, with one individual identified as stage IIIB (spawning) and one as stage IV (exhausted). The smallest razor clam observed at stage IIIA (ripe) was 106 mm, whilst a razor clam of 98 mm was observed to be actively spawning (IIIB) and two razor clams were observed as stage IV (exhausted) with lengths of 92 and 93 mm.

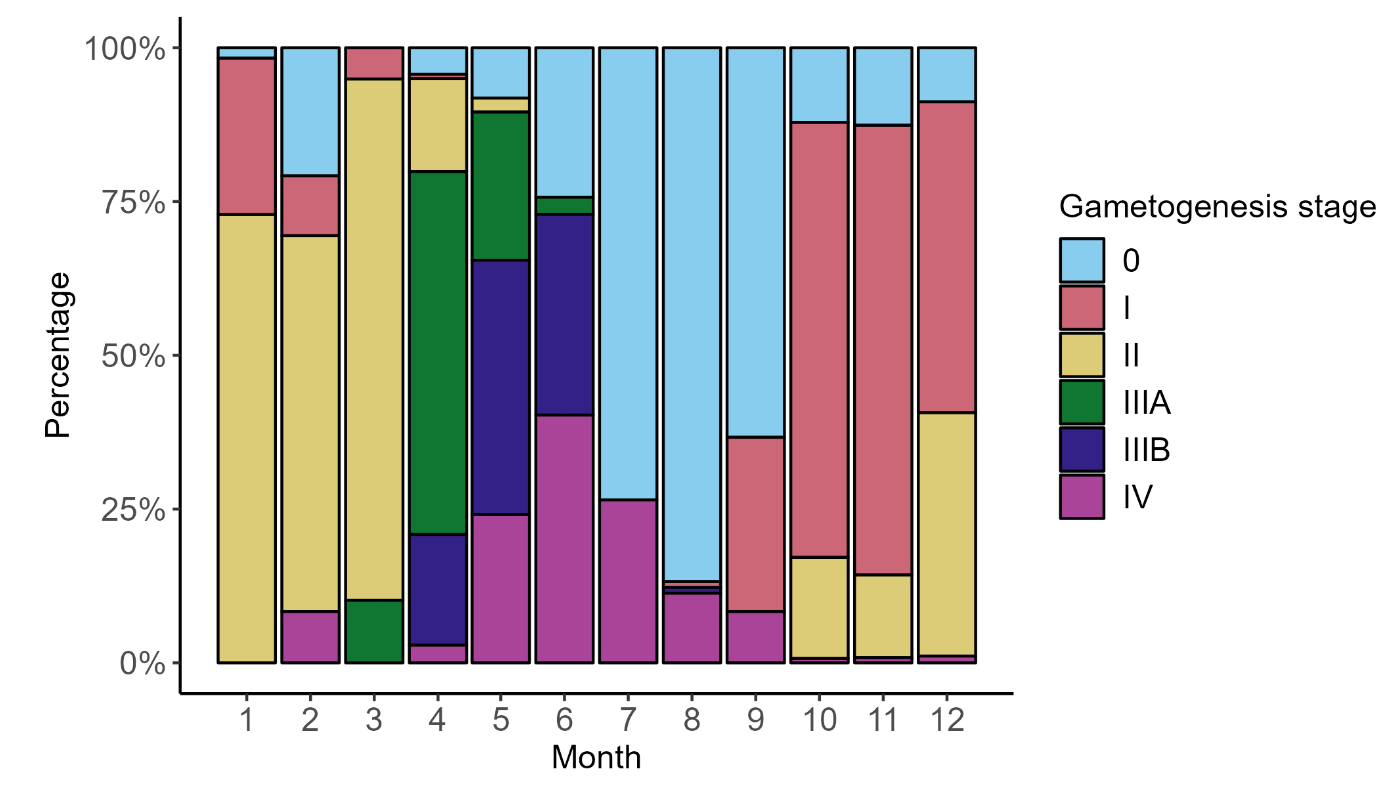
Between January and March, 67.5% of razor clams were identified as stage II with increased follicles. In April and May, 70% of razor clams were observed to be stage IIIA and IIIB: this is when individuals are ripe and actively spawning (Figure 9). For the summer months (July and August) 81% of razor clams were identified as stage 0 with resting gonads. Razor clams were also observed at stage IV (exhaustion) between April and September. From October to December, razor clams were classified at stage I and the process of gametogenesis began again.

Full images and description of the stages are available in Appendix 6.
Contact
There is a problem
Thanks for your feedback