Scottish scientific electrofishery for razor clams trial - biological and ecological goals: progress report
Report summarising data and main findings from the trial to date.
4. Razor clam fishery and stock assessments
A maximum number of 28 vessels are derogated to participate in the trial electrofishery for razor clams at any given time (Table 9). There have been a number of changes to the vessels participating in the trial and a vessel may leave the trial with its derogation moved to another vessel within the same calendar year, but this is at the discretion of MD policy colleagues. During trial year four there were 29 different vessels derogated due to one vessel leaving and subsequently being replaced in the same trial year.
| Trial Year | Trial Period | West Coast SW | West Coast NW | Outer Hebrides | Firth of Forth | Total |
|---|---|---|---|---|---|---|
| Year 1 | Feb 2018 – Jan 2019 | 13 (13) | 7 (5) | 2 (2) | 4 (4) | 26 (24) |
| Year 2 | Feb 2019 – Jan 2020 | 13 (12) | 8 (7) | 3 (3) | 5 (5) | 28 (28) |
| Year 3 | Feb 2020 – Jan 2021 | 13 (13) | 8 (4) | 3 (1) | 4 (4) | 28 (22) |
| Year 4 | Feb 2021 – Jan 2022 | 13 (13) | 8 (7) | 3 (2) | 5 (4) | 29 (26) |
| Year 5 | Feb 2022 – Jan 2023 | 12 (11) | 9 (7) | 3 (1) | 4 (4) | 28 (23) |
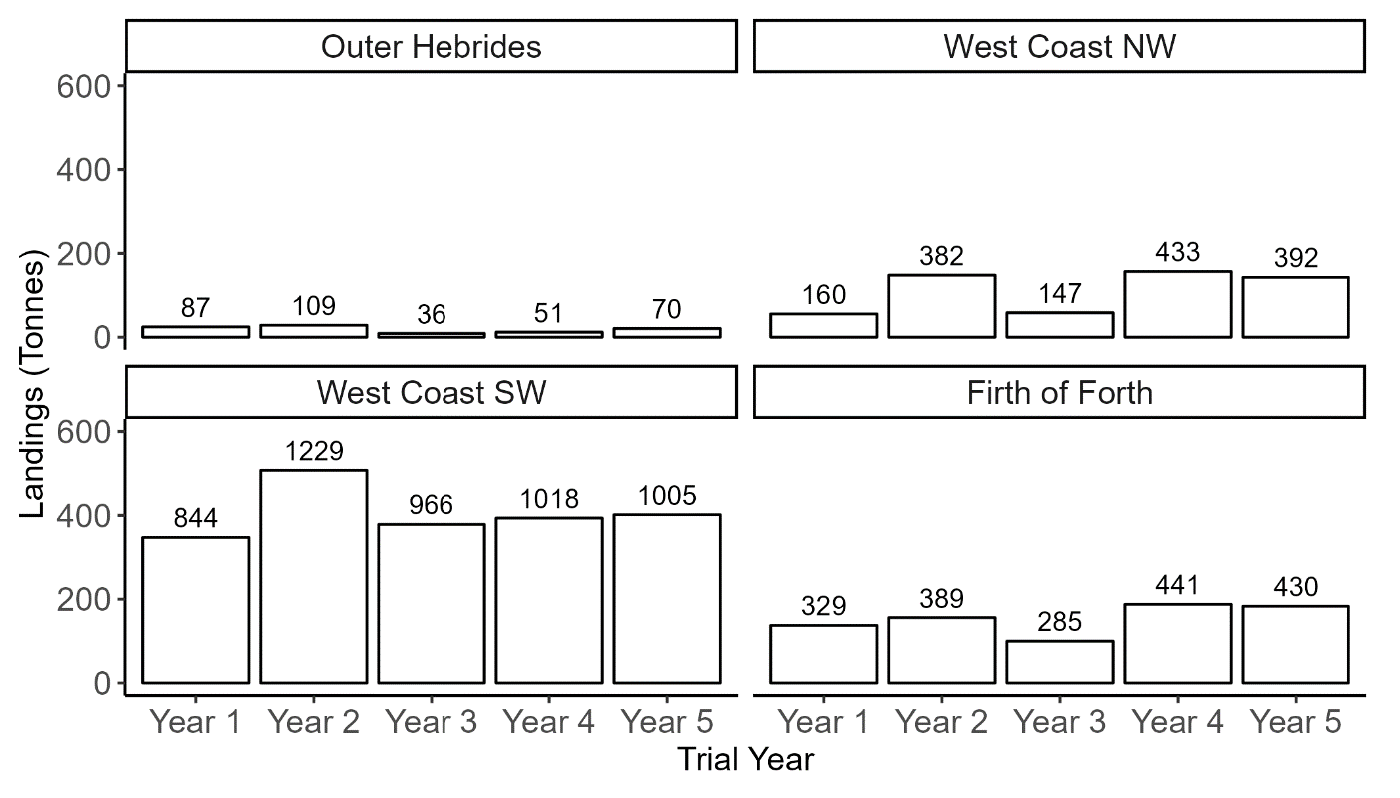
The West Coast SW trial zone has the highest number of vessels, with 13 vessels typically fishing for razor clams each year. Reported landings and the number of days fished are also highest for this zone (Figure 10). Landings are lowest from the Outer Hebrides where only one or two vessels regularly target razor clams as part of the electrofishery trial.
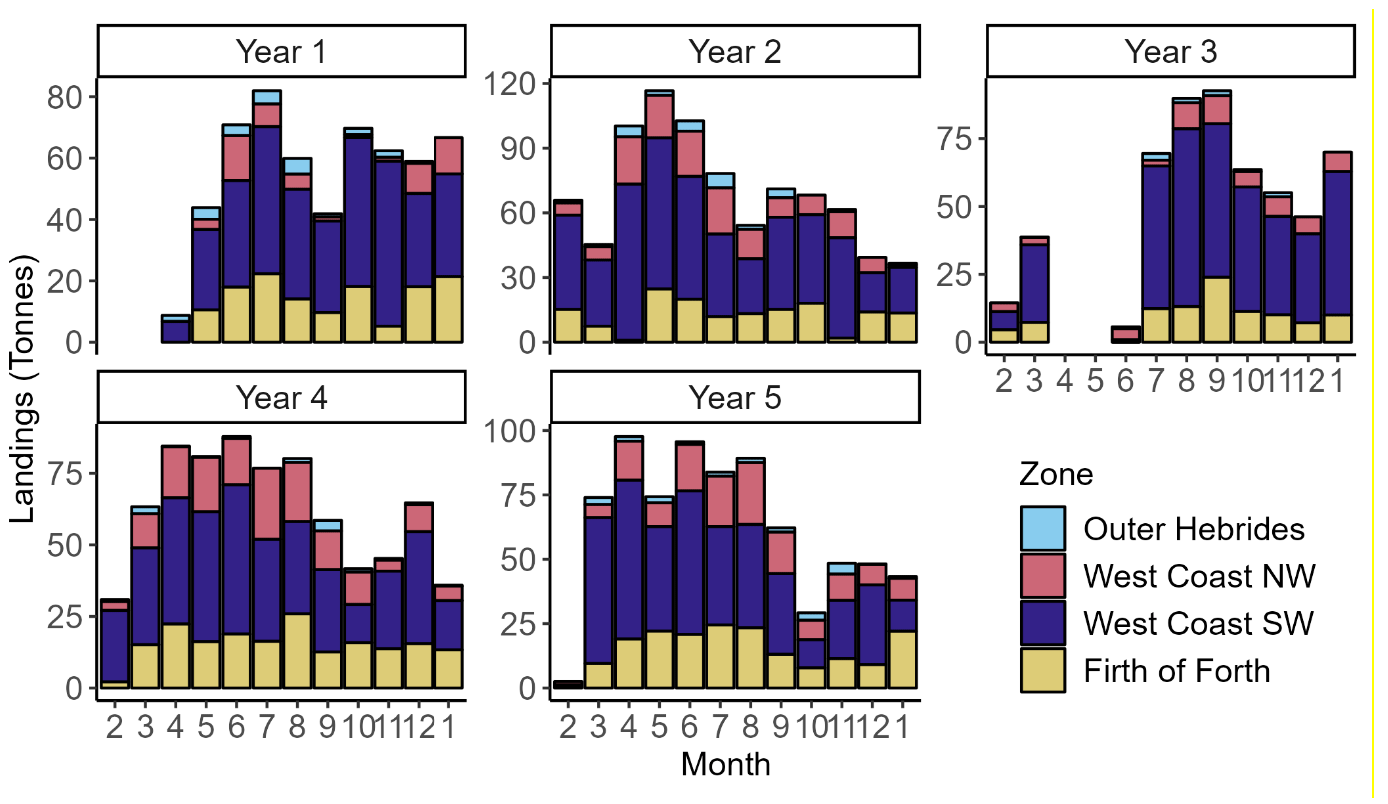
Landings of razor clams are typically highest between April and August, although in Trial Year 1 vessels were still entering the trial fishery and in Trial Year 3 fishing was stopped because of COVID-19. Landings typically decline at the end of the year because of poorer weather (Figure 11).
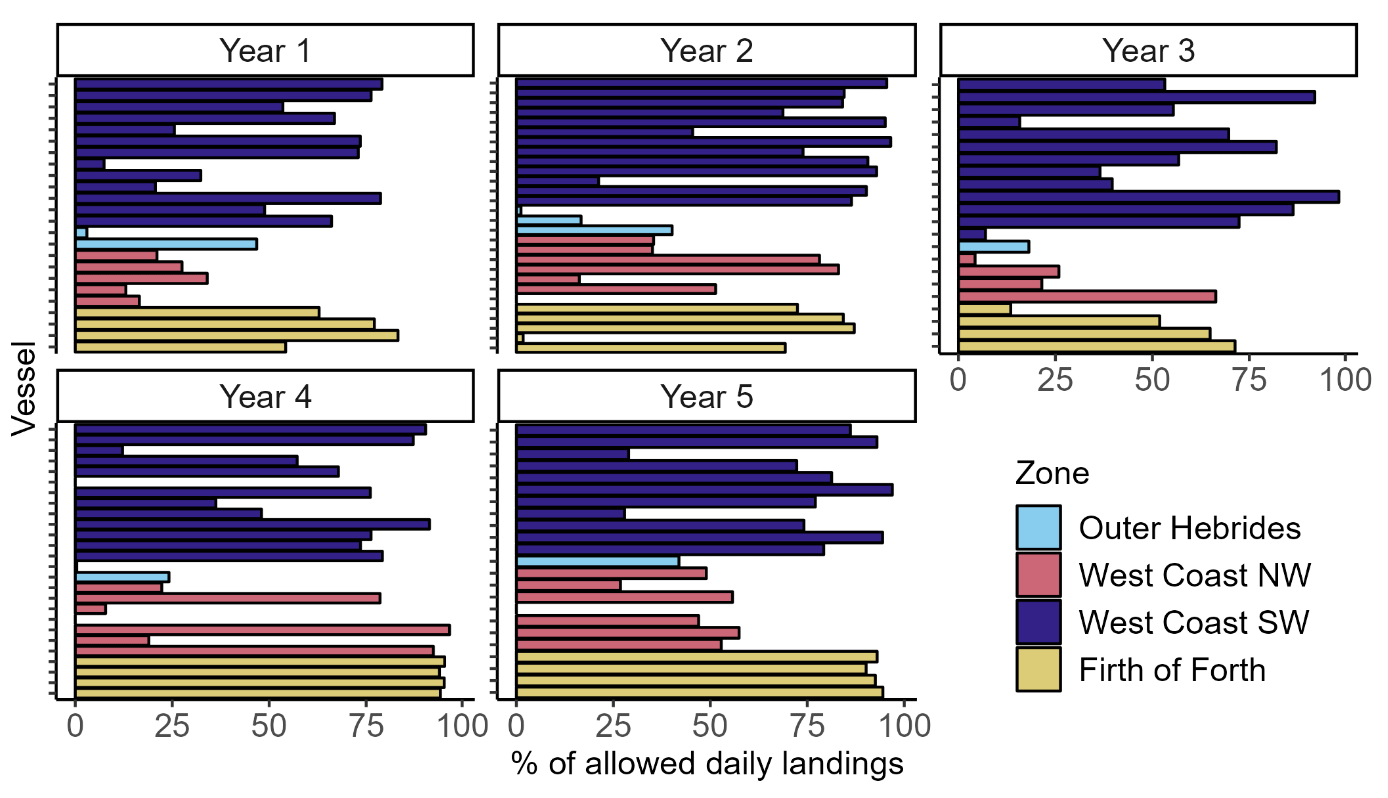
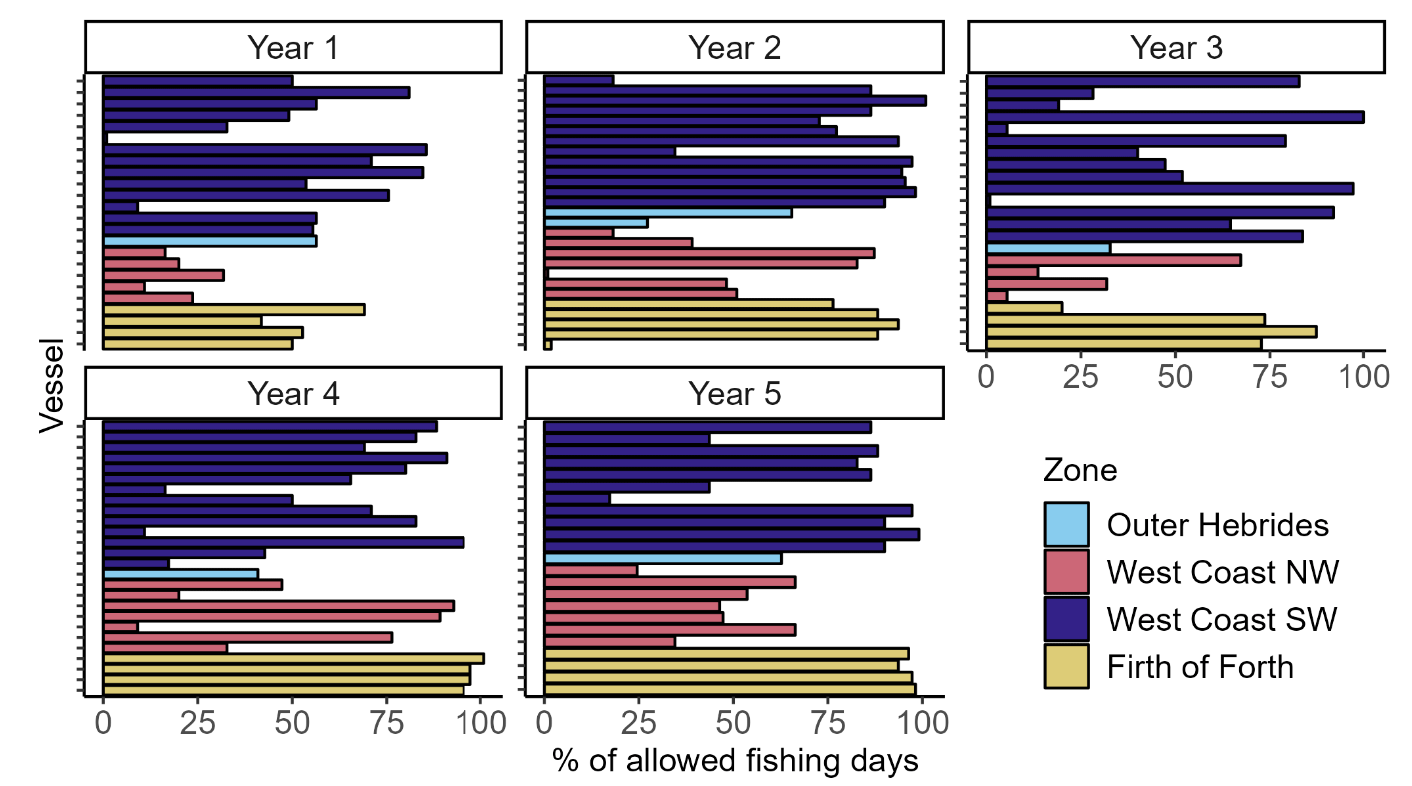
Most fishing vessels on the razor clam trial are not utilising the daily landing limits (Figure 12). Vessels fishing in the West Coast SW, West Coast NW and Firth of Forth have increased their percentage use of allowed daily landing limits over the Trial Years 1-5, and this also corresponds to the increase in the number of fishing days (Figure 13).
A summary of fishing activity for each trial area within the four zones is provided in Appendix 4. Landings per unit effort (LPUE) were calculated as landings (kg) per hour fished by dividing the reported landings (kg) by the number of hours fished (derived from REM) for each vessel on each day fished. This revealed different trends in each trial area. An increase in the LPUE was observed for Broad Bay and Colonsay, the LPUE appears stable in Coll and Tiree, but decreasing in Clyde, Wigtown Bay and Firth of Forth. However, these trends should be interpreted with caution because of some very high starting points, the changes in vessels at different times in the trial fishery, and in context of the spatial footprint of the fishing activity.
The overall spatial footprint of the razor clam electrofishery is small, with grounds typically targeted close to the shore to a maximum depth of approximately 10 m (see spatial plots provided for each trial area in Appendix 4). Only a small portion of the trial areas are fished due to the sediment habitat of razor clams, the depths that can safely be fished using this method (length of wires and safety of divers), and the requirement for the areas to be classified by Food Standards Scotland. Fishing activity is highest in the Clyde, which corresponds with the highest number of vessels and landings of razor clams.
Length Cohort Analysis
Estimates of fishing mortality in relation to FMSY estimated from the LCAs are shown in Table 10. For both areas, this is the first stock assessment for razor clams, and Fmax from this assessment was used as a proxy for FMSY (i.e., Fmax = FMSY). This is aligned with approaches that have been applied to crab, lobsters and Nephrops assessments using LCAs (ICES, 2010; Mesquita et al., 2023). In addition, given the influence of growth parameters on the LCAs, different combinations of these parameters were used in the assessment to better understand the sensitivity of LCA (and the resulting perception of stock status) to these parameters.
For both areas in all scenarios, fishing mortality (Fbar) is estimated to be below FMSY. For most scenarios (excluding scenario 1 for the Firth of Forth and scenario 7 for both areas), the FMSY proxy was not estimated because there was no maximum value of Fmax found over the range examined up to 500% increase on Fbar (500% is the maximum increase on Fbar allowed by the LCA software programme used to perform these assessments, see Table 10).
| Scenario | Area | Growth parameters | Fbar position | ||||
|---|---|---|---|---|---|---|---|
| to FMSY | |||||||
| Linf (mm) | K | M | Fbar | FMSY | |||
| 1 | Firth of Clyde | 196 | 0.11 | 0.1 | 0.008 | >0.05* | below |
| Firth of Forth | 0.02 | >0.12* | below | ||||
| 2 | Firth of Clyde | 196 | 0.11 | 0.16 | 0.003 | >0.02* | below |
| Firth of Forth | 0.006 | >0.04* | below | ||||
| 3 | Firth of Clyde | 196 | 0.27 | 0.1 | 0.06 | >0.34* | below |
| Firth of Forth | 0.14 | 0.54 | below | ||||
| 4 | Firth of Clyde | 196 | 0.27 | 0.16 | 0.04 | >0.22* | below |
| Firth of Forth | 0.09 | >0.53* | below | ||||
| 5 | Firth of Clyde | 207 | 0.11 | 0.1 | 0.03 | >0.18* | below |
| Firth of Forth | 0.07 | >0.43* | below | ||||
| 6 | Firth of Clyde | 207 | 0.11 | 0.16 | 0.01 | >0.06* | below |
| Firth of Forth | 0.03 | >0.16* | below | ||||
| 7 | Firth of Clyde | 207 | 0.27 | 0.1 | 0.17 | 0.43 | below |
| Firth of Forth | 0.35 | 0.62 | below | ||||
| 8 | Firth of Clyde | 207 | 0.27 | 0.16 | 0.12 | >0.71* | below |
| Firth of Forth | 0.26 | >1.06* | below | ||||
* FMSY proxy exact value not calculated as FMSY > 6*Fbar (FMSY not found over the effort range examined of up to 500% increase on Fbar).
Geostatistics and survey-based abundance estimates
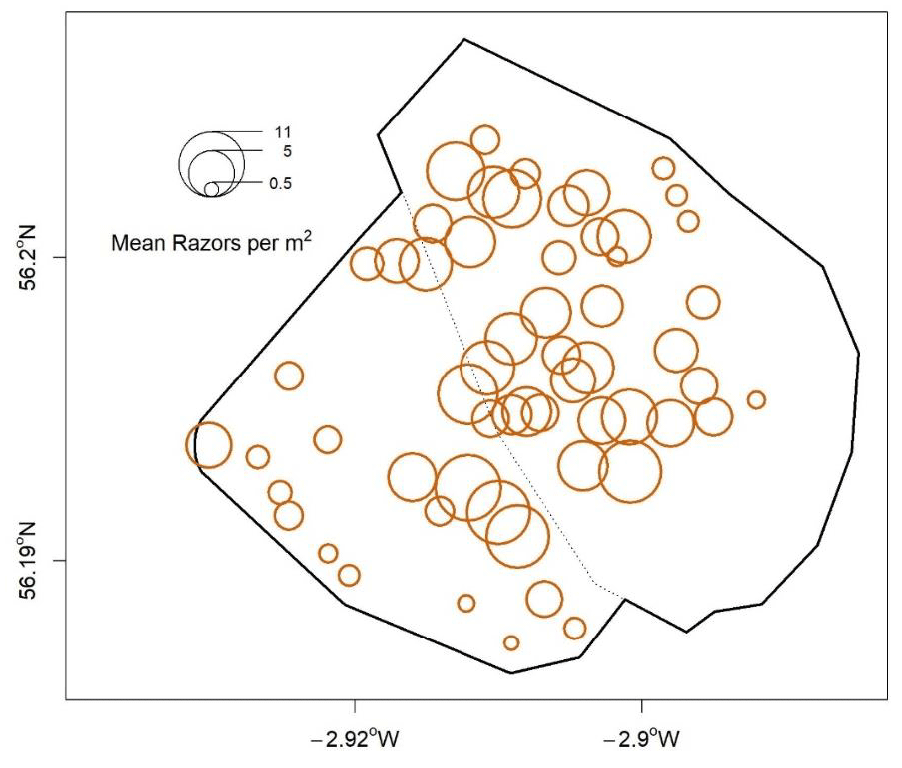
Largo Bay (fishing grounds within the Firth of Forth trial area) razor clam densities were calculated based on 2020 survey data collected by SAMS (Fox, 2021) (Figure 14). The density of razor clams (for all sizes) was highest in the central part of the survey area. Razor clams were also observed in the southwestern region and in deeper waters, which are typically not fished because of the need for longer cables and the increased time divers would spend underwater.
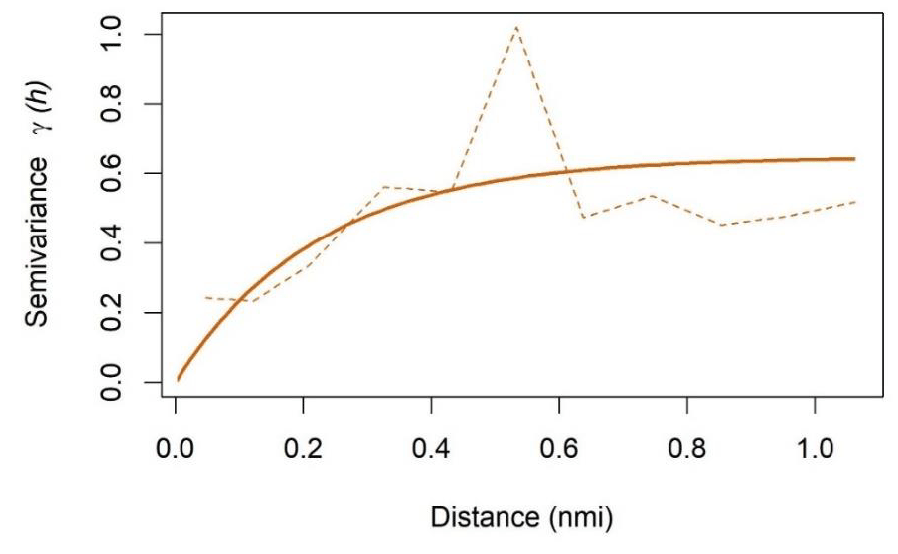
For each razor clam size category, an experimental variogram was calculated from the 2020 razor clam survey density data, to which exponential variogram models were fitted (Figure 15). Sensitivity of abundance estimates to variogram lag parameters was tested (Appendix 1).
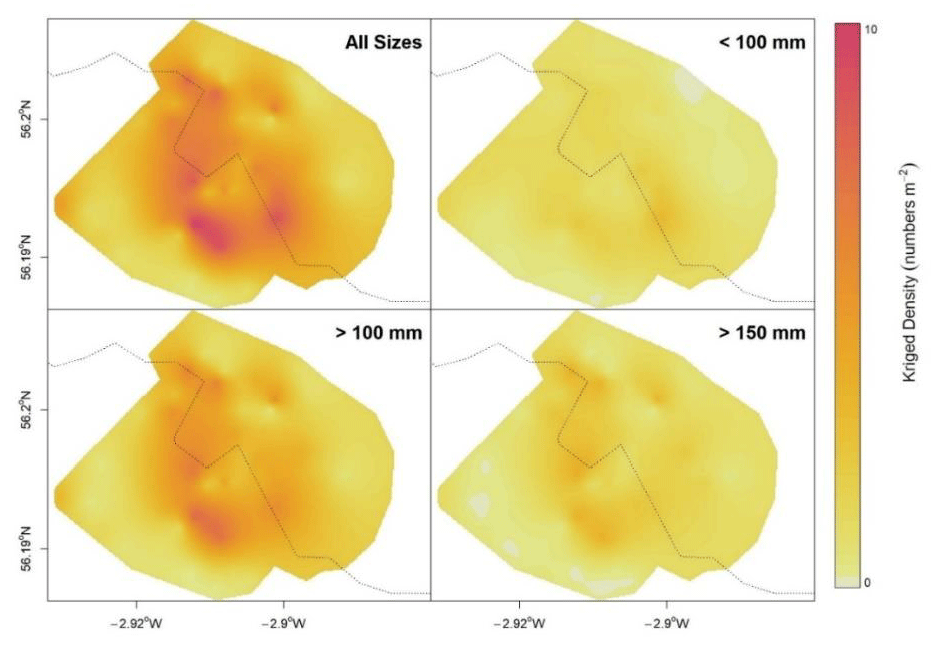
Spatially explicit swept-area based razor clam density estimates were obtained from the 2020 Largo Bay field survey, for four size categories: all sizes, <100 mm, >100 mm, and >150 mm total shell lengths. Kriged surface grids provide illustrative maps of the spatial distribution of each size category of razor clams within the Largo Bay stock area (Figure 16). The highest densities of razor clams occurred around the 5 m bathymetric contour, although this spatial pattern was less apparent in the <100 mm and >150 mm size classes.
The majority of estimated razor clam abundance in Largo Bay was composed of individuals from the greater than 100 mm size category (Figure 17), with lower estimated abundances of razor clams in the larger (>150 mm) and smaller (<100 mm) size classes.
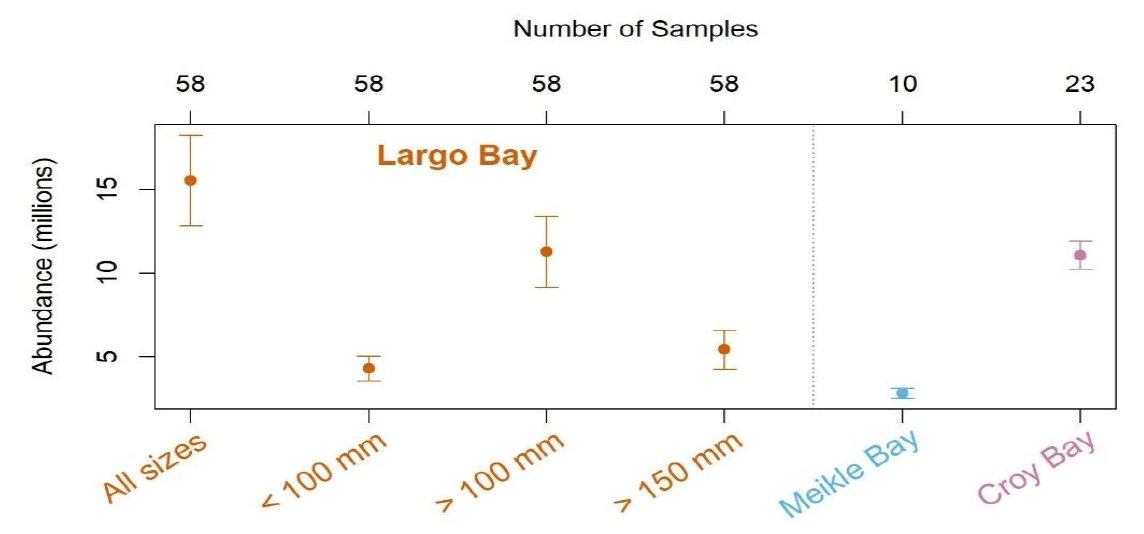
Harvest rates for each size category of estimated abundance in Largo Bay are presented in Table 11. The highest harvest rate was estimated as 11.83% for razor clams >150 mm (self-sample length frequencies for razor clams in Largo Bay in 2020 ranged from 145-215 mm).
| Size Category | Abundance (millions) | Removals (millions) | Harvest Rate (%) |
|---|---|---|---|
| All Sizes | 15.57 | 0.64 | 4.14 |
| < 100 mm | 4.30 | 0.00 | 0.00 |
| > 100 mm | 11.30 | 0.64 | 5.70 |
| > 150 mm | 5.42 | 0.64 | 11.83 |
Contact
There is a problem
Thanks for your feedback