National litter and flytipping strategy: baseline report
This report was completed as part of the National Litter and Flytipping Strategy (NLFS) year one action plan, action 18; to Improving consistency of flytipping data data by developing a flytipping baseline for Scotland, identifying data gaps and changes that may be needed in the future.
Key findings – flytipping incidents
The following section provides an overview of the key findings on flytipping incidents in Scotland. This report is accompanied by a Baseline Data File, which provides a more detailed breakdown of the key data gathered.
Scotland has 32 local authorities, all of which use their own internal systems for recording flytipping incidents. Given citizens are advised to contact the local authority in the area where the flytipping has occurred, local authorities are likely to hold the most robust data on flytipping incidents. One of the main barriers to developing a national baseline was local authority input and engagement. While we were able to gather primary data from just under 50% of local authorities, a large proportion did not share data as part of the project. This means that a full data set that is representative of the whole of Scotland has not been developed. There are a number of reasons why local authorities did not share data on flytipping incidents, and this challenge should be recognised when looking to collate this information in the future.
Total number of incidents reported and monthly breakdown
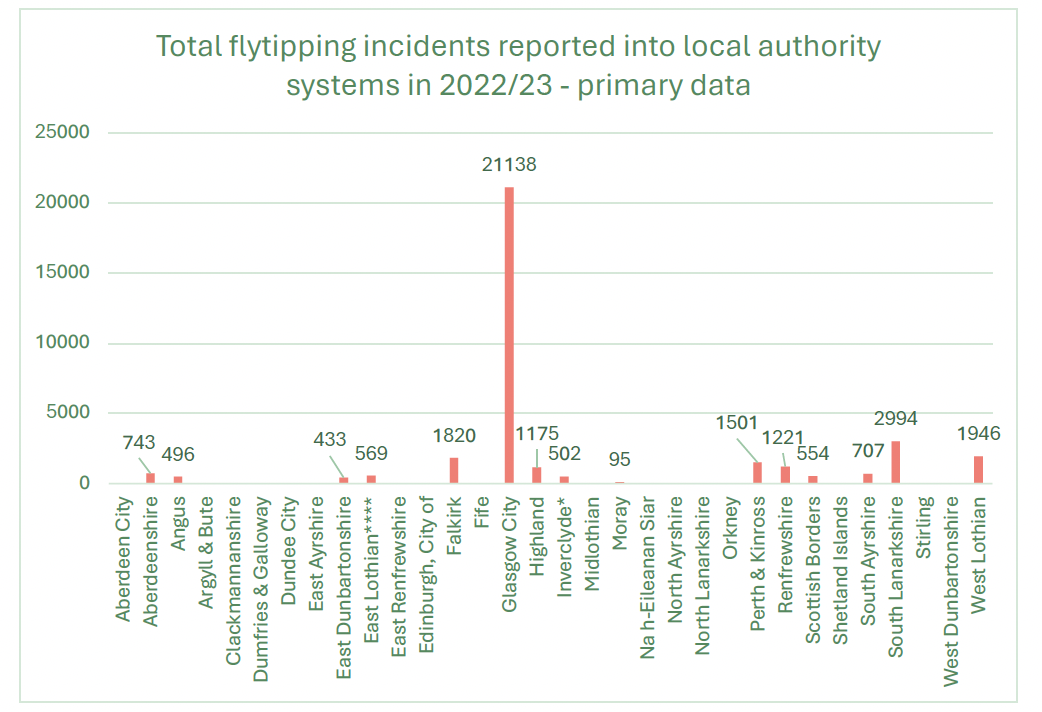
Through primary data gathering we were able to obtain data from 15 local authorities (47% of all Scottish local authorities). 14 provided data directly to Anthesis, while one publishes this data on their website annually. All local authorities were given the opportunity to provide primary data to the project, with 18 choosing not to engage. The lack of engagement from the remaining 18 local authorities who did not submit data is likely due to a number of reasons including internal resource challenges, data format and/or not seeing the benefits of inputting to the baseline’s development. As seen in Figure 2, and as would be expected based on population, Glasgow City had the highest number of incidents reported of all the local authorities who submitted data.
It should be noted that there is no nationally-agreed upon definition as to what constitutes a ‘flytipping incident’, so different local authority datasets will include different things. In addition there is a lack of consistency in reporting styles and sub-categories (waste type, land type, size) between local authorities.
While Figure 2 gives an overview of total incidents reported into local authority systems, it should be noted that there are also public reporting concerns. Often members of the public will report side waste (waste left beside bins) and items put out for authorised bulky waste collections. In addition (and depending on the degree of data cleansing carried out by the local authority or by Anthesis as part of this project) there may be duplicate reports or items that were subsequently found to not be flytipping. A large proportion of flytipping incidents on private land are often not recorded or reported. Private landowners/ organisations representing private landowners were approached for input, however, given the challenges in recording incidents of flytipping on private land, we only received limited data. See Appendix 2 – private landowner engagementfor the list of survey questions. As a result of the factors outlined, the baseline dataset obtained as part of this report is incomplete and should be viewed with these caveats in mind.
Given primary data gathered directly from local authorities does not provide full coverage, the project also utilised secondary data from a Scottish Liberal Democratics[11] data set of flytipping incidents reported and enforcement actions undertaken. This information was gathered by the Scottish Liberal Democrats under individual Freedom of Information (FOI) requests to all local authorities. It should be noted that not all authorities responded to the FOI request, and some provided calendar year data rather than financial year, so it is not necessarily comparable to primary data gathered as part of the project (which was financial year) or between authorities.
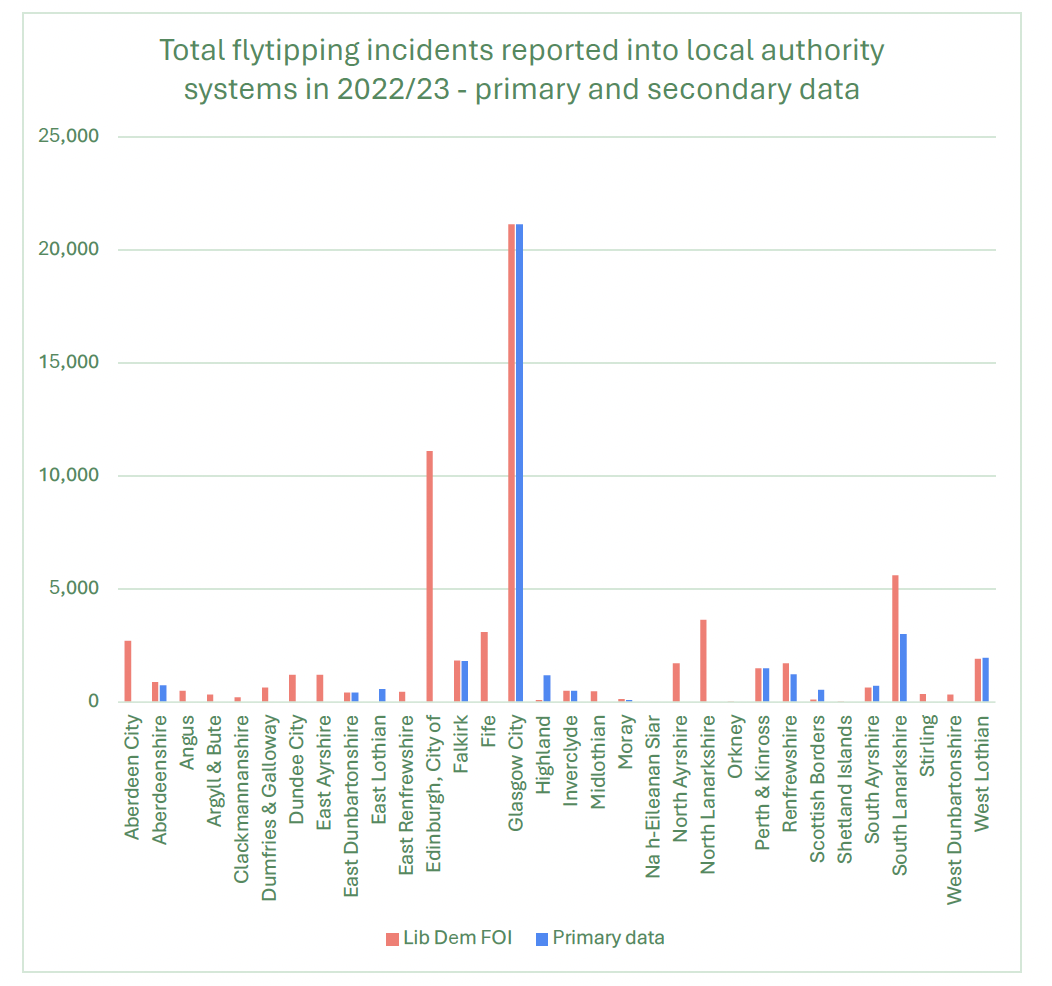
In 2022/23 there were 63,378 to 64,486 flytipping incident reports made directly to local authority systems, depending on data source (Table 1). In addition to some data covering calendar year rather than financial, it is also possible that other variables such as the removal of duplicates or classifications could result in the difference. Figure 3 shows the primary data collected as part of the project alongside the secondary FOI data – as noted this should be interpretated with caution due to the caveats outlined. Numerical data sets for both primary and secondary data (split by local authority) can be found in the Baseline Data File.
(Table 1) Total number of incidents reported in Scotland in 2022/23 from primary and secondary data
Total incidents reported – 2022/23
Total incidents reported – Liberal Democrat FOI issued to all local authorities; excludes data for two authorities who did not provide data in 2022/23: 64,486
Total incidents reported – primary data gathered from 15 local authorities, Loch Lomond and the Trossachs National Park Authority plus Liberal Democrat FOI data for those who did not provide data: 63,385
Please note three authorities provided the Liberal Democrat FOI with calendar rather than financial year data; one local authority provided Anthesis with data but not the FOI
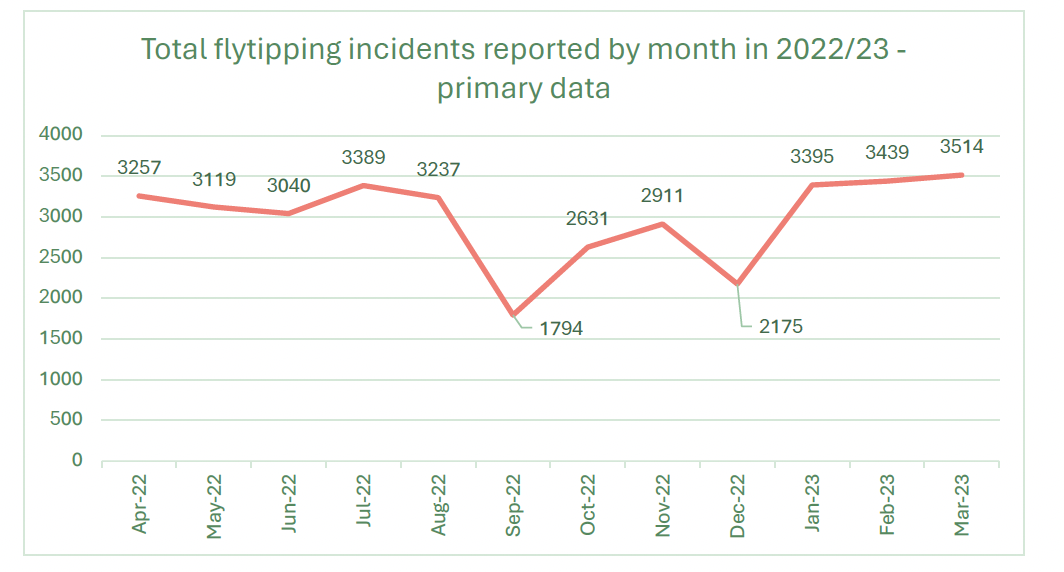
As well as total incidents reported over the financial year 2022/23, the primary data request to local authorities also looked to gather granular data on the month of the flytipping incident. Figure 4 shows the total number of flytipping incidents reported to local authorities by month in 2022/23. While a potential fall in incidents reported is indicated in September 2022 it is challenging to assess any real peaks and troughs or trends given there is only data for one year and because primary data split by month is only available for 15 out of 32 authorities.
Figure 4 Total flytipping incidents reported by month in 2022/23 from primary data shared with Anthesis. As such this graph only represents incidents from 15 authorities and does not give a Scotland wide overview.
Additional incident data
Reporting via Dumb Dumpers
Until March 2023 the public could also report flytipping incidents through the national reporting service, Dumb Dumpers. Dumb Dumpers’ reports came into SEPA’s Contact Centre (SCC). SCC triaged reports based on the details of the incident, with the vast majority of reports forwarded to local authorities[12]. The remainder of reports were sent to SEPA’s local geographic teams for management. This means there is likely to be significant double counting of incidents from those local authorities who provided primary data, and with the Liberal Democrat FOI data. Many of the incidents reported through Dumb Dumpers will already have been reported directly to local authorities as Dumb Dumpers was often used as a secondary reporting tool for the public who were unaware of the role for different systems and enforcement bodies.
Dumb Dumpers data provided by SEPA for the financial year 2022/23 is broken down by month and local authority. Information on waste source/type and size is held within individual reports. Prior to the SEPA cyber-attack in December 2020, this information was automatically pulled out of reports in a way which would have allowed analysis, however, this is not the case for data collected from 2021 onwards. In the financial year 2022/23 there were 1,753 reports made via Dumb Dumpers. Due to the high likelihood of double counting, as outlined above, this data has not been added into the total incident data shown in Figure 2 or Figure 4. The Dumb Dumpers data was not used for those authorities who did not provide primary data as the Scottish Liberal Democrat FOI data was deemed to be a more complete source of data.
Reporting via Police Scotland
While Police Scotland may keep a record of some flytipping incidents reported into them, they advise that only active incidents should be reported to the police. If the flytipping incident has already occurred and is non-hazardous, near a brook, stream or water course, citizens should report the incident to their local authority[13]. Given only “live” flytipping incidents should be reported to the police it is unlikely that Police Scotland hold a significant amount of data on flytipping incidents that are not already accounted for in local authority figures as the main reporting route.
Initial engagement with Police Scotland as part of the project suggested that an FOI request would be required to obtain data. Given the project timeframe and scope, a direct FOI request was not made to Police Scotland. Instead, there are already a number of published FOI responses related to Police Scotland action on flytipping, which we reviewed as part of the data gathering process.
In a 2022 FOI request[14] Police Scotland were asked “how many flytipping incidents Police Scotland officers have issued fixed penalty notices with regards to since the start of the 2017 calendar year”. The response stated that “Police Scotland are not involved in issuing fixed penalty notices in regards to littering or flytipping. This is a matter that is dealt with by local councils”.
In addition to the 2022 FOI, a further FOI was released in February 2024[15]. The 2024 FOI requested the following information from Police Scotland:
- When a flytipping incidents occurs, do you record how the flytipped materials are disposed?
- Do you collect information on any factors that might explain changes in flytipping frequency?
- Do you use technology to support the identification and management of flytipping?
- Have you carried out any flytipping prevention activities or interventions in the last three financial years?
- Did you work with any internal or external partners when planning flytipping prevention activities or interventions?
- Have you collected data on the impact and/or effectiveness of these flytipping prevention activities?
In response to the February 2024 FOI request, Police Scotland stated “this information is not held by Police Scotland”. The response further clarified that “Police Scotland are not routinely involved in the response to littering or flytipping except where incidents are ongoing. These matters are predominantly enforced by local authorities and they, for example, issue the relevant fixed penalty notices etc. SEPA also have a role to play where the waste is believed to be of a hazardous nature or is near a watercourse”.
Flytipping incidents on private land
A large proportion of flytipping incidents on private land are often not recorded or reported. This means that the total number of flytipping incidents in Scotland is likely to be higher than those reported into local authority systems and shared via FOI releases or primary data collected for this project. While this project sought primary data from landowners and organisations representing landowners it is particularly challenging for this group given the challenges in recording incidents of flytipping on private land. In addition, the short project timeframe likely impacted on private landowners/organisations representing private landowners in being able to collate and share this data. See Appendix 2 – private landowner engagement for the list of survey questions.
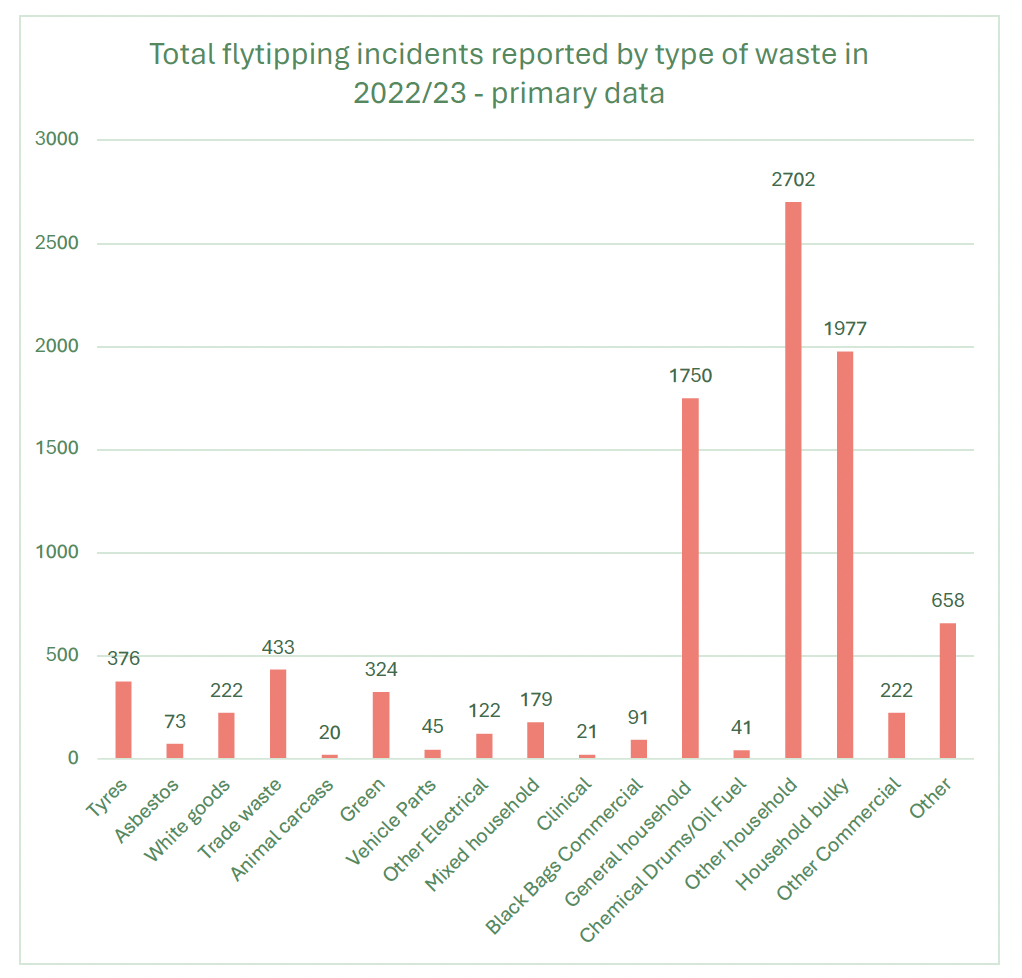
Figure 5 Total number of flytipping incidents reported by waste type in 2022/23 from primary data shared. As such this graph only represents incidents from those authorities that provided this split and does not give a Scotland wide overview.
Incidents split by waste type
In addition to gathering total incident data split by month, data on waste type was sought from local authorities. Of the 14 authorities who provided primary data, ten provided data on waste type (71% of all authorities who provided data directly; 31% of all Scottish local authorities). Two local authorities who provided data on total flytipping incidents do not collect and/or did not provide data on waste type. Waste type could not be extracted from the data shared by one authority and another only provided information for one waste type and these figures did not correlate to their total figures.
The data provided on waste type varied between authorities, with multiple categories used. Anthesis carried out data rationalisation to reduce the total number of categories where different local authorities had used similar categorisation (see Appendix 3 – data rationalisation. As seen in Figure 5 the most common waste category for flytipped items was general household (black bags and general waste), household bulky (furniture, bulky waste and mattresses) and other household (e.g., scrap metal, waste from household DIY, clothing).
Incidents split by land type
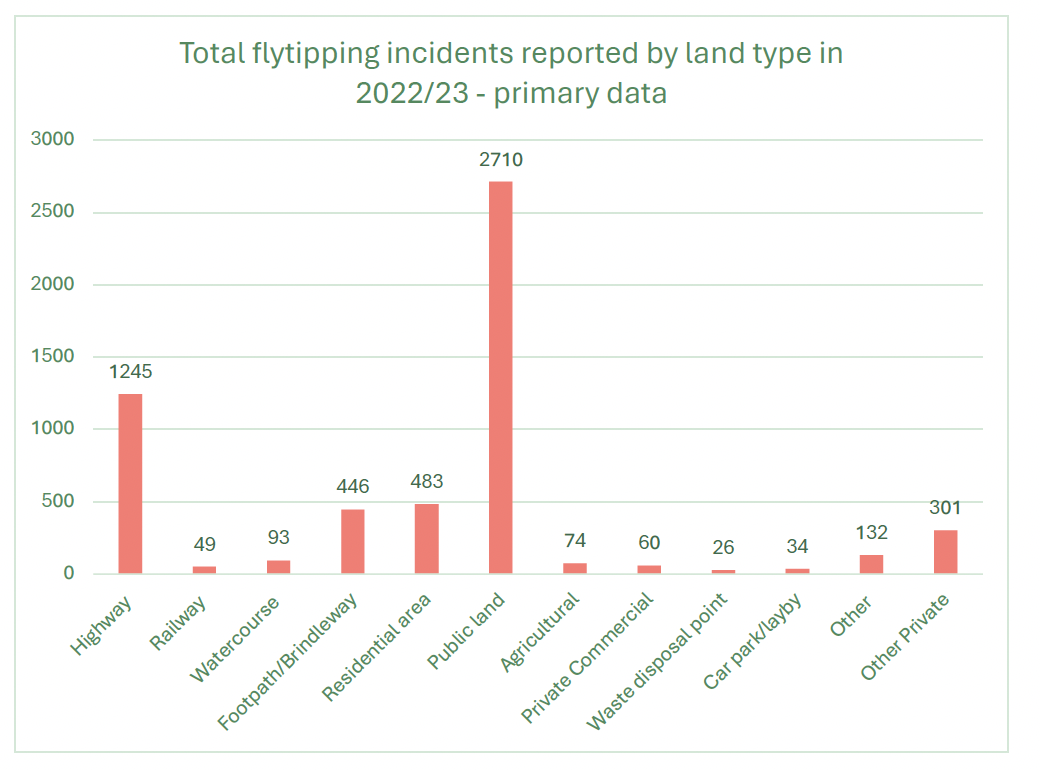
Of the 14 local authorities who provided data, six authorities provided a breakdown by land type. This equates to 43% of those authorities who provided data and 19% of all authorities in Scotland. As with waste type, Anthesis carried out data rationalisation to align similar categories (see Appendix 3 – data rationalisation. For those that provided incident data, a breakdown by land type was either not provided or it could not be determined based on the qualitative data provided. Based on the data shared, it appears that land type is often not a required reporting field.
Public land was the most common land type for flytipping incidents reported into local authority systems, followed by highways (Figure 6). It should be noted that a large proportion of flytipping incidents on private land are often not recorded or reported, so the private land categories in Figure 6 will be a significant underrepresentation of total instances on private land.
Figure 6 Total flytipping incidents reported by land type in 2022/23 from primary data shared with Anthesis. As such this graph only represents incidents from those authorities that provided this split and does not give a Scotland wide overview.
Incidents split by size of the flytipping incident
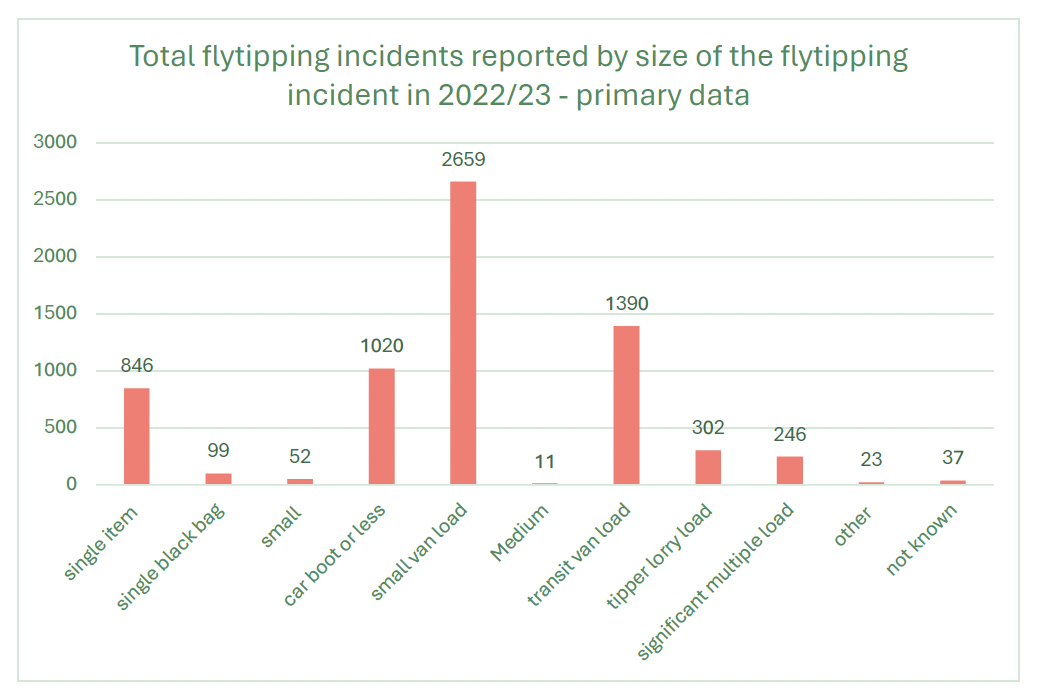
50% of those authorities who provided primary incident data also provided data on the size of the flytipping incident (representing 22% of all local authorities in Scotland). “Small van load” was the most common size category, followed by “transit van load”, “car boot or less” and “single item” (Figure 7). Of those that provided incident data, but not a breakdown by size of the flytipping incident, four authorities did not provide this data, whilst for three authorities this level of granularity could not be drawn out from the data shared.
Contact
Email: NLFS@gov.scot
There is a problem
Thanks for your feedback