Pupil projections and implications for teacher resourcing needs: education workforce modelling and research
An external report considering population projections and potential implications for education workforce resources in Scotland. This independent analysis is intended to support engagement with partners on workforce planning that enables delivery of key commitments while maximising value for money.
4. Pupil projections for Scotland
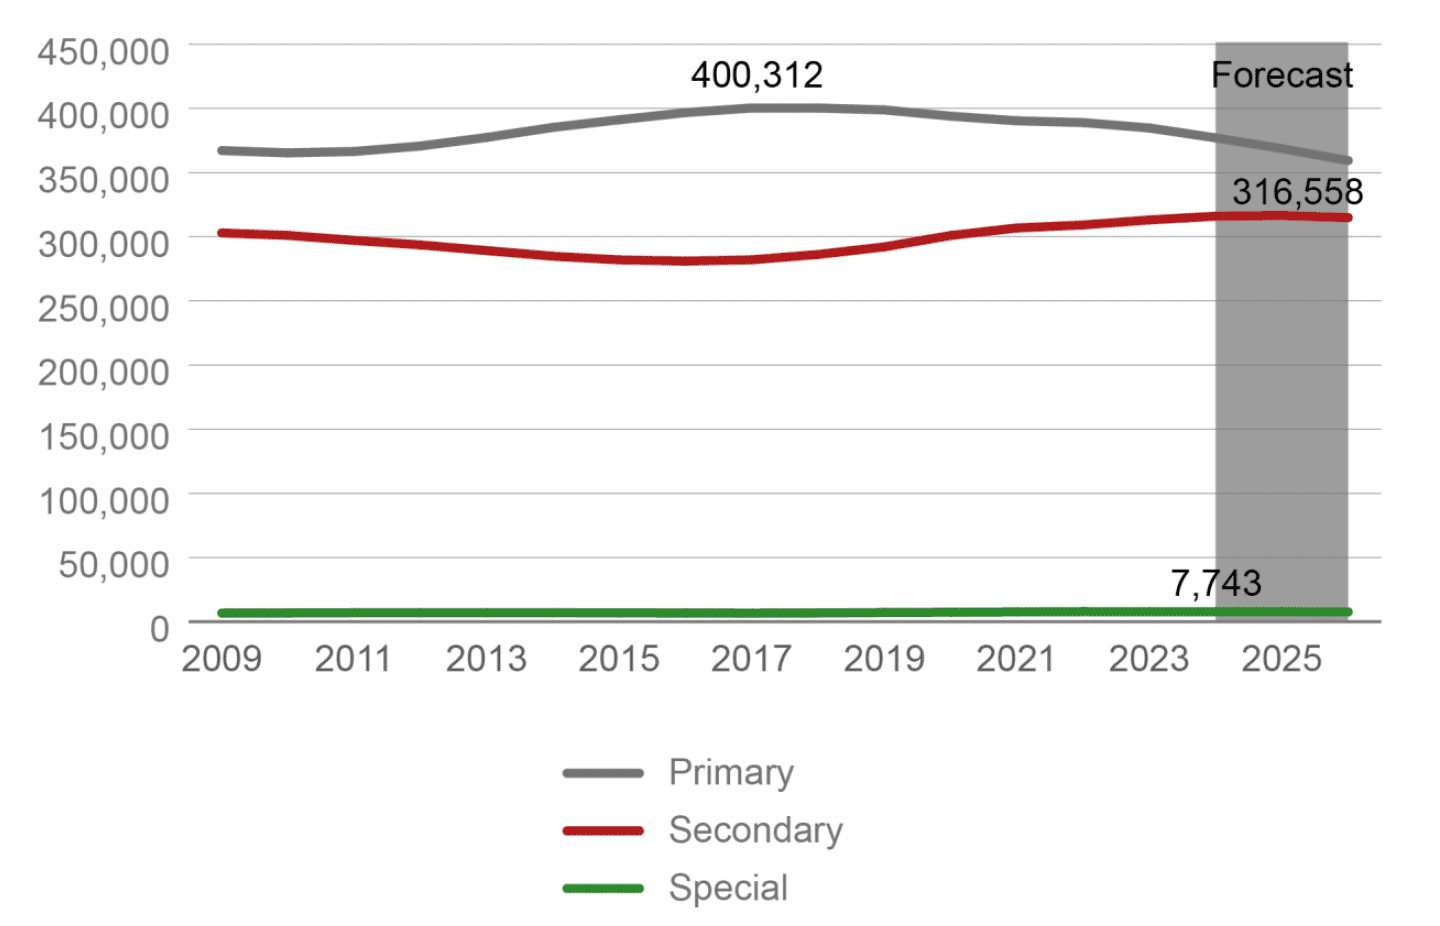
Having built an understanding of the current snapshot of how Scotland compares internationally, it is helpful to explore the projections for numbers of school-age pupils. The Office for National Statistics’ (ONS) projections suggest that the school-age population (aged 5-17) peaked at around 770,000 in 2022 (this compares to 705,874 state school pupils in the 2022 Pupil Census, as not all children and young people attend state schools). Looking specifically at pupils in state schools, the dynamics are different between school types: primary school pupils in state schools peaked at over 400,300 in 2017, special school pupils are expected to have peaked at 7,740 in 2024, while secondary school enrolment is expected to continue to increase to 316,600 pupils by 2025 (Graph 4.1).

Source: Teacher census, Scottish Government

Source: Teacher census, Scottish Government
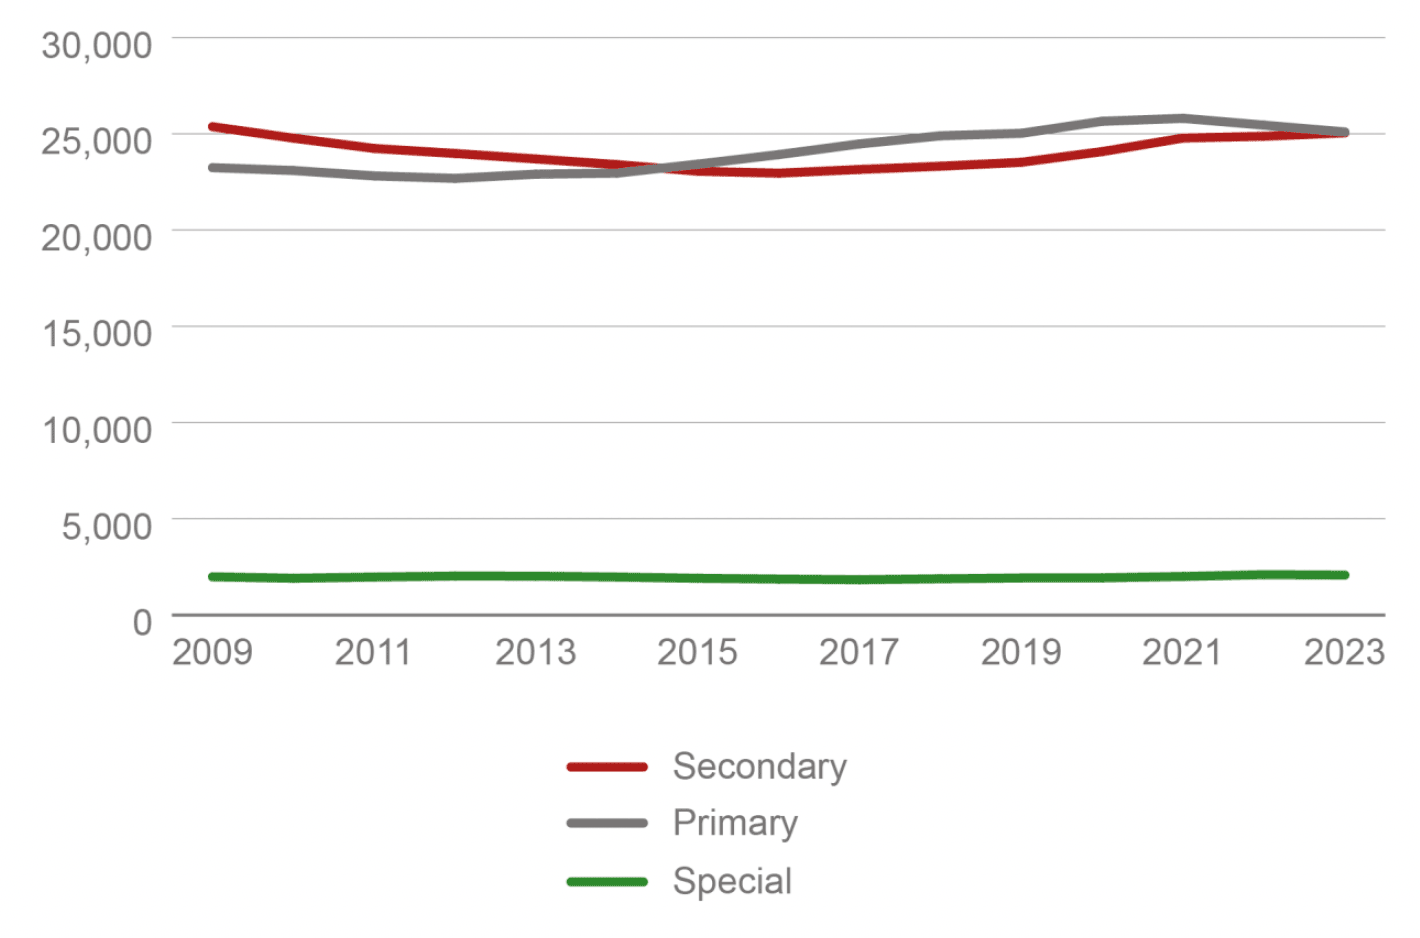
This contrasts with the trends in teacher stocks for different types of schools. Although the headline figure for teacher numbers shows a mildly shrinking workforce for two consecutive years to 2023, the trend is different by school type. The number of primary school teachers peaked in 2021, even though the number of primary pupils was already falling, while the number of special school teachers peaked in the following year, according to the teacher census[13]. However, the number of secondary school teachers continued to rise until 2023, although not as fast as the pupil population grew.
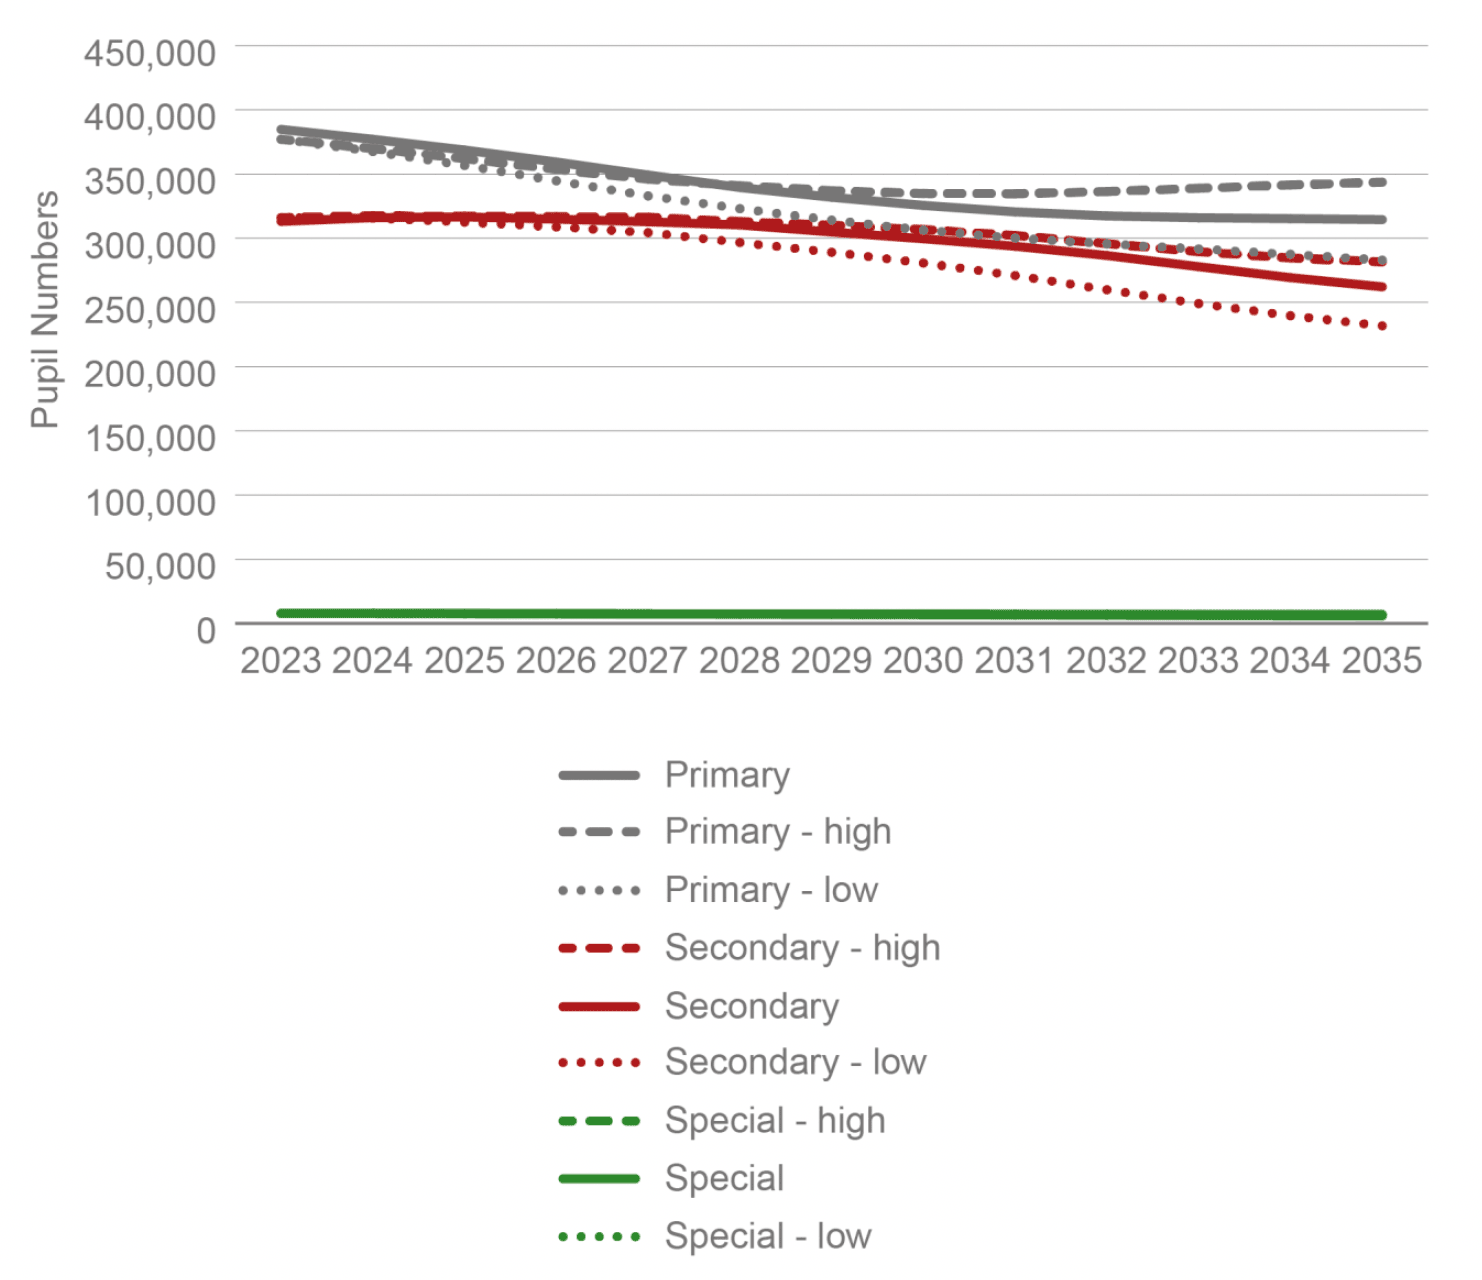
Given the different demographic trends at play, it is important to project the longer-term demand for teachers in Scotland over the coming years. Based on the ONS 2020-based interim national population projections, pupil numbers are expected to decline over our projection period to 2035, reflecting in particular that the expected impact of low fertility rates will outweigh the population growth from migration over time.
Primary school enrolments are expected to fall by 1.7% on average per year between 2022 and 2035, more prominent than the expected decline in secondary school enrolments, which are projected to fall by 1.2% per year, while special school enrolments are expected to fall by 1.3% per year.

Source: WPI Economics estimates based on data provided by the Office for National Statistics; National Records of Scotland
In order to take account of the uncertainties associated with longer-term population projections, we have also introduced high and low pupil population projections around the ONS projection (the ONS projection and our own high and low projections around this are described in the annex). The spread between low/high and the baseline projection grows to around 8.6% in 2035, reflecting the higher uncertainties as we project further into the future.
Contact
Email: zak.tuck@gov.scot
There is a problem
Thanks for your feedback