Pupil projections and implications for teacher resourcing needs: education workforce modelling and research
An external report considering population projections and potential implications for education workforce resources in Scotland. This independent analysis is intended to support engagement with partners on workforce planning that enables delivery of key commitments while maximising value for money.
5. Teacher resourcing needs under different scenarios
This chapter presents a comprehensive analysis of various scenarios aimed at informing strategic planning in the formulation of education workforce policies, considering the impact of demographic changes. Utilising an economic model as an analytical projection tool, our study examines the potential national implications related to teacher resourcing needs, PTR and teacher class contact time within a projection period out to 2035.
Scenario overview
We consider a range of scenarios to explore the interactions between policy commitments, teacher supply and demand, and resource constraints. The scenarios include:
0. maintaining a constant teacher stock;
1. enabling a reduction in class contact time by 1.5 hours per week, in line with the Scottish Government commitment;
2. maintaining the PTR at the current 13.2;
3. the PTR increasing from its current level to 13.7; and
4. increasing the number of teachers by 3,500 by 2026, in line with the Scottish Government commitment.
The aim of this analysis is not to judge which scenario is “better” or more appropriate for Scotland: we are not trying to project the “right” teacher supply but rather to examine the interactions between different policy commitments and teacher supply and demand, in the context of demographic change and resource constraints.
Our main focus is on the primary, secondary and special school teachers, measured in full-time equivalents (FTE). Centrally employed teachers currently account for around 2% of the teacher stock and we assume that this proportion remains constant throughout our projection period. Meanwhile, we have modelled the results for each scenario with high, low and baseline pupil projections. The graphical results may not include all three cases if the results between them do not differ significantly.
The following table summarises the results under each scenario in the baseline projection:
| Scenario | Description | Pupil-teacher ratio (PTR) | Class contact time (number of hours per week) | Teacher workforce requirement (FTE) | |||
|---|---|---|---|---|---|---|---|
| 2026 | 2030 | 2026 | 2030 | 2026 | 2030 | ||
| 0 | Constant teacher stock | 12.8 | 11.9 | 21.8 | 20.3 | 53,331 | 53,331 |
| 1(a) | Lowering class contact time to 21 hours per week by 2026 | 12.3 | 12.3 | 21.0 | 21.0 | 55,400 | 51,500 |
| 1(b) | Lowering class contact time to 21 hours per week by 2028 | 12.6 | 12.3 | 21.6 | 21.0 | 53,900 | 51,500 |
| 2(a) | Maintaining the PTR at 13.2 | 13.2 | 13.2 | 22.5 | 22.5 | 51,700 | 48,100 |
| 2 (b) | Maintaining the PTR at 13.2, with a higher share of teachers in standard classes | 13.2 | 13.2 | 21.0 | 21.0 | 51,500 | 47,800 |
| 3 (a) | Raising PTR to 13.7 by 2026 | 13.7 | 13.7 | 23.4 | 23.5 | 49,800 | 46,100 |
| 3 (b) | Raising PTR to 13.7 by 2026, with a higher share of teachers in standard classes | 13.7 | 13.7 | 21.0 | 21.0 | 49,800 | 46,100 |
| 4 | Teacher stocks grow in line with the SG commitment, then remain constant from 2027 | 12.1 | 11.2 | 20.6 | 19.2 | 56,400 | 56,400 |
To model the scenarios, we assume that all teachers in all school types currently have 22.5 hours of class contact time per week, i.e. the maximum contracted weekly class contact time[14]. In our modelling, we assume that class sizes will remain unchanged until 2035, so a change in the number of teachers relative to pupils will proportionately change teachers’ class contact time, as schools will be able to schedule more or fewer classes per teacher. Although this assumption is subject to certain simplifications, it lays the groundwork for further analysis.
Scenario 0: Constant teacher stock
This scenario examines the implications – in terms of PTR and class contact time – of teacher stocks remaining constant, i.e. to assume that the teacher inflows happen at a rate just sufficient to cover teacher outflows. This helps to assess the current workforce size in light of changing demographics and education workforce policy commitments. Given the downward trend in the average teacher age in Scotland over time and the consequently lower retirement rates, in practice this likely means a reducing number of teachers hired each year just to ‘stand still’ in terms of teacher stock over the projection period.
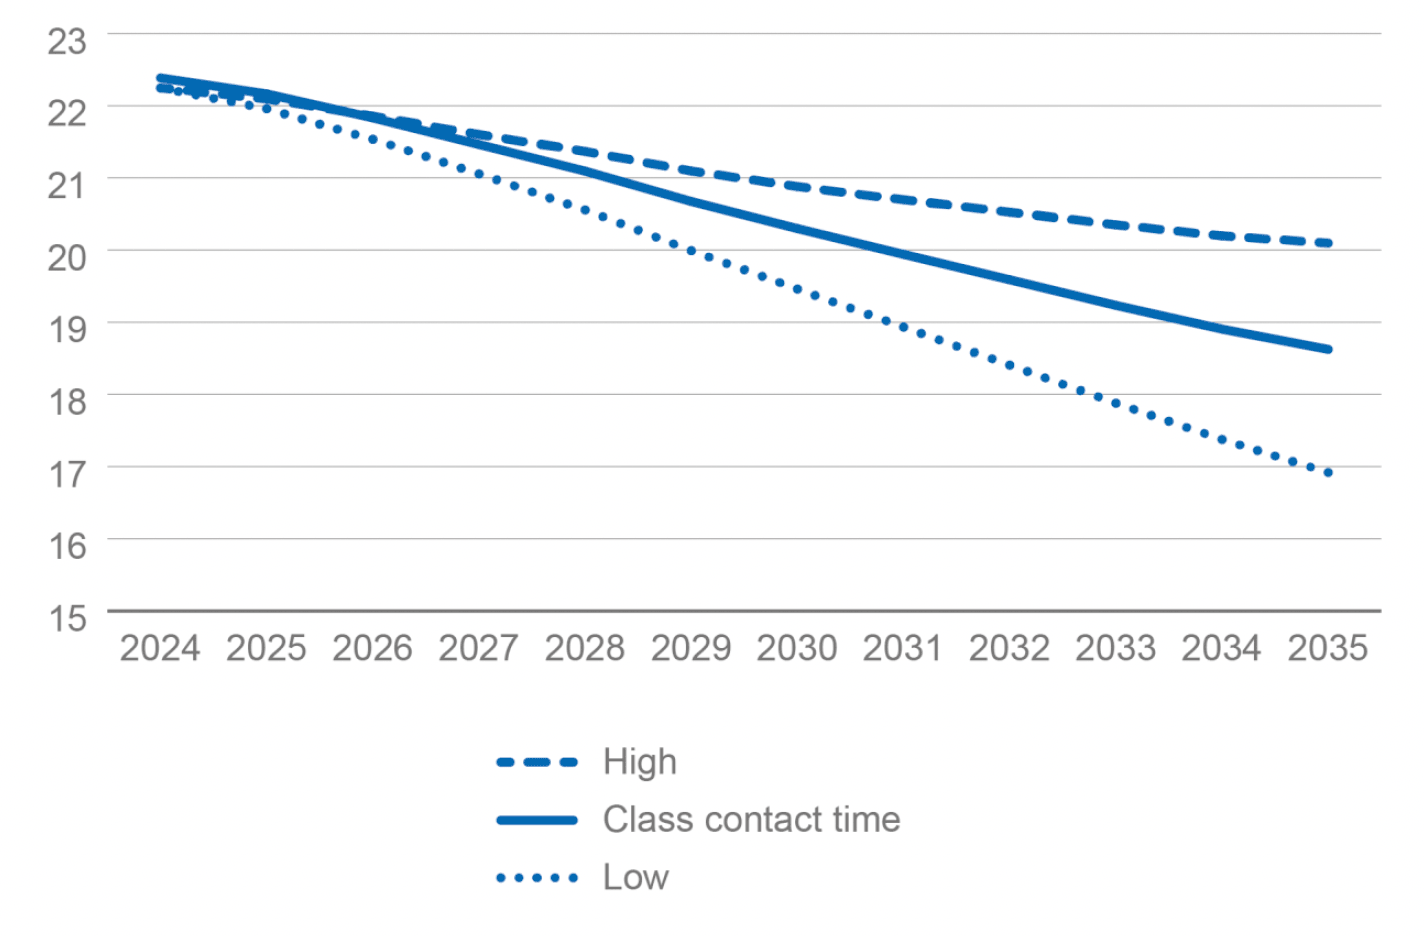
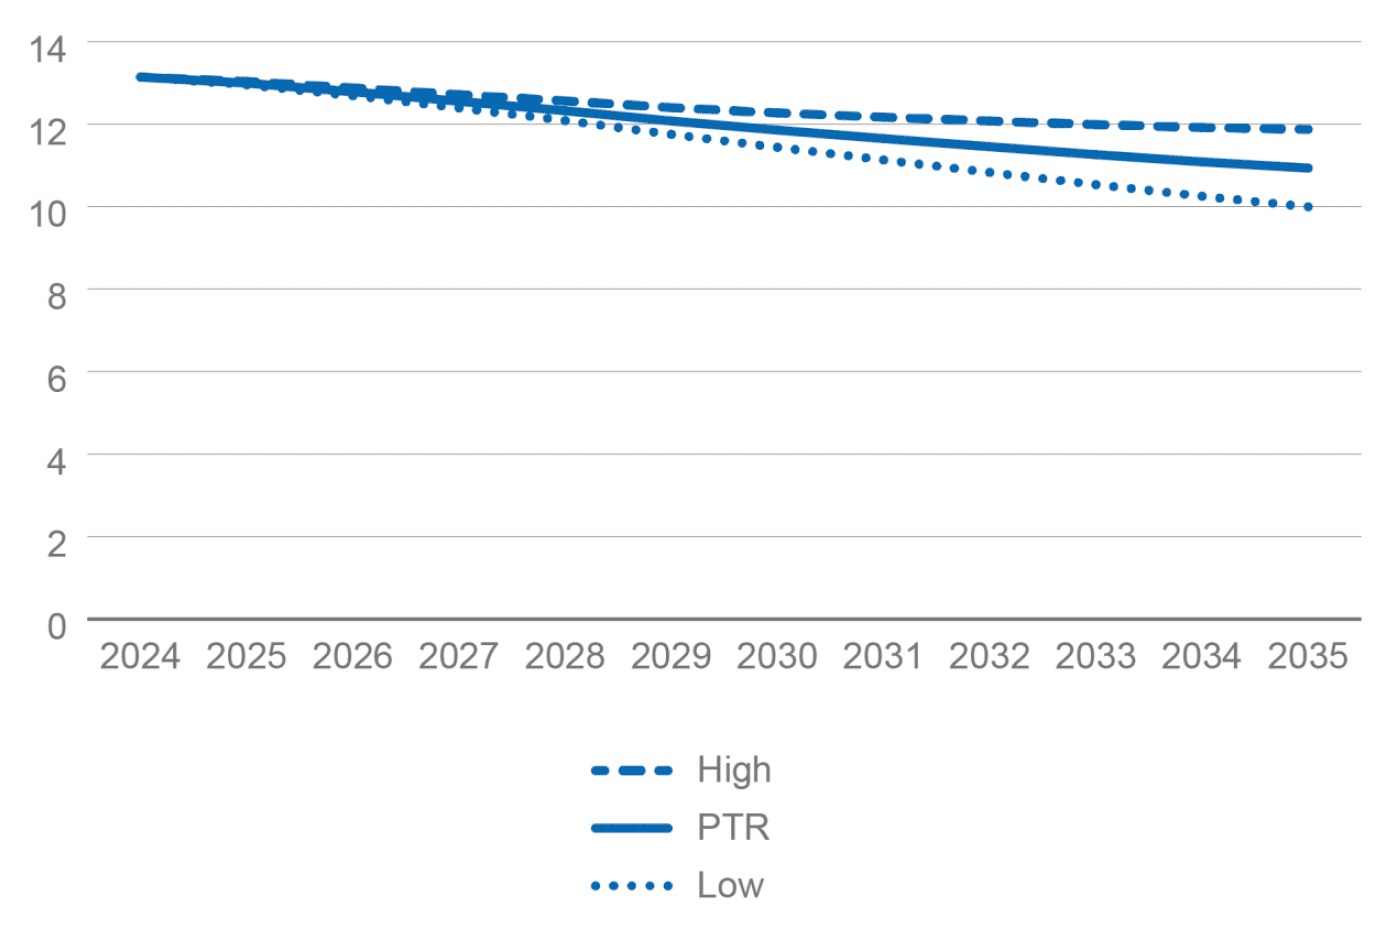
A constant teacher stock relative to a declining trend in pupil numbers enables a reduction in class contact time of 1.5 hours by 2028 in the baseline projection, although it is possible that the target could be reached a year earlier or later due to the inherent uncertainties in pupil projections. Meanwhile, in the baseline projection, there is a reduction in the PTR to 12.8 in 2026 and a further reduction to 10.9 in 2035. Taking into account the high and low pupil projections, the PTR is expected to range between 10 and 11.9 in 2035.
As such, in this ‘standstill’ scenario, the Scottish Government’s commitment to reduce class contact time by 1.5 hours could be enabled naturally as a result of declining pupil numbers, albeit around two years later than the 2026 target.
It should be noted that the reduction in class contact time of 1.5 hours across all school types by 2028 could be enabled if the proportions of primary, secondary and special school teachers are allowed to adjust (even though the overall number of teachers remain constant).
If we instead assume that the proportions of primary, secondary and special school teachers remains unchanged respectively over the next decade, the decline of class contact time could be enabled faster for primary school teachers, where the reduction of 1.5 hours is projected to be enabled by 2026, while it would be slower for secondary school teachers, enabled by around 2031, with the average reduction being 1.5 hours by 2028.
Scenario 1: Enabling a reduction in class contact time
Instead of imposing a particular workforce size and observing the consequential impact on class contact time and PTR (as in Scenario 0), this scenario explores the implications of imposing specific time profiles for a reduction in teachers’ class contact time by 1.5 hours per week, as per the Government’s 2021 Programme for Government commitment.
Therefore, in the case of a reduction in class contact time, if class sizes and pupil engagement are assumed to remain the same, all else equal, this will effectively imply a need to increase the current number of teachers. The sooner this reduction occurs, the more abrupt the increase in teacher stocks will be.
(a) Lowering class contact time to 21 hours per week by 2026
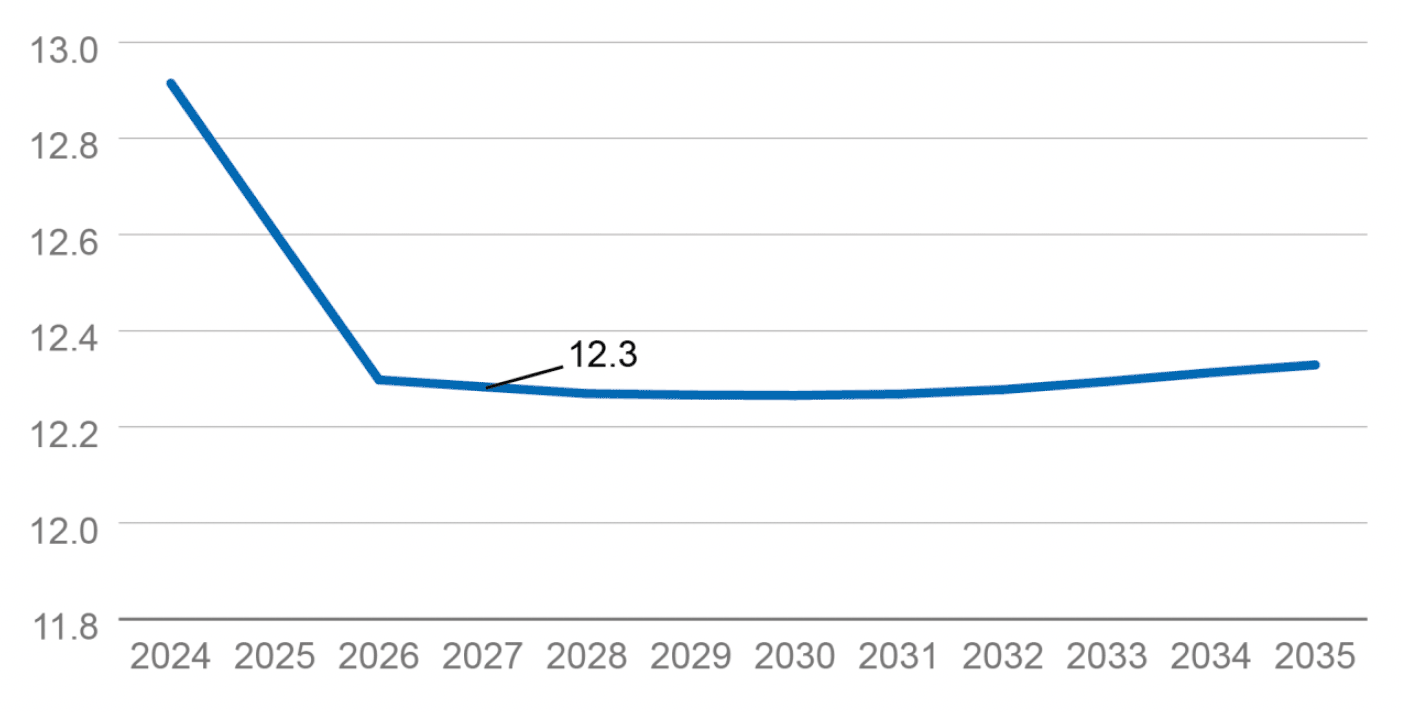
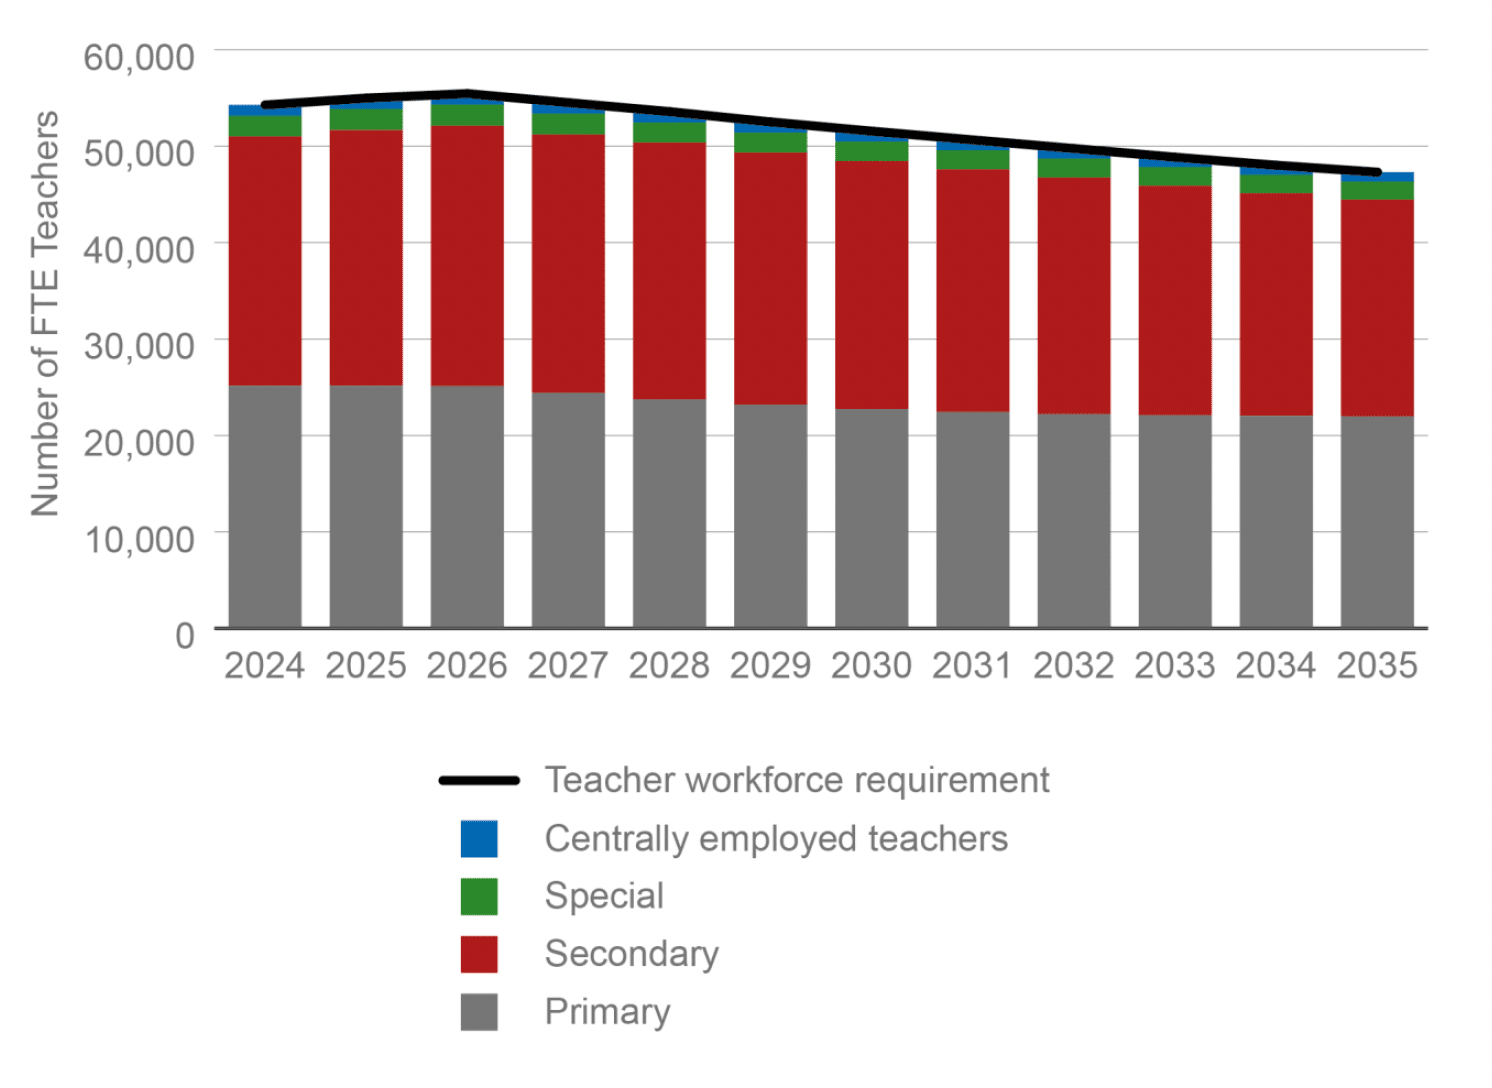
Enabling a 1.5 hour reduction in class contact time by 2026 requires an increase in teachers over that period, despite expected reductions in pupil numbers. Overall teacher demand increases by 2,100 (including centrally employed teachers) between 2022 and 2026 to 55,400 in the baseline scenario, and the national PTR falls by 0.9, from 13.2 to 12.3, over the same period. However, the teacher demand to maintain this class contact time level then gradually decreases to 47,300 by 2035, due to the declining student population.
(b) Lowering class contact time to 21 hours per week by 2028
In this alternative sub-scenario, the reduction in class contact time is instead assumed to occur two years later, by 2028. The national PTR still needs to fall to 12.3 in order to achieve a reduction of 1.5 hours, but the reduction and the profile for teacher demand is less abrupt. In the baseline projection, teacher demand only marginally increases by a much more modest 0.4% – fewer than 240 teachers – between 2022 and 2028, to around 53,600. Thereafter, it is expected to gradually decline due to the declining student population (albeit less sharply than in Scenario 1a), reaching 47,300 by 2035.
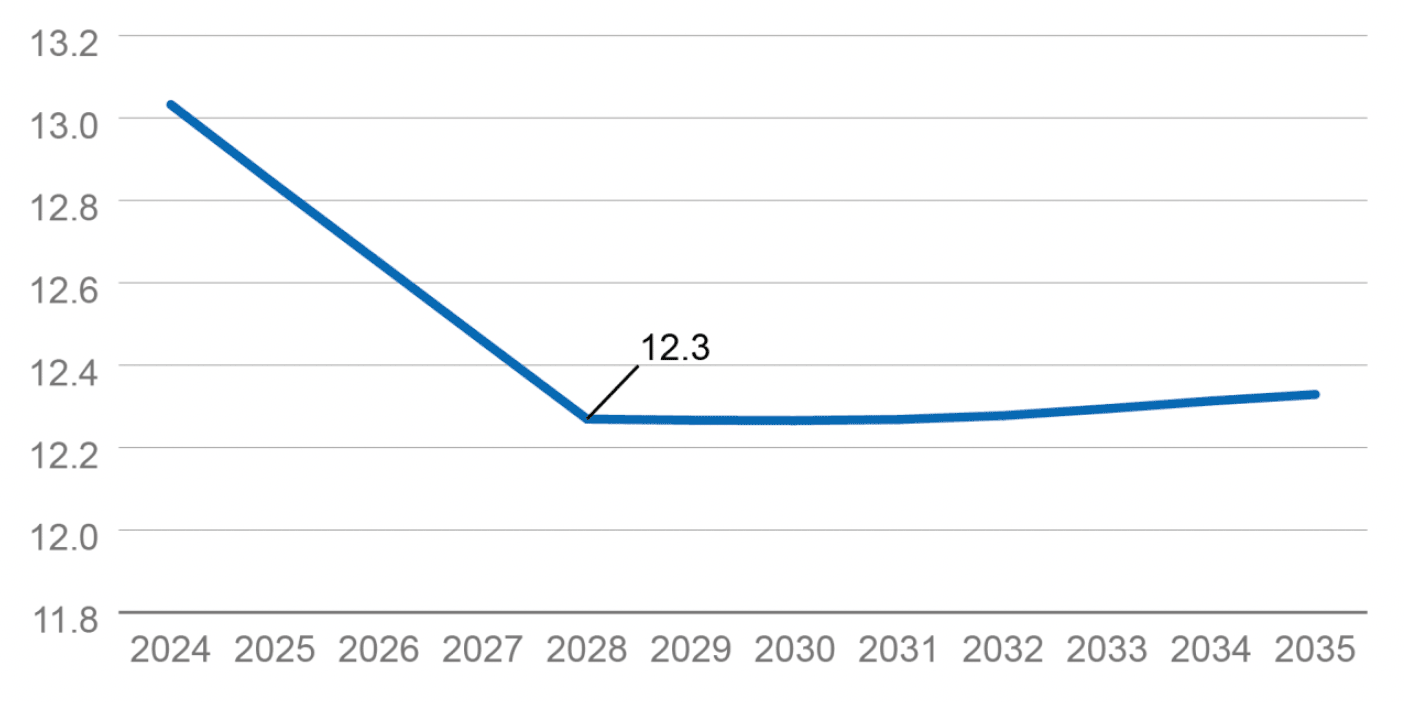
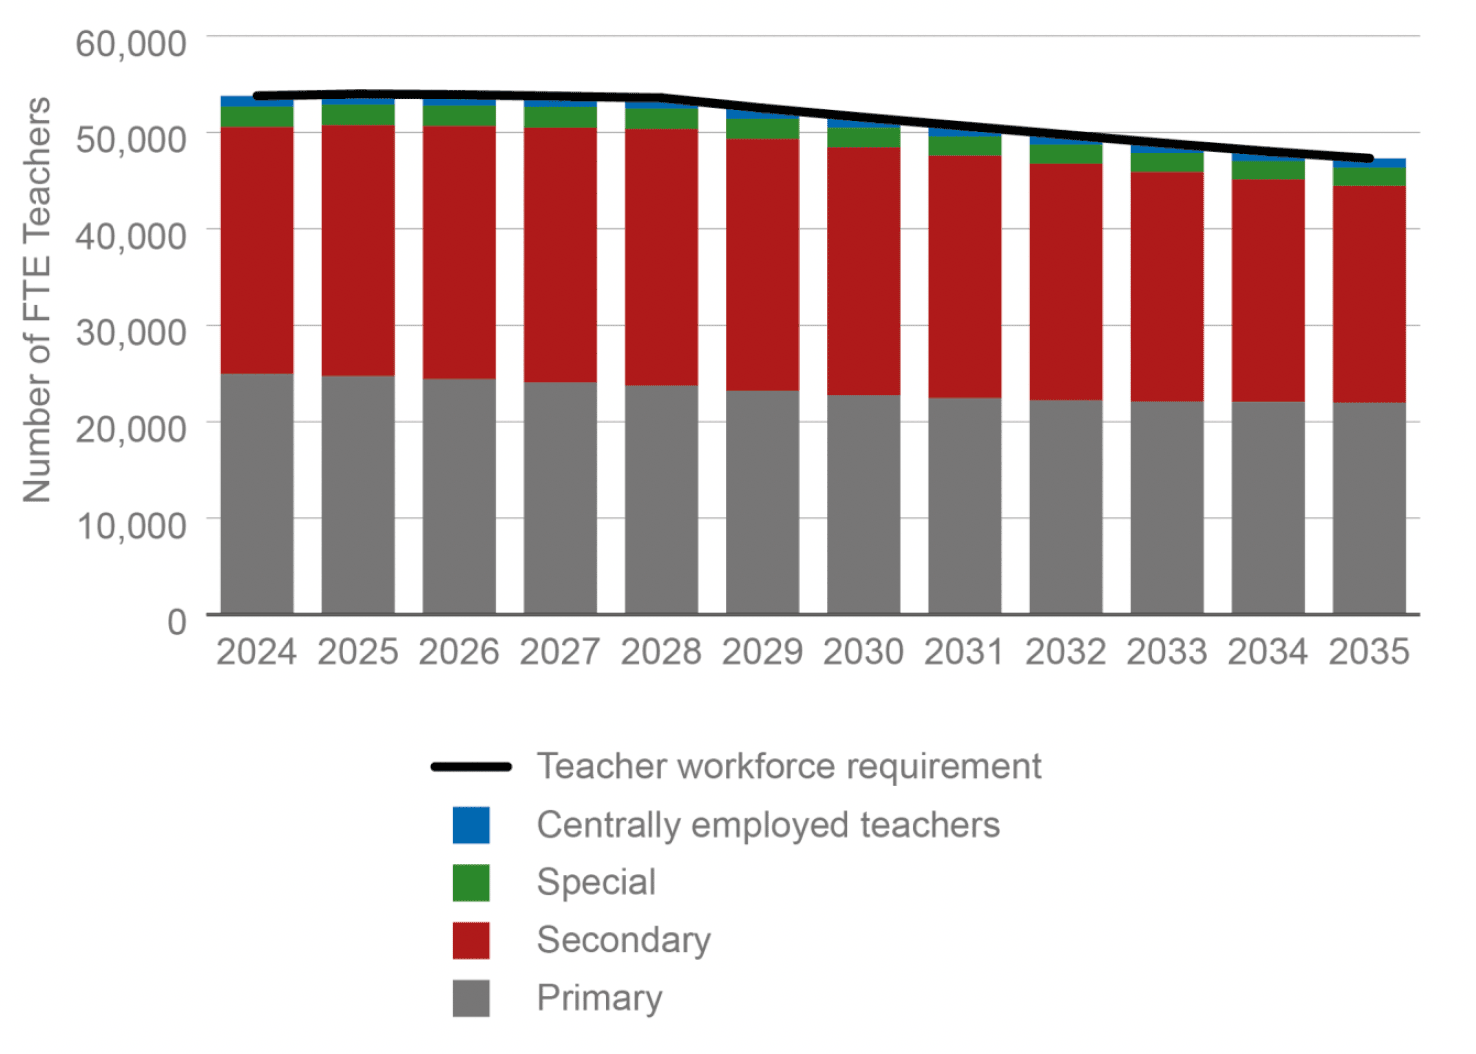
This delay in the reduction in class contact time therefore smooths the profile for the teacher stock. However, it still results in a lower PTR, which is expected to fall to 12.3 in 2028 and remain at this level until 2035.
The results of this sub-scenario are very similar to Scenario 0, but Scenario 0 focusses on maintaining a constant teacher stock over time, whereas this sub-scenario looks at what the minimum number of teachers will be needed to achieve a 1.5 hour reduction in class contact time by 2028 and beyond. Therefore, the resulting teacher demand over the next decade differs slightly between the two scenarios.
Scenario 2: Maintaining pupil-teacher ratio (PTR)
(a) Maintaining the PTR at 13.2
This scenario explores the implications of maintaining the PTR at its current level of 13.2. It is useful to assess the implications of a stable PTR in the future, on the minimum teacher need, in light of expected demographic changes in the pupil population. With a constant pupil number relative to the number of teachers, the class contact time will be consistent throughout the projection period. However, with pupil numbers projected to fall, a constant PTR means a proportionate reduction in the number of teachers needed.
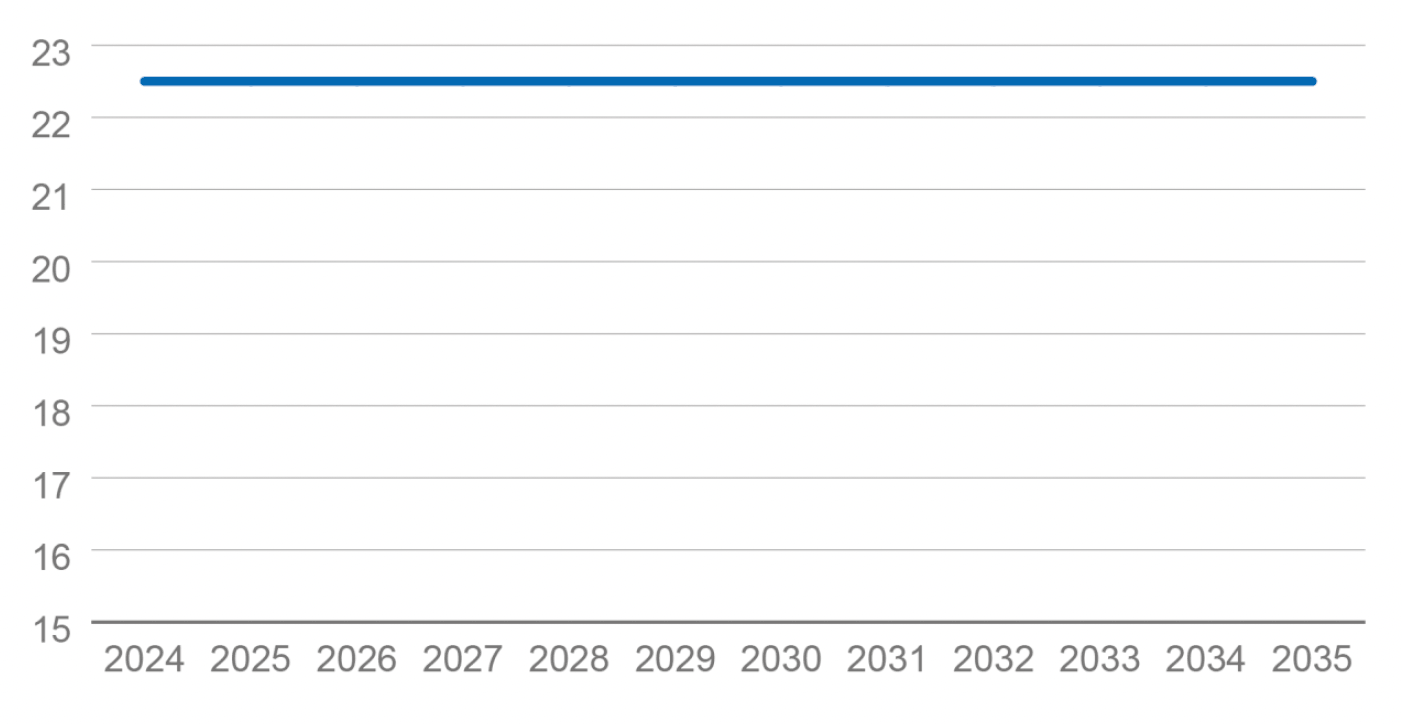
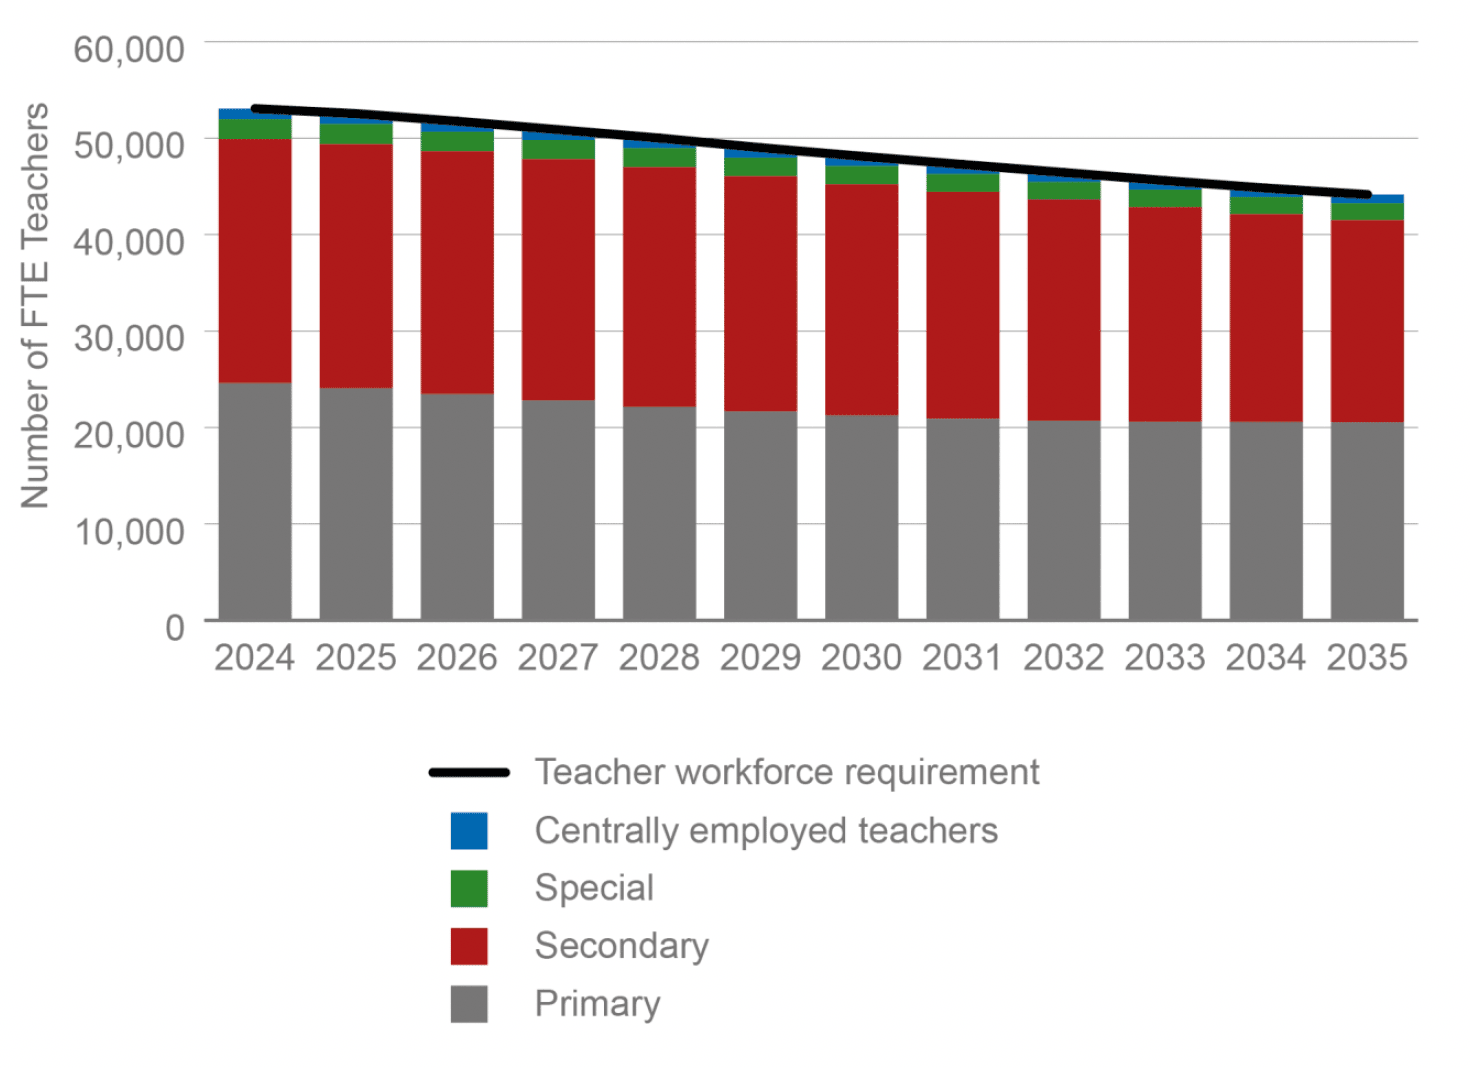
In this scenario, the teacher need will peak at 53,459 (excluding ELC teachers) in 2022 and is set to decline throughout the projection period to 44,100 in 2035. Meanwhile, holding the PTR constant will not change the class contact time in our model. In other words, all else equal, the commitment to reduce teachers’ class contact time will be unachievable if the PTR is maintained at 13.2. Therefore, it would necessitate examining alternative or additional approaches to achieve the commitment of reducing teachers’ class contact time.
(b) Maintaining the PTR at 13.2, with a higher share of teachers in standard classes
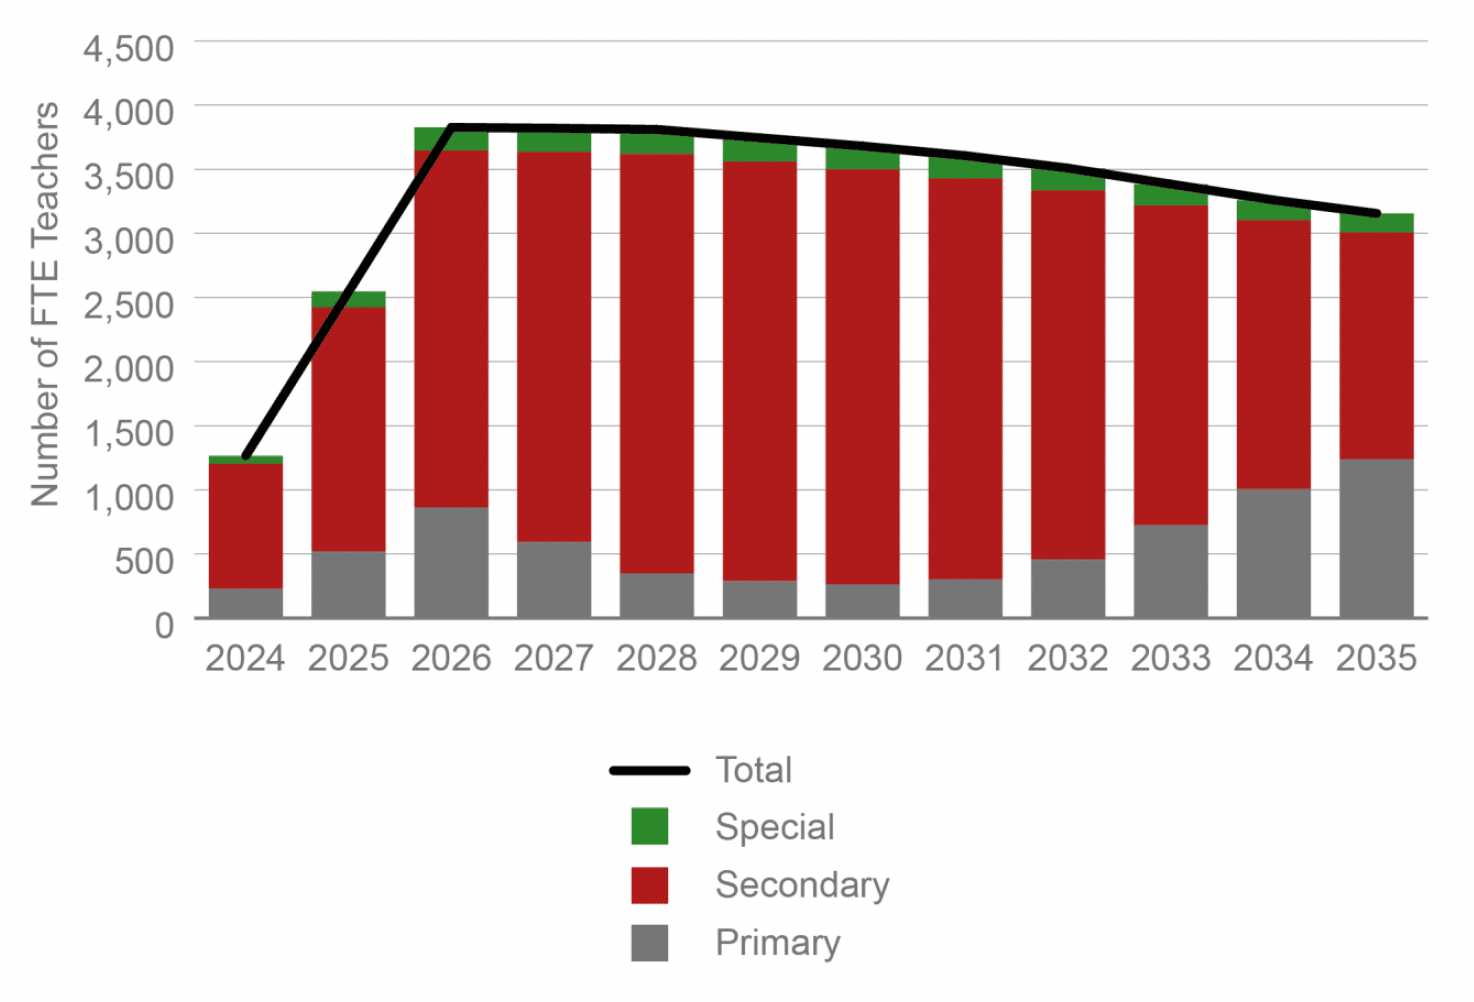
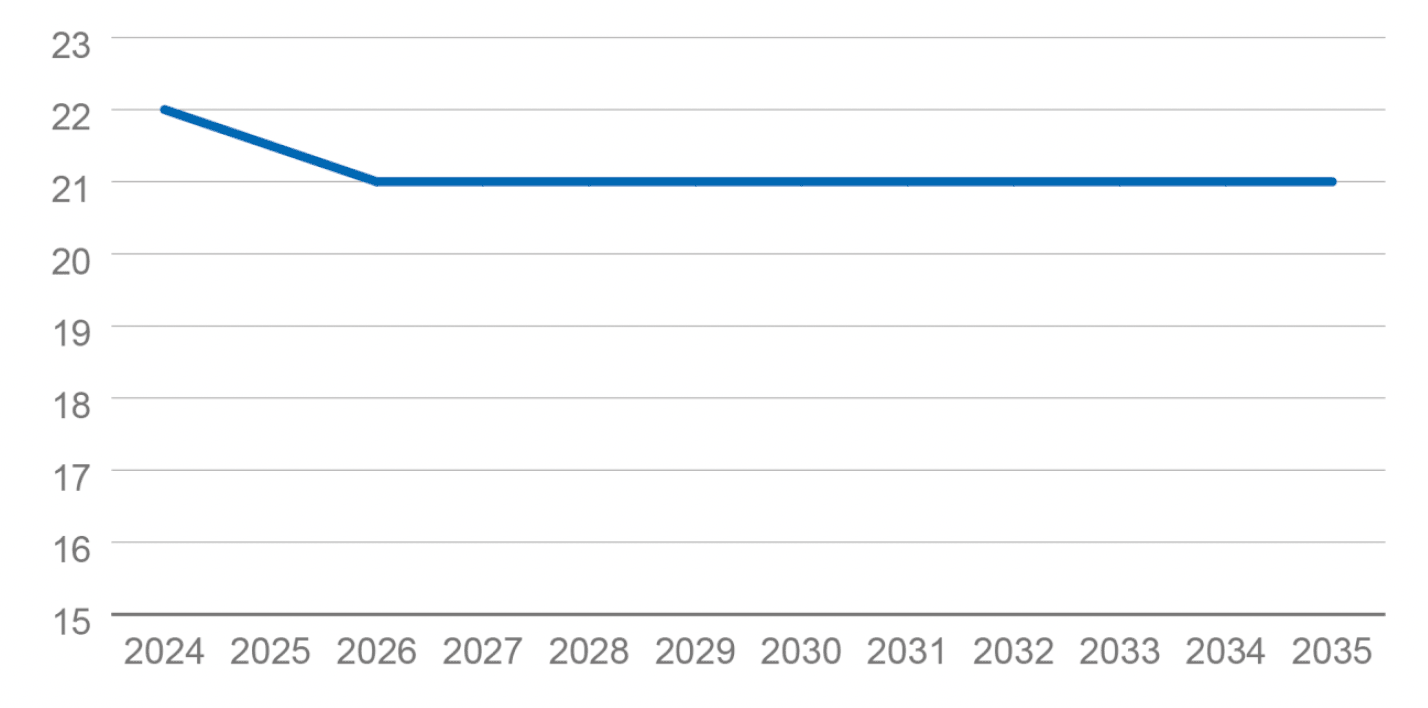
One possibility for maintaining the current PTR while also meeting the commitment of reducing teachers’ class contact time by 1.5 hours is to explore the scope for teachers who are currently being used for targeted interventions – such as those doing SAC, PEF or COVID recovery work – to change roles to be deployed in standard classes. Alternatively, there may be opportunities through a reorganisation of teacher deployment (e.g. headteachers spending more time on regular classroom teaching). Such changes would put downward pressure on overall class contact time even if the PTR is held constant.
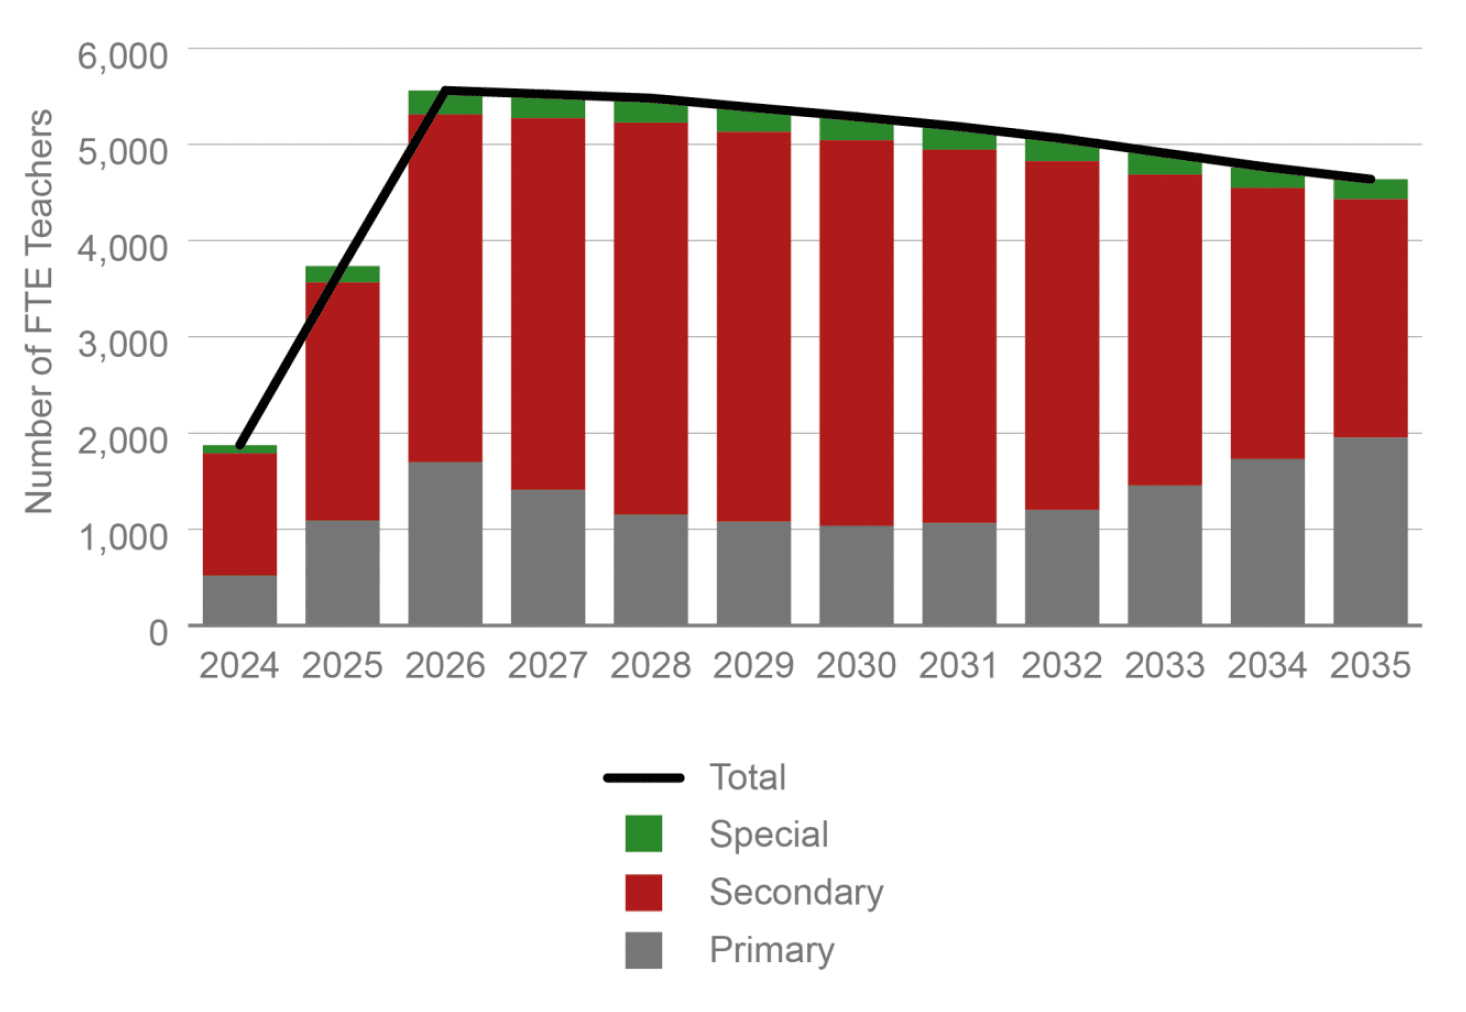
To illustrate the number of teachers being used for targeted interventions required to change roles, we mimic Scenario 2(a) (i.e. the teacher stock required in Graph 5.8 as a result of a constant PTR of 13.2) and estimate the number of teachers within that stock who would need to change roles to reduce class contact time by 1.5 hours by 2026. The number of teachers currently being used for targeted intervention needing to be deployed in standard classes is expected to peak at 3,730 in 2026 before gradually decreasing over time to around 3,100 by 2035. We have not explored whether there is the potential within the teacher stock for such numbers to have their roles changed in this way – and therefore do not provide comment on how viable such changes might be.
Scenario 3: The PTR increases from its current level to its recent high
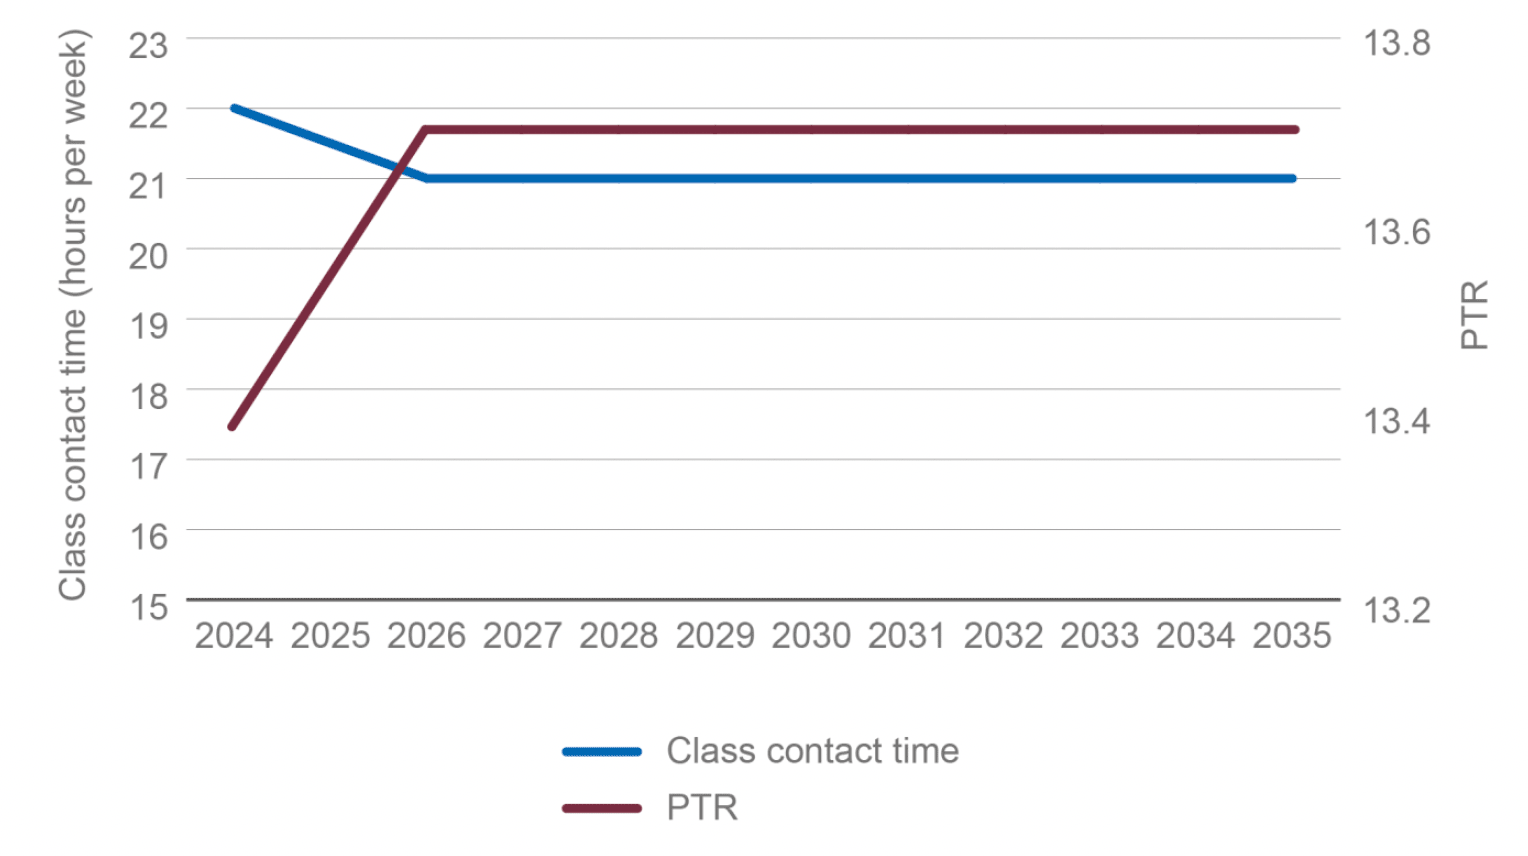
This section explores scenarios in which the PTR is allowed to increase. As an illustration, we explore the implications of Scotland’s PTR returning to 13.7, the level it was at in 2015-2016. We have modelled what will happen if this is to be achieved by 2026. In addition, we have explored a sub-scenario to estimate the number of teachers currently being used for targeted interventions (rather than in standard classes) that would be required to change roles to reduce class contact time by 1.5 hours.
(a) Raising PTR to 13.7 by 2026
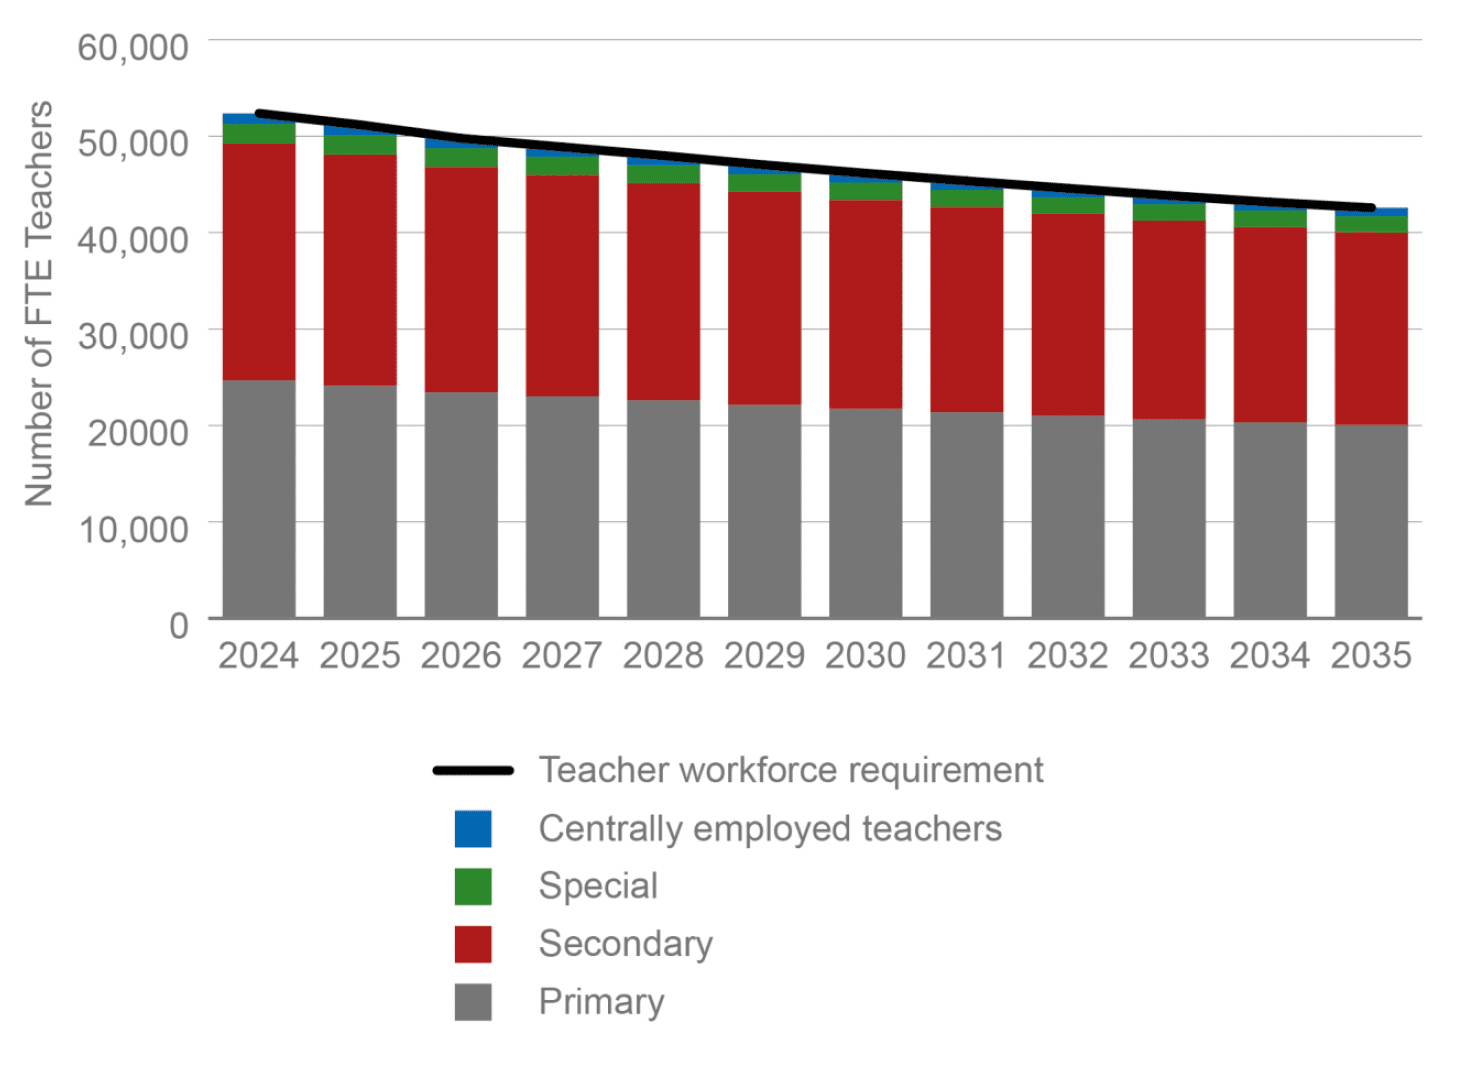
Allowing the PTR to increase from 13.2 to 13.7 by 2026 would effectively reduce the teacher resourcing need. Teacher demand falls by 7.1%, or 3,800 over 2022-2026 and continues to fall throughout the projection period to 42,500 in 2035 (assuming class sizes remain constant). As the number of secondary school pupils is expected to continue to rise until 2025, the inflow of teachers needed will come mainly from this school type.
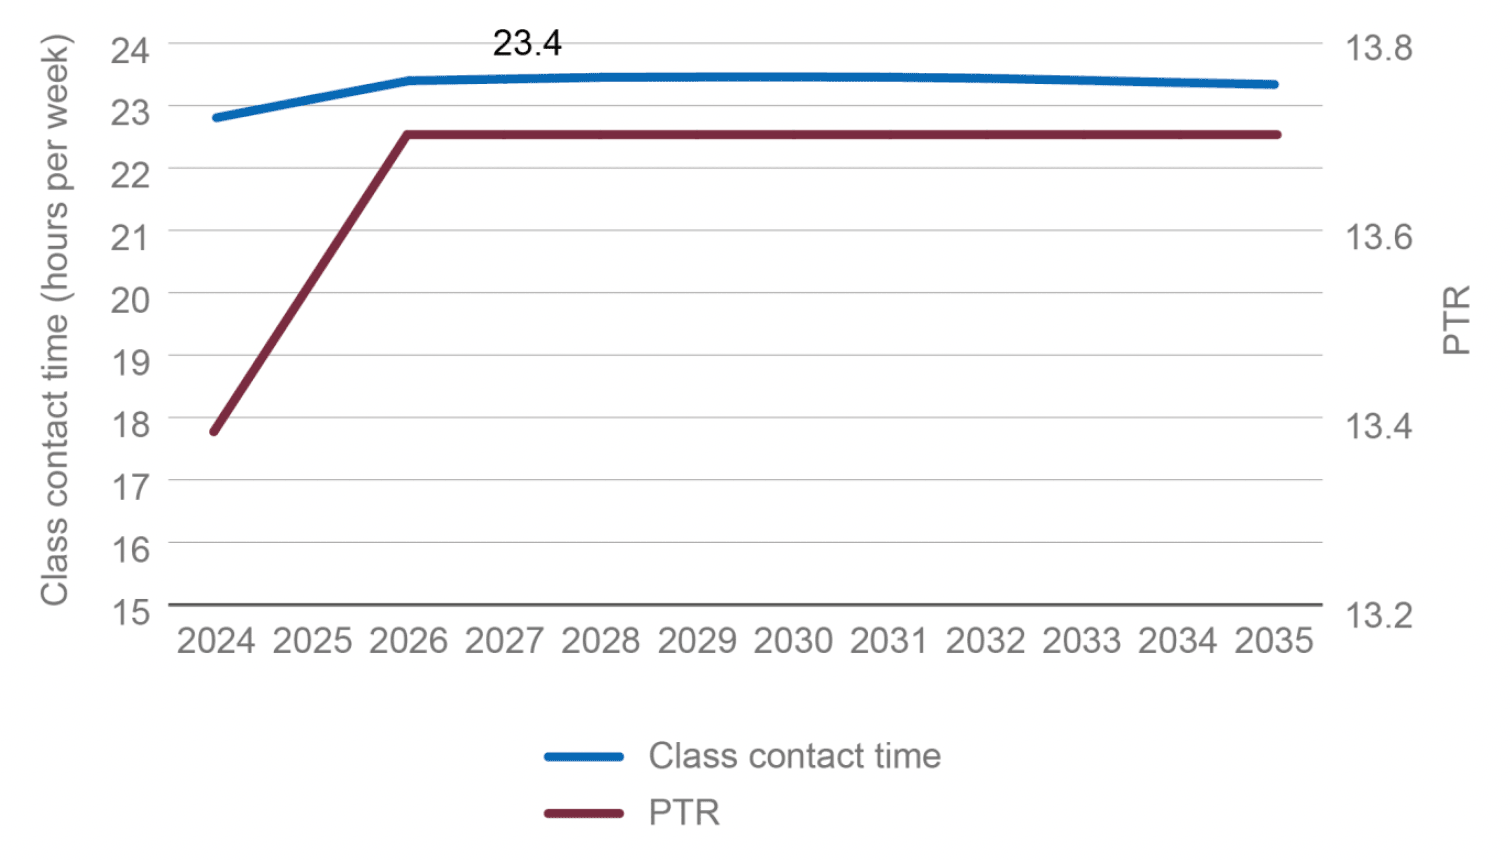
However, in our modelling, class contact time increases as the decline in the number of teachers is now relatively greater than the decline in the number of pupils. Projected class contact time increases to 23.4 hours per week by 2026 before holding steady at this level as a result of the PTR also levelling off.
This runs counter to the policy objective of enabling a reduction in class contact time. We therefore consider an alternative scenario below.
(b) Raising PTR to 13.7 by 2026, with a higher share of teachers in standard classes
In this modelling scenario, enabling a reduction in teaching time of 1.5 hours while allowing the PTR to rise from 13.2 to 13.7 by 2026 will mean that, at the peak, over 5,600 such teachers will have to change roles. We have not explored whether there is potential within the teacher stock for such numbers to change roles, and therefore do not provide comment on how viable such changes might be.
Scenario 4: Increase the number of teachers by 3,500 by 2026, in line with the Scottish Government commitment
This scenario assesses the impacts of delivering the commitment set out in the 2021 Programme for Government of increasing the number of teachers by 3,500 by 2026 in the context of declining pupil populations over the next decade.
We assume that the number of teachers grows in line with the Scottish Government’s 2021 commitment (essentially an additional 3,500 teachers added to the teacher stock by 2026, which we assume to occur in a smoothed/linear manner) and thereafter assume a constant number of teachers until 2035, and see how this impacts PTRs and class contact time.
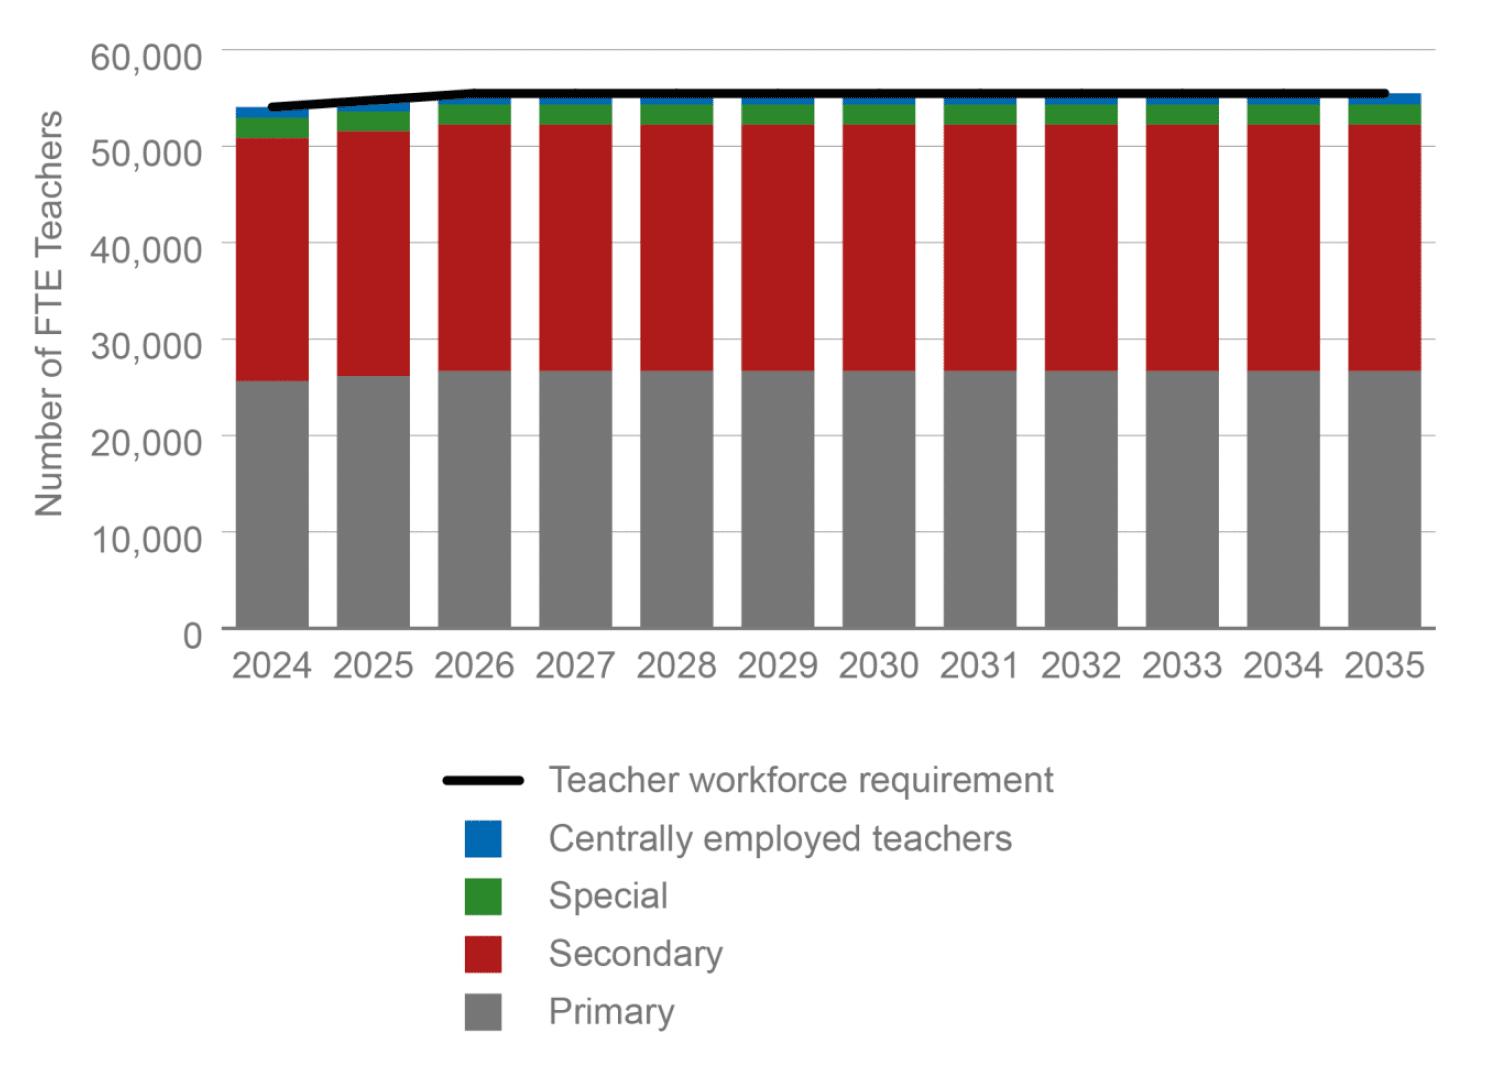
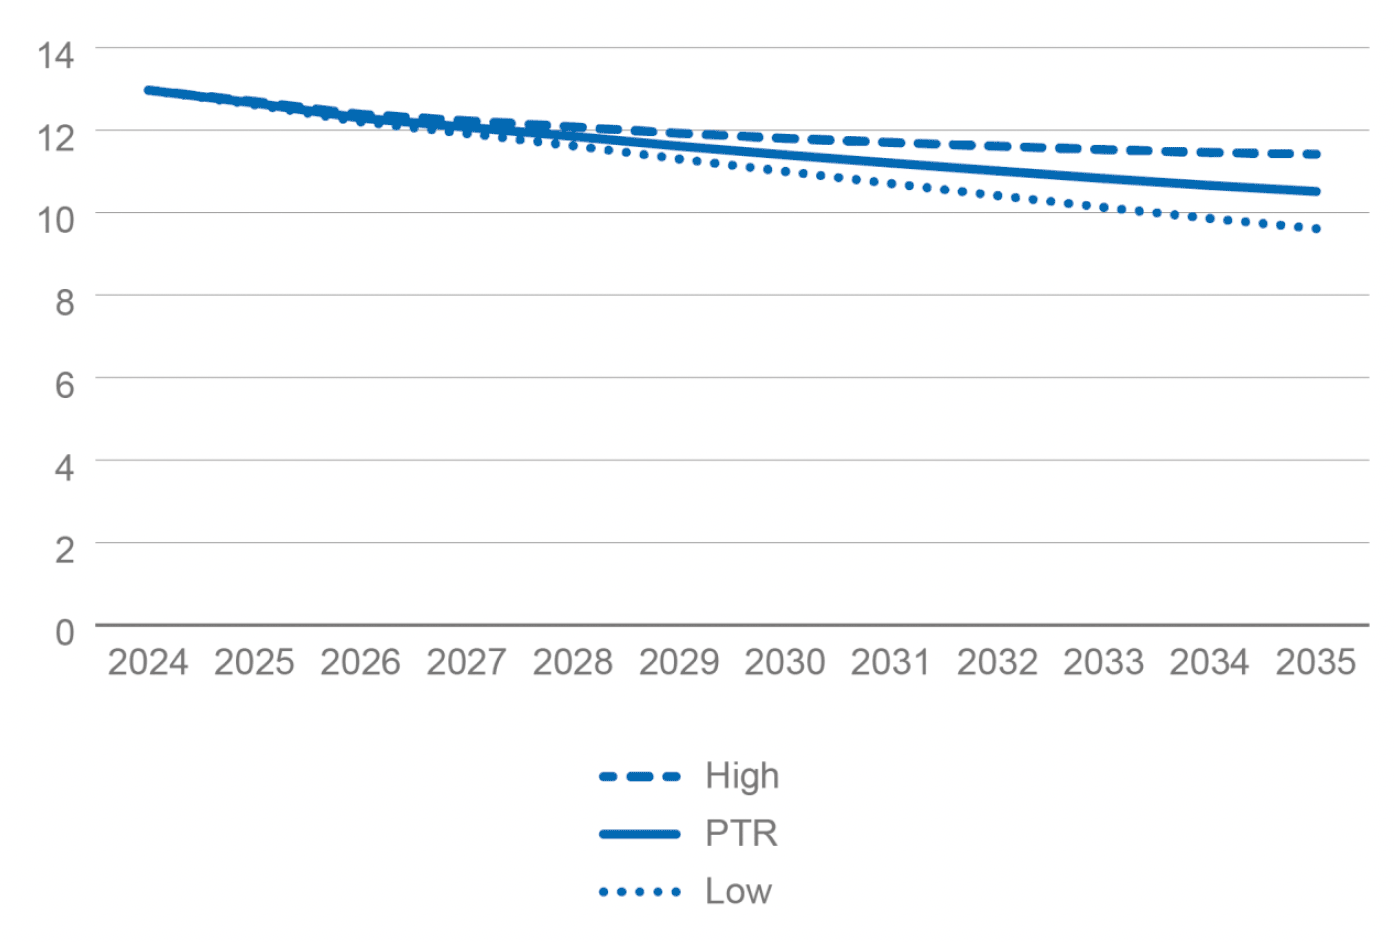
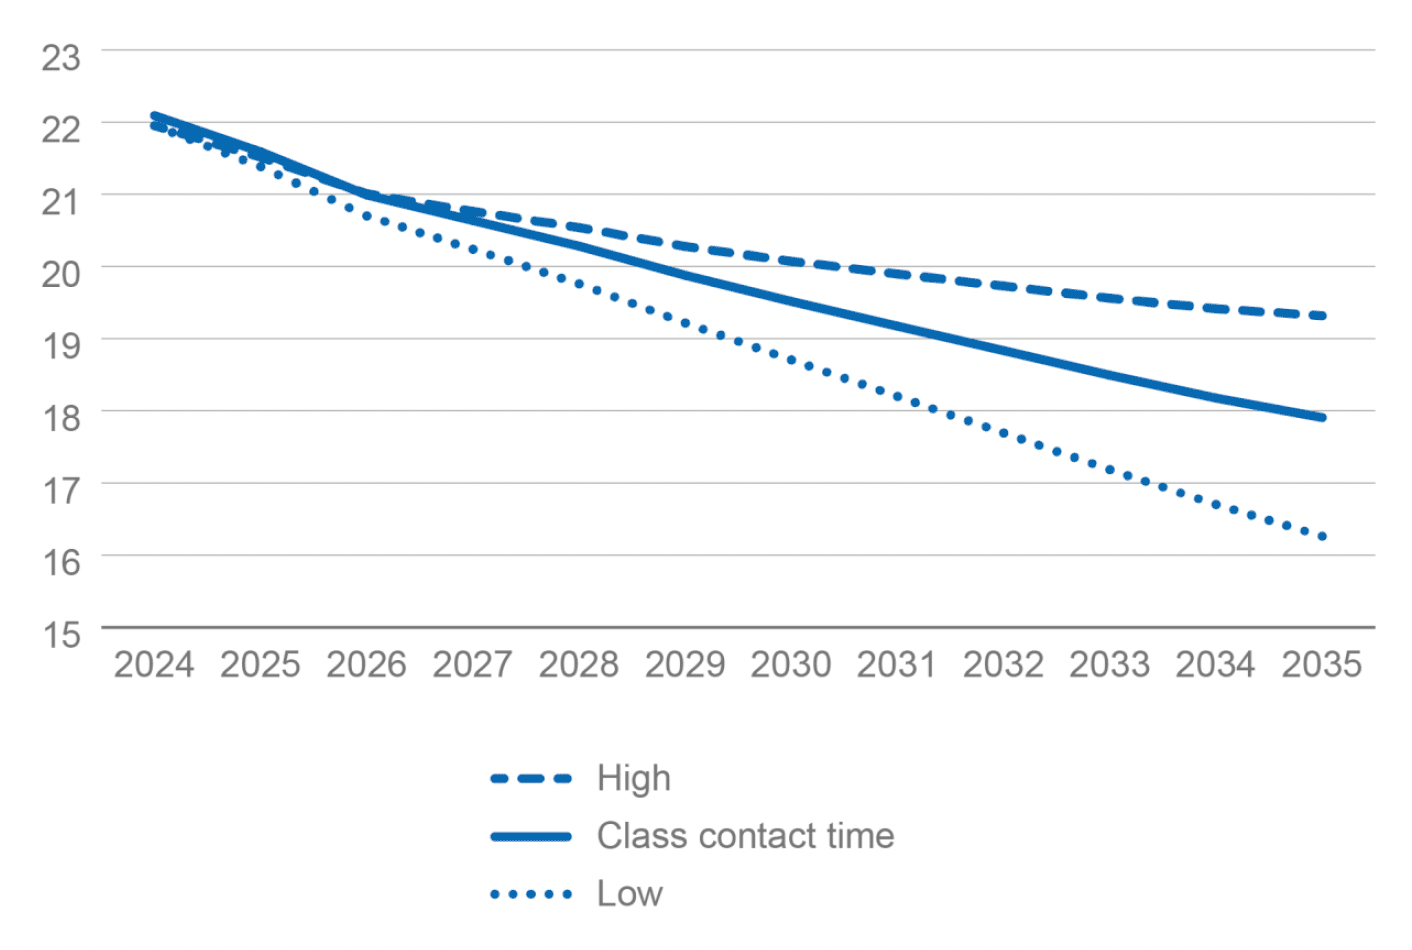
With the increase in the teacher stock, the PTR falls sharply to 12.4 in 2025. Although the teacher stock is then held constant, the PTR continues to fall to a range of 9.5 to 11.2 by 2035 as the expected number of pupils in Scotland declines. Class contact time is expected to be enabled to fall to below 21 hours per week by 2026 in the baseline, high and low scenarios before continuing to fall substantially over the remainder of the projection period. This larger teacher stock runs counter to the demographic trends in pupil numbers and could therefore raise questions around implications for public sector budgets, long-term fiscal sustainability, and whether this delivers maximum value for money.
Contact
Email: zak.tuck@gov.scot
There is a problem
Thanks for your feedback