Reconviction Rates in Scotland: 2020-21 Offender Cohort
Statistics on reconvictions are presented up to the latest cohort of 2020-21. The latest year’s data is impacted by the COVID-19 pandemic and should not be interpreted to be indicative of longer term trends.
5. Main Findings: reconviction rates for court disposals
5.1 Headline figures
(Table 1 and Table 21)
The trends presented in this publication are affected by the COVID-19 pandemic. The number of offenders in the 2019-20 cohort remains unaffected as they were either released from custody or given a non-court disposal by the end of March 2020. However, the impact of the COVID-19 pandemic on the justice system will have affected the number of offenders in this cohort being reconvicted throughout 2020-21. These two observations give an indication of changes in reconviction rates and average number of reconvictions per offender for this cohort.
The reconviction rate, which is the percentage of offenders who are reconvicted in a year, was 26.9% in 2020-21. This is a 2.6 percentage point increase from 24.3% in 2019-20. The average number of reconvictions per offender, a measure of how often offenders are reconvicted, increased by 8% in the same period from 0.41 to 0.44. From the people who have offended in 2021-22, 34% did so for the first time in at least 10 years, up from 31% from the previous year. See Chart 1, Table 1 and Table 21.
Over the longer term, the reconviction rate and average number of reconvictions per offender (Table 1 and Chart 1) have generally decreased over the past decade. However, the decrease seen this year is larger, most likely due to the impacts of the COVID-19 pandemic. Between 2011-12 and 2020-21, the reconviction rate has fallen by 2.8 percentage points from 29.6% to 26.9%, and the average number of reconvictions per offender has decreased by 20% from 0.55 to 0.44. More widely, other measures of crime also show decreases over the same time period, and this is also observed in Recorded Crime in Scotland, 2020-21 and the Scottish Crime and Justice Survey. However, the proportion of people who have offended for the first time in at least 10 years has remained fairly consistent, varying between 31% and 36% between 2002-03 to 2011-12, and 2012-13 to 2021-22 (Table 21).
The size of the cohort has decreased in the past four years, after increasing in the three years before that. The cohort size has significantly reduced in the past year due to the effects of the COVID-19 pandemic from 32,070 to 21,100 in 2020-21. Over the long term, cohort size has been shrinking and this is 61% lower than the largest cohort of 53,460 in 1997-98. The shrinking cohort reflects the decreases in the number of people convicted seen in the Criminal Proceedings Statistics since 2015-16. The slight lag in the reconviction cohort compared to the number of people convicted, is likely to be because those given custodial sentences are counted at sentence date in the Criminal Proceedings Statistics, whereas they are counted later in a reconvictions cohort at the estimated time when they are released. The COVID-19 pandemic is expected to have had a significant effect on the size of the 2020-21 cohort, as it covers the first whole year from major restrictions effective March 2020.
5.2 Crime type
(Table 6 and Table 20)
The publication uses two different definitions of crime type. The first, when analysing the 2020-21 cohort, is the “index crime”. An “index crime” is the crime which resulted in the “index conviction”, the reference conviction which reconvictions are counted from. If a person was convicted for more than one charge in a set of proceedings, then the crime that was given the most serious disposal is counted as the index crime (see Annex A4). See Annex Table A1 and Annex A5 for definitions.
The second is the most “recent crime”. This is used when looking at the crime of those who have offended in 2021-22, and analysing their previous, if any, convictions.
In general, offenders who were convicted for lower-level index crimes which tend to be committed in higher volumes, are more likely to be reconvicted than those who commit more serious crimes. Note that different disposals are given for different crimes, which may also affect the likelihood of reoffending.
Secondly, the case processing times vary by which court a case ends up in. This means that the severity of the case, and therefore the crime type, will have an impact on reconviction rates, with different crimes affected disproportionately due to the effects the pandemic had on the justice system. As a result, this bulletin treats each crime type individually, and advises caution when comparing rates of different crime type.
Note that a new crime and offence grouping structure has been used for the first time. This new classification includes greater disaggregation of both Non-sexual crimes of violence and Sexual crimes, so numbers are not comparable to previous publications (but previous years are comparable within the tables provided for this year).
5.2.1 Non-sexual crimes of violence
The reconviction rate where non-sexual crimes of violence is an index crime has increased in the last year from 18.9% to 22.4% in 2020-21, with this rate along with average number of reconvictions (0.33) returning to similar rates of the last decade.
Of all those who have offended in 2021-22, 27.3% have had 1 or 2 previous convictions for non-sexual crimes of violence, and 8.3% have had 3 to 10. 85.1% of people who have had a previous conviction for this crime type in the last 10 years were men.
Of those who have offended in 2021-22 where the non-sexual crimes of violence is the most recent crime, 27.0% have had 1 or 2 previous convictions for non-sexual crimes of violence, 9.4% have had 3 to 10, and 0.1% have had over 10. 58.6% have had a previous conviction of any type in the past 10 years, with 24.2% having between 3 and 10 and 9.8% having over 10.
5.2.2 Sexual offences
The reconviction rate where sexual offences is an index crime has decreased in the last year from 10.7% to 8.8% in 2020-21, and this rate along with average number of reconvictions (0.11) are at some of their lowest levels in 24 years.
Of all those who have offended in 2021-22, 2.6% have had 1 or 2 previous convictions for sexual offence, and 0.1% have had 3 to 10. 96.0% of people who have had a previous conviction for this crime type in the last 10 years were men.
Of those who have offended in 2021-22 where sexual offence is the most recent crime, 8.7% have had 1 or 2 previous convictions for sexual offence, and 0.7% have had 3 to 10. 33.9% have had a previous conviction of any type in the past 10 years, with 9.4% having between 3 and 10 and 2.7% having over 10.
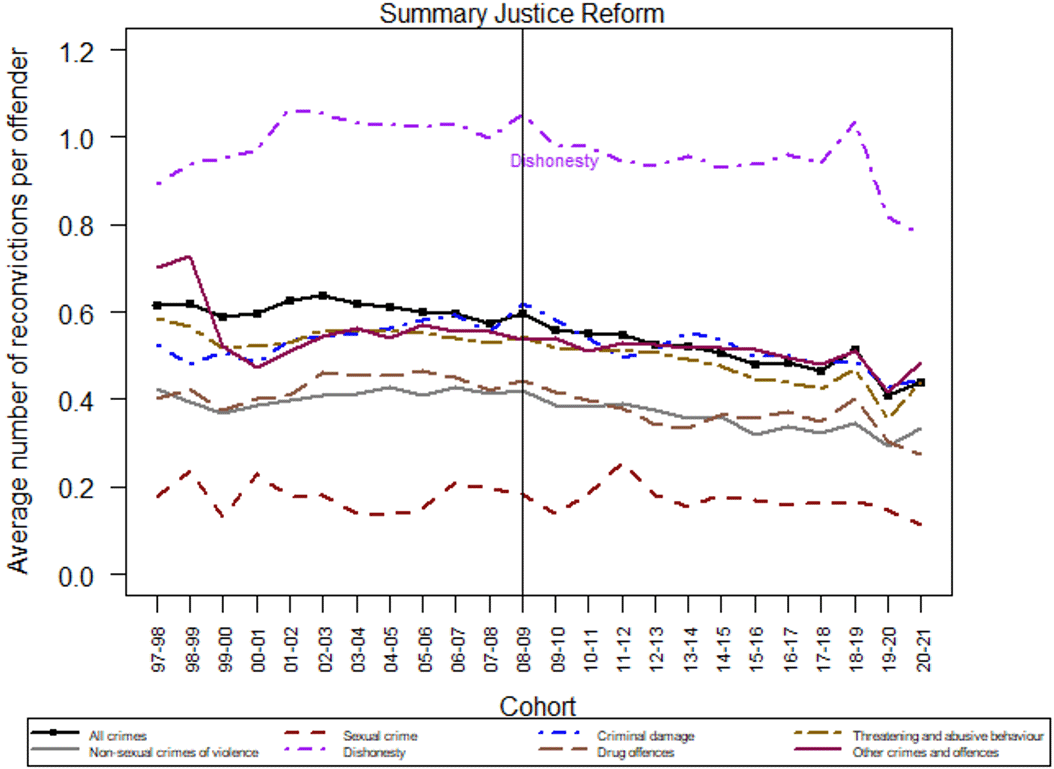
5.2.3 Dishonesty
The reconviction rate where dishonesty is an index crime has slightly increased in the last year from 40.5% to 40.7% in 2020-21. This is the highest rate out of all the crime type classifications. The average number of reconvictions (0.78) are at some of their lowest levels in 24 years.
Repeat offending under dishonesty is relatively high. Of all those who have offended in 2021-22, 12.2% have had 1 or 2 previous convictions for dishonesty, 8.1% have had 3 to 10, and notably 3.1% have had over 10.
Of those who have offended in 2021-22 where dishonesty is the most recent crime, 18.1% have had 1 or 2 previous convictions for dishonesty, 27.1% have had 3 to 10, and 16.2% have had over 10. 78.4% have had a previous conviction of any type in the past 10 years, with 30.3% having between 3 and 10 and 33.5% having over 10.
5.2.4 Drug offences
The reconviction rate where drug offence is an index crime has decreased in the last year from 20.9% to 19.2% in 2020-21, and this rate along with average number of reconvictions (0.28) are at their lowest levels in 24 years.
Of all those who have offended in 2021-22, 15.0% have had 1 or 2 previous convictions for drug offence and 3.0% have had 3 to 10.
Of those who have offended in 2021-22 where drug offence is the most recent crime, 26.2% have had 1 or 2 previous convictions for drug offence and 8.6% have had 3 to 10. 63.4% have had a previous conviction of any type in the past 10 years, with 29.5% having between 3 and 10 and 7.7% having over 10.
5.2.5 Damages and reckless behaviour
The reconviction rate where damages and reckless behaviour is an index crime has increased in the last year from 27.1% to 30.9% in 2020-21.
Of all those who have offended in 2021-22, 11.0% have had 1 or 2 previous convictions for damages and reckless behaviour and 0.7% have had 3 to 10.
Of those who have offended in 2021-22 where damages and reckless behaviour is the most recent crime, 13.7% have had 1 or 2 previous convictions for damages and reckless behaviour and 1.6% have had 3 to 10. 64.0% have had a previous conviction of any type in the past 10 years, with 26.8% having between 3 and 10 and 11.3% having over 10.
5.2.6 Threatening and abusive behaviour
The reconviction rate where threatening and abusive behaviour is an index crime has increased in the last year from 22.5% to 27.3% in 2020-21, but this rate along with average number of reconvictions (0.44) are at some of their lowest levels in 24 years.
Of all those who have offended in 2021-22, 26.1% have had 1 or 2 previous convictions for threatening and abusive behaviour and 10.9% have had 3 to 10.
Of those who have offended in 2021-22 where threatening and abusive behaviour is the most recent crime, 28.6% have had 1 or 2 previous convictions for threatening and abusive behaviour and 12.9% have had 3 to 10. 65.4% have had a previous conviction of any type in the past 10 years, with 27.9% having between 3 and 10 and 10.4% having over 10.
5.3 Age and sex
(Table 2, Table 3, Table 4, Table 5 and Table 20)
5.3.1 Sex
Sex in this bulletin is generally based on how a person presents, unless an alternative gender is disclosed. Sex may be different to that recorded at birth, for example where a Gender Recognition Certificate is provided. In a small number of records sex will be recorded as unknown if a clear understanding of the sex of the individual is not known. See Annex A11 and A12 for further details.
Both measures of reconvictions are higher for males than females, as in previous years. Males make up the vast majority of offenders in each cohort, with males making up 84% of the cohort in 2020-21. Continuing a persistent long-term trend, males have higher reconviction rates and a higher average number of reconvictions per offender than females (Table 2). In 2020-21, the reconviction rate was 27.5% for males and 23.5% for females, and average number of reconvictions per offender was 0.45 for males, and 0.39 for females.
Males convicted in 2021-22 are also more likely to have had a previous conviction in the past 10 years, with 66.9% compared to 59.3% for females. The gap narrows when comparing persistent offenders, with 13.4% of males who were convicted in 2021-22 having over 10 previous convictions in the past 10 years, compared to 11.1% for females.
Both measures of reconvictions slightly increased for both sexes increased over the past year. For males, the reconviction rate increased by 2.6 percentage points from 24.9% in 2019-20 to 27.5% in 2020-21, and the average number of reconvictions increased from to 0.41 to 0.45 in the same period. For females, the reconviction rate increased 2.2 percentage points from 21.3% in 2019-20 to 23.5% in 2020-21 and the average number of reconvictions increased from 0.37 to 0.39 in the past year.
Over the longer-term, reconvictions for males have gradually decreased, but are similar for females. In the past decade, the average number of reconvictions fell by 21% for males from 0.56 in 2011-12 to 0.45 in 2020-21, and the reconviction rate fell by 3.3 percentage points from 30.8% to 27.5% in the same period. For females, the average number of reconvictions was 0.46 in 2011-12, and has fluctuated over the past decade. However, the large decrease in 2019-20 and then remaining similar in 2020-21 to 0.39 must be contextualised by the COVID-19 pandemic. The reconviction rate for females was 24.1% in 2011-12 and was lower in 2020-21 at 23.5%.
5.3.2 Age
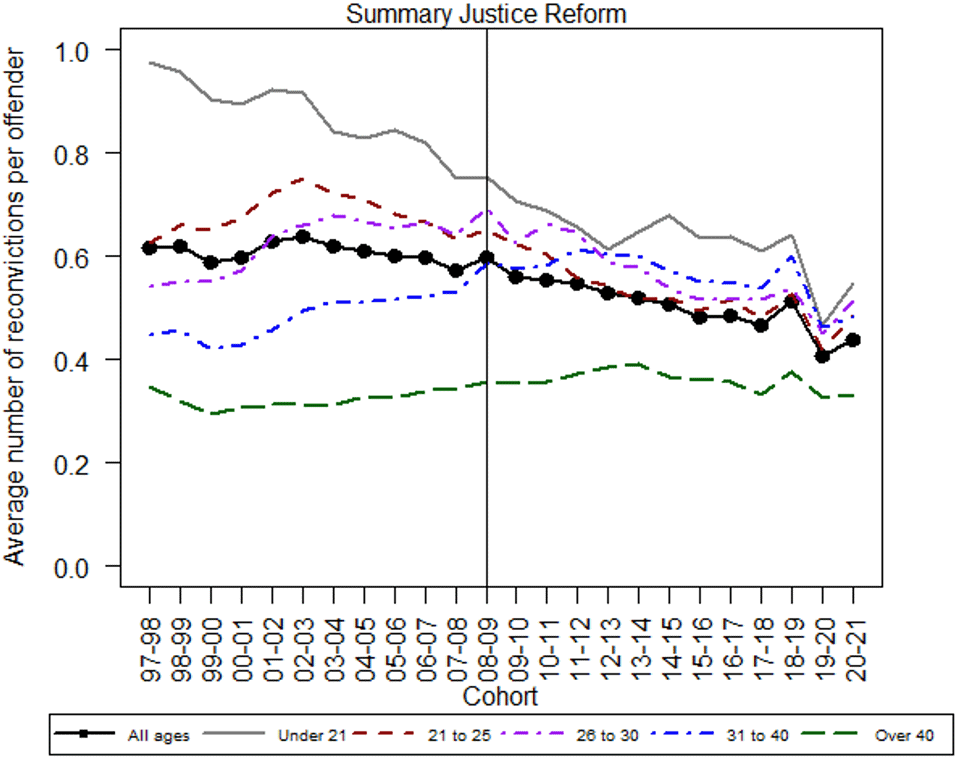
All age groups showed an increase in reconviction rates between 2019-20 and 2020-21. The 21 to 25 group saw the largest increase of 5.3 percentage points from 25.3% to 30.6%, the over 40 year old group saw the smallest increase from 18.8% to 20.0% (Table 3).
The reconviction rates for most age groups are similar to each other, apart from the lower rates of the over 40s. The reconviction rates for the age groups under 40 range from 29.0% to 31.0%, and the average number of reconvictions for these groups range from 0.48 to 0.53. Both measures were the lowest for the over 40s (20.0% and 0.32, respectively), as they have been historically (Table 3).
Reconvictions for Under 21s have decreased substantially over the past 24 years. Over time, the average number of reconvictions for under 21s have decreased by approximately half (43%) in 24 years, from a high of 0.93 in 1997-98 to the latest figure of 0.53 in 2020-21. However, between 2011-12 and 2018-19, numbers have been fluctuating (ranging between 0.59 and 0.65) (Table 3).
It should also be noted that the under 21 cohort size decreased substantially in the past 24 years by 88% from 13,796 in 1997-98 to 1,672 in 2020-21. It has decreased by 77% in the past decade alone from 7,430 in 2011-12. The fall is in part due to dealing with youth offending outside of court and early interventions. In terms of its effect on the national cohort size, in 1997-98 the under 21 cohort represented 26% of the national cohort, compared to 8% in the most recent cohort. This large change in the under 21 cohort size, coupled with the decrease in reconvictions for this group, means that changes in this group are a significant component of the reduction in the overall national reconviction rate.
5.3.3 Age and sex
Patterns of change in reconvictions (both rates and average numbers) for males of different age groups are generally similar over time (Table 4) to those for all offenders (Table 3), as males comprise the majority of offenders in the cohort (84% in 2020-21) (Chart 4).
All male age groups showed an increase in both measures of reconvictions between 2019-20 and 2020-21, apart from those aged between 31 and 40. The increases in reconviction rates ranged from 5.3 percentage points in the 21 to 25 group to 1.0 percentage points in the over 40s age group. Similarly, the average number of reconvictions for these groups slightly increased, with the biggest increase being 0.08 for the under 21s age group. Small decreases in both measures were observed in the 31 to 40 age group. (Table 4 and Chart 4).
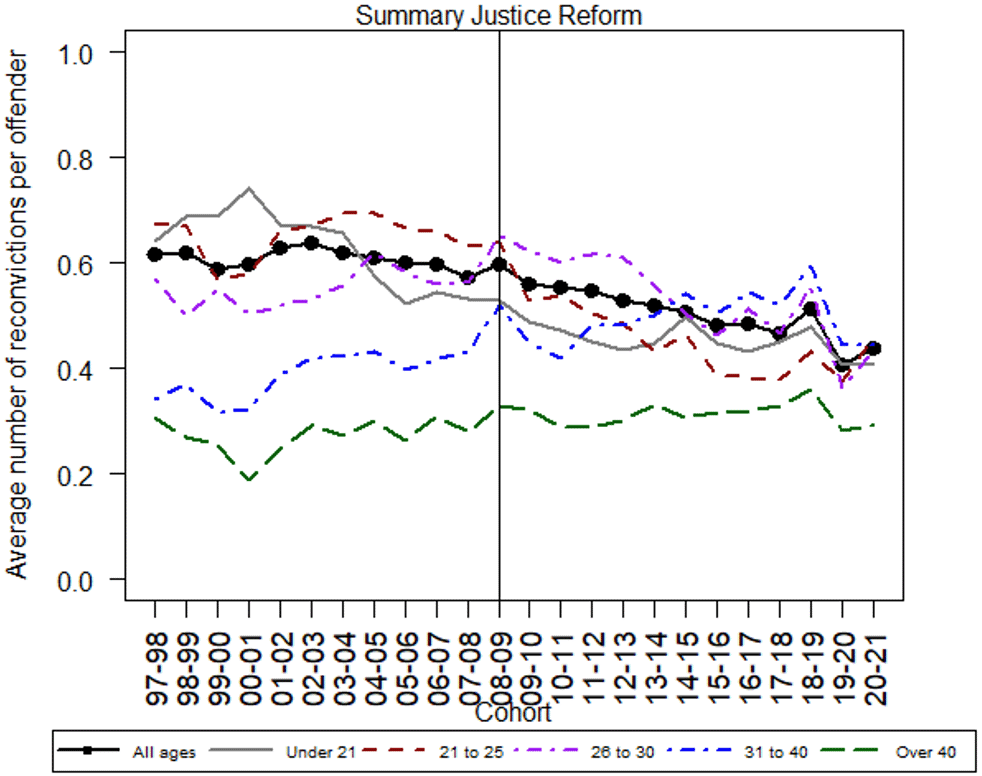
Historically, the average number of reconvictions used to decrease with age, but in recent years the pattern has changed as the gap has narrowed between the age groups with all bar the over 40s having similar average numbers. In 2020-21, under 21s had the highest average number of reconvictions of the male age groups (0.55), followed by those aged 26 to 30 (0.51) and those aged 21 to 25 (0.48); with the over 40s having the lowest (0.33) (Table 4 and Chart 4).
Most female age groups showed an increase in both measures of reconvictions in the past year. Apart from reconviction rates for under 21s (decrease of 0.3 percentage points), reconviction rates and average number of reconvictions for all female age groups increased. The greatest increase comes from the 21 to 25 age group, increasing by 5.2 percentage points.
The average number of reconvictions increased for all female age groups in the past year, with the largest increase in the 21 to 45 age group from 0.37 to 0.46 (Table 5).
The pattern of reconvictions across female age groups is slightly different to males. In 2020-21, the average number of reconvictions between all age groups was consistent around 0.41 to 0.46, apart from the over 40s, which remained lower at 0.29 (Chart 5). One notable difference to males regarding the average number of reconvictions is for the under 21 age group, which has always been the highest of the male age groups (Table 4 and Chart 4), but this hasn’t been the case for the under 21 female age group since 2002-03 (Table 5 and Chart 5).
5.4 Domestic abuse index crimes and offences
(Table 8a, Table 8b, Table 8c and Table 8d)
The crimes and offences counted here as domestic abuse index convictions or reconvictions, are crimes and offences marked with the statutory domestic abuse aggravation or non-statutory domestic abuse identifier.
The statutory domestic abuse aggravation was created by the Abusive Behaviour and Sexual Harm (Scotland) Act 2016 and came into effect on the 24th April 2017 for crimes that took place on or after this date. The statutory domestic abuse aggravation is marked against individual charges and, if proven in court, will be taken into account during sentencing. For example, a common assault offence committed against a partner could be marked with the statutory aggravation. This is the second year that data have been published on this aggravation. Note that the crimes and offences are mostly referred to as “crimes” below for brevity.
Crimes and offences may be also be marked with a non-statutory domestic abuse identifier by the police or COPFS. This is used for operational purposes for prosecution, but does not require proof in court and is not taken into account during sentencing. This has been in place since before the introduction of the statutory aggravation, and as such, provides us with longer time series data. We have published this here in recognition of the value of this trend data to user and will assess whether there is a continuing demand for this data in future bulletins, but it will be published in some form.
Crimes and offences with the aggravation are a subset of those with the identifier. For example, a common assault offence committed against a partner could be marked with the statutory aggravation and the identifier, or just the identifier, but not the statutory aggravation alone.
A new standalone crime of domestic abuse was created by the Domestic Abuse (Scotland) Act 2018. This crime covers a course of behaviour which is abusive of a person’s partner or ex-partner. This crime was introduced on 1st April 2019 so this is the first publication that includes this crime as an index offence. Crimes under this legislation are not shown separately but are included within the Non Sexual Crimes of Violence crime category. See Annex B for information on data quality.
Table 8a and Table 8b show the reconviction rate and average number of reconvictions per offender, respectively, for index crimes marked with a statutory domestic abuse aggravation from when it was introduced in 2017-18, to 2020-21. Reconvictions for crimes with a statutory aggravation and reconvictions for any crime (including those with a statutory aggravation) are presented separately. Index crimes without the aggravation are also included as a comparison.
Tables 8c and 8d are similar to Tables 8a and 8b, but show reconvictions for index crimes with the domestic abuse identifier from 2009-10 to 2020-21. Some of these will also have had the statutory aggravation applied. Reconvictions are also presented separately to show those for crimes with an identifier and reconvictions for any crime (including those with the identifier).
Offenders with a domestic abuse index crime were more likely to be reconvicted for a non-domestic abuse crime than a domestic abuse crime.
In 2020-21, 17.0% of offenders with an index crime marked with the statutory domestic abuse aggravation were reconvicted for any crime, compared to 5.4% reconvicted for domestic abuse crimes (Table 8a). Note that the percentage reconvicted for any crime includes those reconvicted for domestic abuse crimes, so the percent reconvicted for non-domestic abuse crimes can be calculated by subtraction, which gives a figure of 11.6% of offenders with a domestic abuse index crime reconvicted for a non-domestic abuse crime.
Reconviction rates for index crimes marked with the identifier were similar to those marked with the statutory aggravation (Table 8c). In 2020-21, 20.5% of offenders with an index crime with a domestic abuse identifier were reconvicted for any crime and 10.4% were reconvicted for a further crime with a domestic abuse identifier.
Reconvictions for index crimes with the statutory domestic abuse aggravation decreased over the past year, but increased for the identifier.
There was a slight decrease in the percentage of offenders with an index crime with a statutory domestic abuse aggravation who were reconvicted for a further domestic abuse crime in the past year (Table 8a). This decreased from 5.5% in 2019-20 to 5.4% in 2020-21. The average number of reconvictions for a further domestic abuse crime for an index crime with a statutory domestic abuse aggravation remained at 0.06 (Table 8b).
Table 8c shows that those with an index crime marked with a domestic abuse identifier who were reconvicted for a further domestic crime increased by 2.3 percentage points from 8.1% in 2019-20 to 10.4% in 2020-21. There was also a slight increase in the average number of reconvictions for those with an index crime marked with a domestic abuse identifier who were reconvicted for a further domestic crime, from 0.10 to 0.13, the highest over the past 10 years (Table 8d).
Additional tables showing reconvictions for domestic abuse offenders with the statutory aggravation and identifier by age, sex, crime, and disposal are published alongside this bulletin.
5.5 Disposals
(Table 9 and Table 20)
The publication uses two different definitions of disposal.
The “index disposal” is the sentence received for an index conviction (see Annex Table A1 and Annex A5 for definitions). If a person is convicted for more than one charge in a set of proceedings, then the charge that receives the most serious disposal is counted as the index disposal (see Annex A4).
The most “recent disposal” looks at the type of sentence received by those who have offended in 2021-22, and analysing their previous, if any, convictions.
A disposal may reduce the likelihood of reoffending as offenders are rehabilitated. However, different disposals are given for different types of crime and differing offending histories and, as seen elsewhere in this bulletin, these factors are also predictors of whether an offender is likely to reoffend or not. These factors should be considered when comparing the effectiveness of different types of sentences. Table 11 gives reconviction rates for different offender characteristics for the disposals.
5.5.1 Custodial sentences
Reconviction rates for Extended Sentences and Supervised Release Orders (SROs) are presented separately from other custodial sentences for interest, as these have a period of supervision after release (Table 9). The custodial sentence category only includes those that were sent to prison or young offenders institutions, plus a small number of Orders for Lifelong Restriction. Note that the SROs and Extended Sentences are included in the custodial sentence length table along with the other custodial sentences (Table 10a).
Offenders released from a custodial sentence in 2020-21 had the highest reconviction rates and average number of reconvictions of any disposal.
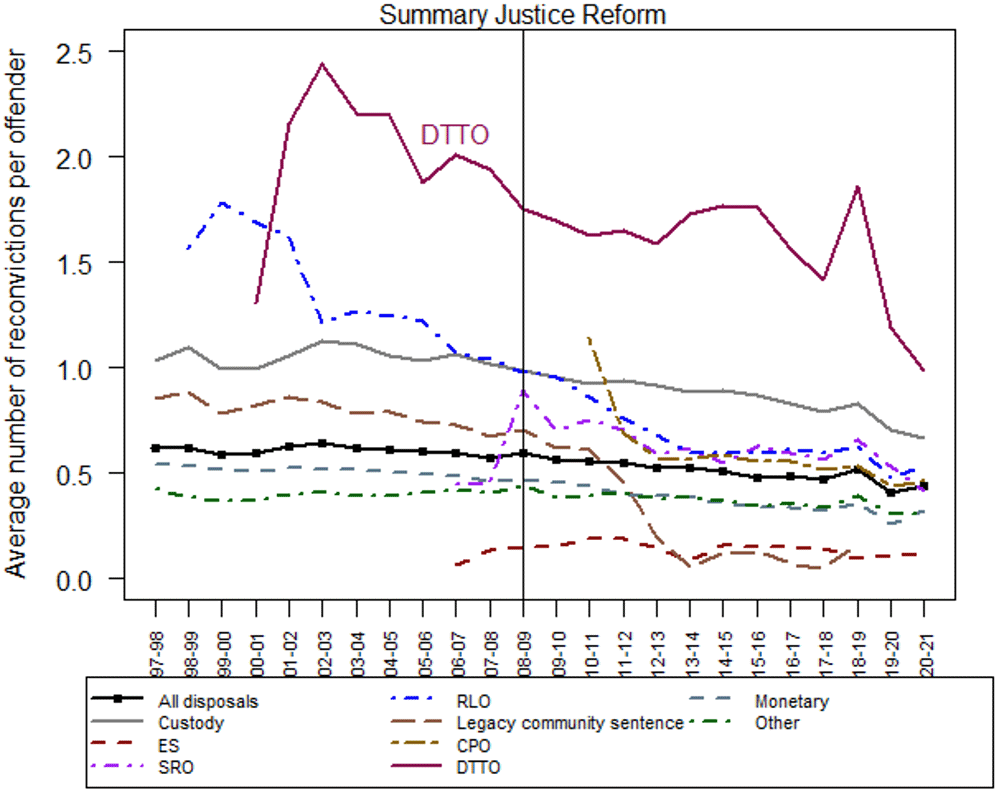
The reconviction rate for offenders released from custody in the 2020-21 cohort was 39.4%, similar to the 2019-20 rate of 39.2%. This rate is still one of the lowest in the past 24 years. The average number of reconvictions per offender decreased from 0.70 to 0.66 in the past year. (Table 9 and Chart 6). Note that reconviction rates for different lengths of custodial sentences vary considerably which is discussed in the next section of this bulletin.
Of those convicted in 2021-22, 27.3% had a previous custodial sentence in the past 10 years, with 12.5% of offenders having 3 to 10 previous custodial sentences, and 3.5% having over 10. Of those convicted in 2021-22 with a custodial sentence, 70.0% had at least one previous custodial sentence in the past 10 years, with 35.7% having between 3 to 10 and 12.9% having over 10.
5.5.2 Extended Sentences
Extended Sentences are custodial sentences given for sexual crimes, or violent crimes that attract a custodial sentence of four years or more. Extended Sentences have a period of supervision of up to 10 years in the community after the custodial sentence. If offenders breach their licence during the extended part of the sentence, they can be recalled to prison. Reconviction rates for Extended Sentences, like other custodial sentences, are based on the estimated release date from the custodial part of the sentence. We do not have information on the length of the supervision period on our dataset at the moment, just the length of the custodial part of the sentence. The reconviction rates are low compared to other disposals, in part because they are given for more serious crimes that are typically committed less frequently than other crimes.
Both reconviction rates and the average number of reconvictions for Extended Sentences increased over the past year. Extended Sentences increased between 2019-20 and 2020-21 from 7.9% to 9.9%. The average number of reconvictions increased from 0.11 in 2019-20 to 0.12 in 2020-21. Reconvictions have fluctuated from year to year for Extended Sentences, which in part is probably due to the small cohort sizes and low numbers of reconvictions, where a small change would have a greater effect on percentages compared to larger cohorts (Table 9 and Chart 6).
5.5.3 SROs
SROs are given for crimes other than sexual crimes and consist of a custodial sentence of one to four years, followed by a period of supervision of up to a year by a social worker. If the offender breaches the order they can be recalled to prison. As with Extended Sentences, we do not have information on the length of the supervision period in our dataset.
Reconvictions decreased for SROs in the past year. The reconviction rate of SROs decreased in the past year, from 34.9% in 2019-20 to 30.0% in 2020-21. The average number of reconvictions decreased from 0.53 to 0.42 in the same period (Table 9 and Chart 6).
5.5.4 Community sentences: CPOs, DTTOs, RLOs
If an offender fails to comply with a requirement in the order, the court can impose a number of sanctions, including a restricted movement requirement.
CPOs replaced the legacy community orders in 2011. There were still a very small number of legacy community orders in 2018-19 as they were given for offences committed prior to February 2011. During the transition from legacy orders to CPOs from 2010-11 to 2013-14, there were changes in the characteristics of offenders that were given these disposal types. Annex D gives a brief overview of the trends during the transitional period. CPOs are the mostly widely used community sentence, with a cohort size of 8,156 in 2019-20, an increase of 648 from 2018-19.
Reconvictions for CPOs increased in the past year, from 25.4% in 2019-20 to 27.9% in 2020-21. The average number of reconvictions increased from 0.44 to 0.46 in the same period and remain at the lowest rates since CPOs were introduced (Table 9 and Chart 6).
Of those convicted in 2021-22, 44.1% had a previous community sentence in the past 10 years, with 16.9% of offenders having 3 to 10 previous community sentences, and 0.6% having over 10. Of those convicted in 2021-22 with a community sentence, 49.5% had at least one previous community sentence in the past 10 years, with 18.6% having between 3 to 10 and 0.7% having over 10 (Table 20).
5.5.5 Drug Treatment and Testing Order (DTTO)
A DTTO is a high tariff disposal for people with serious drug use problems. It includes the requirement for regular reviews by the court and that the person consents to frequent random drug tests throughout the lifetime of the order.
Offenders given a DTTO have seen a large reduction in the average number of reconvictions per offender. The high reconviction rates are associated with the substance misuse that led to the disposal and should not be interpreted as a particular lack of effectiveness of DTTOs compared to other disposals. The average number of reconvictions per offender decreased from 1.19 in 2019-20 to 0.98 in 2020-21. The reconviction rate increased over the same period from 57.1% to 57.3% (Table 9 and Chart 6).
Over the longer term, average reconvictions and reconviction rates have fluctuated over the decade. Both measures in 2018-19 showed close to decade-high rates, dropping to an all-time low in the last two years.
5.5.6 Restriction of Liberty Orders (RLOs)
RLOs are imposed for periods of up to one year, and involve restricting an individual to a specified place for up to 12 hours per day and/or from a specified place for up to 24 hours.
Reconvictions for RLOs increased in the past year. The reconviction rate for RLOs changed from 29.6% to 32.8% between 2019-20 and 2020-21. The average number of reconvictions increased from 0.48 to 0.53 in the same period.
Over the longer term, reconvictions are now much lower for RLOs than they used to be, with the average number of reconvictions decreasing over the past decade from 0.76 in 2011-12 to 0.5 in 2020-21. The reconviction rate has also decreased from 40.3% in the same period. However, prior to 2019-20, reconvictions have been relatively stable in the past five years, with small year to year fluctuations. RLOs have been more widely used over the past decade, with the size of the cohort increasing from 496 in 2011-12 to 1,709 in 2020-21 (Table 9 and Chart 6).
5.5.7 Monetary disposals
Reconvictions for monetary disposals continue to be low. The reconviction rate of 20.6% for monetary disposals in 2020-21 is an increase from 17.0% in 2019-20. The average number of reconvictions increased over the same period, from 0.26 to 0.32.
The numbers of offenders with a monetary index conviction has significantly decreased in the past decade from 17,122 offenders in 2011-12 to 5,369 in 2020-21, continuing the decreasing trend from previous years. This may, in part, reflect the impact of Summary Justice Reform which was designed to take less serious cases out of the court system, and deal with them using non-court disposals (see Section 2). Reconvictions have also fallen for monetary disposals in the past decade, with the average number of reconvictions from 0.40 in 2011-12 to 0.32 in 2020-21 (Table 9 and Chart 6).
Of those convicted in 2021-22 with a monetary disposal, 58.1% had at least one previous monetary disposal in the past 10 years, with 23.7% having between 3 to 10 and 5.8% having over 10 (Table 20).
5.6 Sentence length of custodial index conviction
(Table 10a and Table 10b)
Note that Table 10a, which presents reconviction rates by custodial sentence length, includes Extended Sentences and SROs, whereas they are presented separately from other custodial sentences in Table 9. This is because the numbers of SROs are small in each sentence length category and it is difficult to interpret reconviction rates calculated on small groups. SROs will be included in the sentence length categories of below four years. The extended sentences are all in the 4 year and over category.
Short custodial sentences have high reconviction rates and long sentences have low reconviction rates due to association with different types of crime. Offenders who commit relatively less serious crimes but in high volumes are more likely to be reconvicted (see Section 5.2), and these offenders are more likely to get short custodial sentences. In contrast, longer custodial sentences are given to offenders who commit more serious crimes, but these offenders tend to commit these crimes in low volumes, and hence fewer are reconvicted. For example, the reconviction rate for custodial sentences of three months or less in 2020-21 was 53.7%, compared to 7.1% for sentences over four years (Table 10a and Chart 7).
Chart 7 shows how different custodial sentence lengths compare with other disposals. Also compare Table 10a to Table 9.
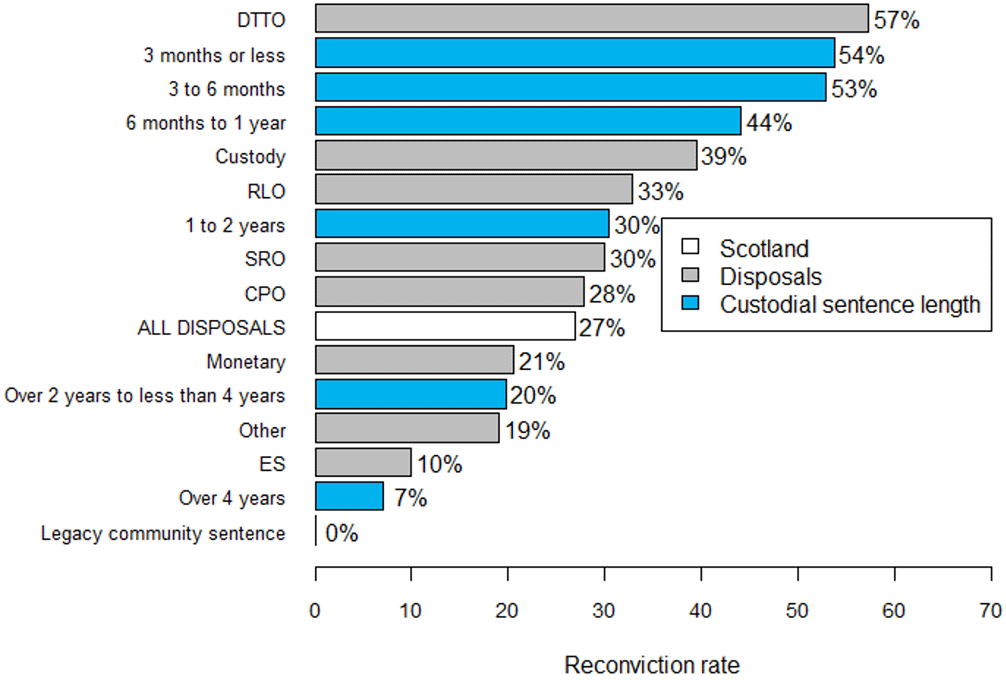
1. Chart 7 shows reconviction rates for each disposal type. The category, Custody, shows reconviction rates for all offenders discharged from a prison or young offender institutions in 2020-21. SROs and Extended Sentences are presented separately from the Custody category. Custodial sentence lengths includes all custodial sentences (prison, young offender institutions, Extended Sentences, and SROs).
Change in reconviction rates over the last year vary by custodial sentence length. (Table 10a). Over the past year between 2019-20 and 2020-21, decreases in reconviction rates for were seen for sentences under 3 months (1.3 percentage points) and 2 to 4 years (4.7 percentage points). Increases were seen for sentences between 6 and 12 months (1.2 percentage points), 1 to 2 years (6.5 percentage points), 1 to 2 years (3.1 percentage points) and over 4 years (2.3 percentage points).
Over the past ten years, reconviction rates for all sentence lengths have fluctuated with no clear trend (Table 10a). However, the average number of reconvictions has decreased for all sentence lengths. Therefore, although a similar percentage are being reconvicted, they are reconvicted less frequently.
Table 10b shows reconviction rates and average number of reconvictions for all custodial sentences of one year or less from 1997-98 to 2020-21. These combine all the one year or less custodial sentence length reconvictions that are presented in Table 10a. This table has been included in response to user need for these figures due to high interest around the extension of the presumption against short sentences from three months or less to one year or less.
5.7 Conviction history prior to index conviction
(Table 11)
Conviction history is a strong predictor for the likelihood of reconviction, as reconviction rates increase with increasing numbers of previous reconvictions. Offenders with more than 10 previous convictions have the highest reconviction rates, whereas offenders with no previous convictions in the past ten years have the lowest reconviction rates. This pattern holds true even when age, sex, or disposal (all of which have an association with the likelihood of reconviction) are taken into account (Table 11).
5.8 Two-year rates
(Table 14)
Reconviction rates in Scotland were reported with a two-year follow-up period before the 2009-10 cohort bulletin. After this point, the focus has been on a follow-up period of one year rather than two years as, in general, the one-year rate tracks the two-year rate, and has the benefit of being more timely.
Using the two-year follow up period there has been a decrease in the reconviction rate every year from 2009-10 onwards until this year (Table 14). For two-year rates in this bulletin, we observe the 2019-20 cohort, where reconviction numbers will only be affected by the pandemic after March 2020. Between 2018-19 and 2019-20, the reconviction rate increased from 34.0% to 38.2%. During the same period, the average number of reconvictions also increased, from 0.72 to 0.82. Over 10 years from 2010-11 to 2019-20, the two-year average number of reconvictions per offender has decreased from 1.02 to 0.69, and the reconviction rate saw a reduction from 41.1% to 33.1%.
These long term declining trends mirror those seen for the one-year follow up period (Table 1) but as there is a longer follow-up period, the associated values are typically greater.
Contact
Email: Justice_Analysts@gov.scot
There is a problem
Thanks for your feedback