Razor clam surveys - Firth of Clyde and Solway: report
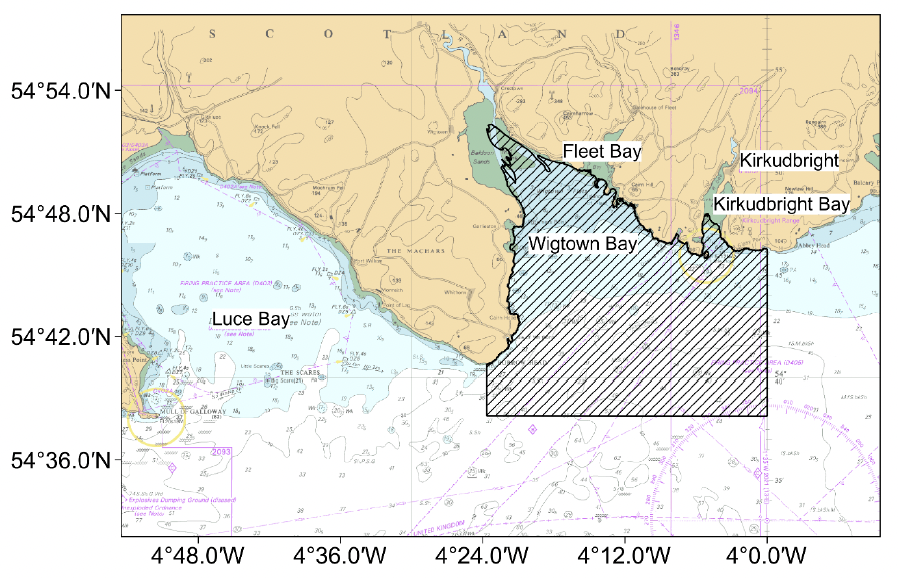
This report describes a survey carried out in the Firth of Clyde (2023) and Solway (2024) to estimate the densities and sizes of razor clam, Ensis siliqua. The surveys were conducted as part of the Scottish Government’s electrofishing scientific trial.
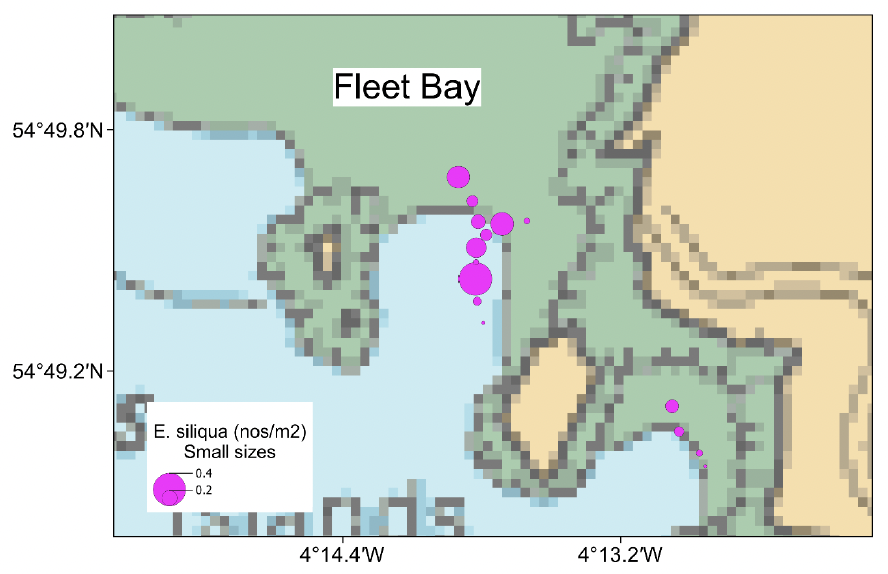
Appendix I - Report figures.
![Chart of the Firth of Clyde showing the location of the Scottish Government scientific trial area for electrofishing for razor clams which is located along the Ayrshire coast from just north of Ardrossan down to just south of Ballantrae.](/binaries/content/gallery/publications/research-analysis/2024/12/report-2023-razor-clam-survey-firth-clyde-2024-survey-solway/SCT09244696881_g01.png)
![Chart of Irvine Bay, Ayrshire coast showing the mid-points of the video tows conducted in the 2023 survey.](/binaries/content/gallery/publications/research-analysis/2024/12/report-2023-razor-clam-survey-firth-clyde-2024-survey-solway/SCT09244696881_g02.png)
![Chart of Ayr Bay, Ayrshire coast showing the mid-points of the video tows conducted in the 2023 survey.](/binaries/content/gallery/publications/research-analysis/2024/12/report-2023-razor-clam-survey-firth-clyde-2024-survey-solway/SCT09244696881_g03.png)
![Chart of Culzean Bay, Ayrshire coast showing the mid-points of the video tows conducted in the 2023 survey.](/binaries/content/gallery/publications/research-analysis/2024/12/report-2023-razor-clam-survey-firth-clyde-2024-survey-solway/SCT09244696881_g04.png)
![Chart of Turnberry Bay, Ayrshire coast showing the mid-points of the video tows conducted in the 2023 survey.](/binaries/content/gallery/publications/research-analysis/2024/12/report-2023-razor-clam-survey-firth-clyde-2024-survey-solway/SCT09244696881_g05.png)
![Chart of Machrie Bay, west side of Arran, showing the mid-points of the video tows conducted in the 2023 survey.](/binaries/content/gallery/publications/research-analysis/2024/12/report-2023-razor-clam-survey-firth-clyde-2024-survey-solway/SCT09244696881_g06.png)
![Chart of Carradale and Saddell Bays, east coast of the Mull of Kintyre, showing the mid-points of the video tows conducted in the 2023 survey.](/binaries/content/gallery/publications/research-analysis/2024/12/report-2023-razor-clam-survey-firth-clyde-2024-survey-solway/SCT09244696881_g07.png)
![Chart of the Solway showing the location of the Scottish Government scientific trial area for electrofishing for razor clams which is located between Burrow Head and Kirkudbright range.](/binaries/content/gallery/publications/research-analysis/2024/12/report-2023-razor-clam-survey-firth-clyde-2024-survey-solway/SCT09244696881_g08.png)
![Water column profiles of temperature and salinity for each survey day in the Firth of Clyde. Temperature and salinity profiles were either slightly cooler and fresher towards the surface on days prior to 18th October or were vertically well mixed on subsequent days.](/binaries/content/gallery/publications/research-analysis/2024/12/report-2023-razor-clam-survey-firth-clyde-2024-survey-solway/SCT09244696881_g09.png)
![An illustrative example of the image quality captured by the razor clam video camera sled during the Firth of Clyde survey. The images clearly show the sandy seabed with some fragments of seaweed and a fully emerged razor clam lying on the seabed. The shallow indentations caused by the passage of the electrode rods can also be clearly seen.](/binaries/content/gallery/publications/research-analysis/2024/12/report-2023-razor-clam-survey-firth-clyde-2024-survey-solway/SCT09244696881_g10.png)
![Two histograms showing the distribution of tow durations and tow lengths for the tows conducted in the Firth of Clyde survey. The patterns are described in the results section of the main report. Two histograms showing the distribution of tow speeds and estimated exposure times to the electrical field for the tows conducted in the Firth of Clyde survey. The patterns are described in the results section of the main report.](/binaries/content/gallery/publications/research-analysis/2024/12/report-2023-razor-clam-survey-firth-clyde-2024-survey-solway/SCT09244696881_g11.png)
![Three density histograms showing the shell length distributions as reconstructed from the videos recorded during the Firth of Clyde survey. The top plot shows all the tow data and suggests there were three modes at around 100 to 110, 140 to 150, and 200 to 210 millimetres. The middle plot shows results from tows within the trial fishery zone and is more dominated by the 100 to 110 and 200 to 210 millimetres modes. The lower plot shows data from tows outside the trial fishery zone where the three modes are more clearly distinguishable.](/binaries/content/gallery/publications/research-analysis/2024/12/report-2023-razor-clam-survey-firth-clyde-2024-survey-solway/SCT09244696881_g12.png)
![Seven density histograms showing the shell length data broken down by sampling site. For sites within the trial zone the length distributions were more dominated by sizes in the 150 to 250 millimetres range for Irvine and Turnberry Bays. For Ayr and Culzean Bays the lengths were more evenly distributed across the larger and smaller than 150 millimetre sizes. For sites outside of the trial fishery zone, shell length distributions in Carradale and Saddell Bays were dominated by clams larger than 150 millimetres shell length, while for Machrie Bay razors around 150 millimetres were more common.](/binaries/content/gallery/publications/research-analysis/2024/12/report-2023-razor-clam-survey-firth-clyde-2024-survey-solway/SCT09244696881_g13.png)
![Boxplots of Ensis siliqua density estimates by site and length category. The patterns in these plots are described in the results section of the main report.](/binaries/content/gallery/publications/research-analysis/2024/12/report-2023-razor-clam-survey-firth-clyde-2024-survey-solway/SCT09244696881_g14.png)
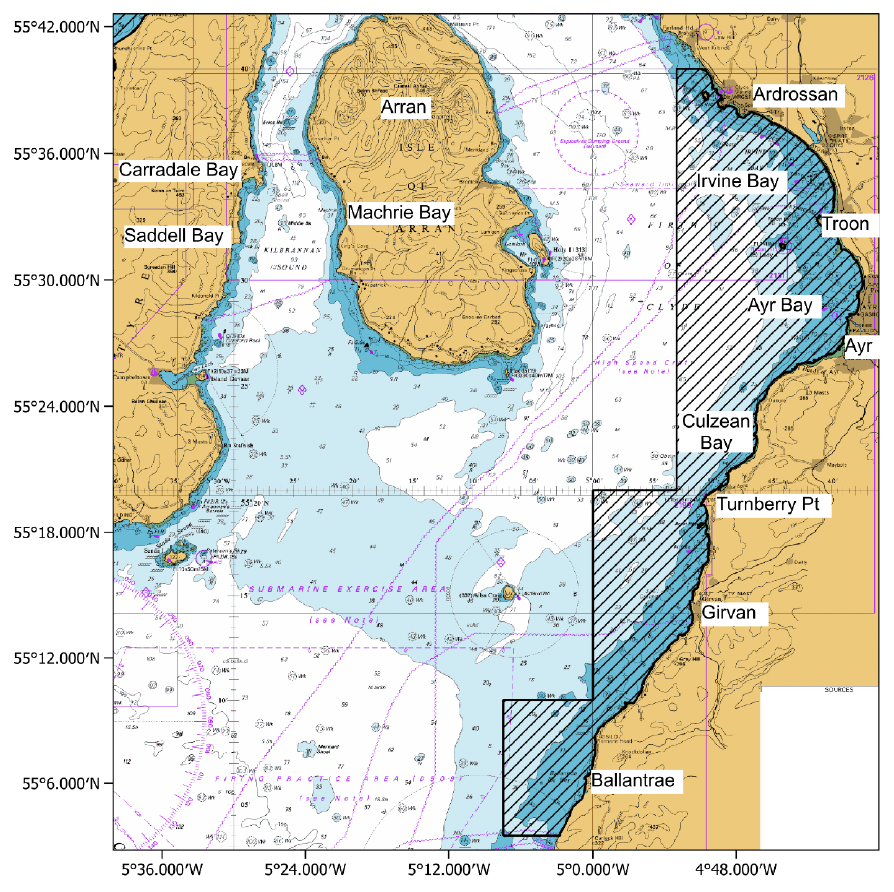
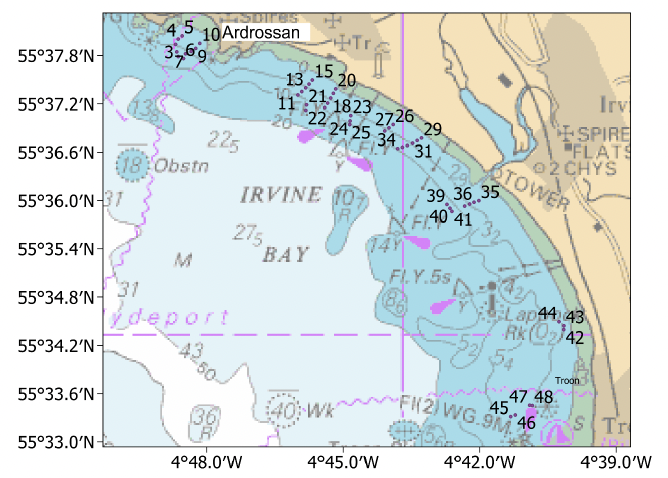
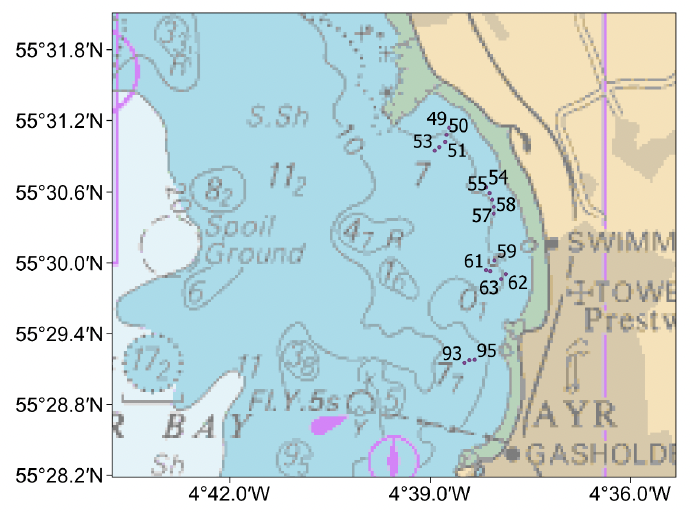
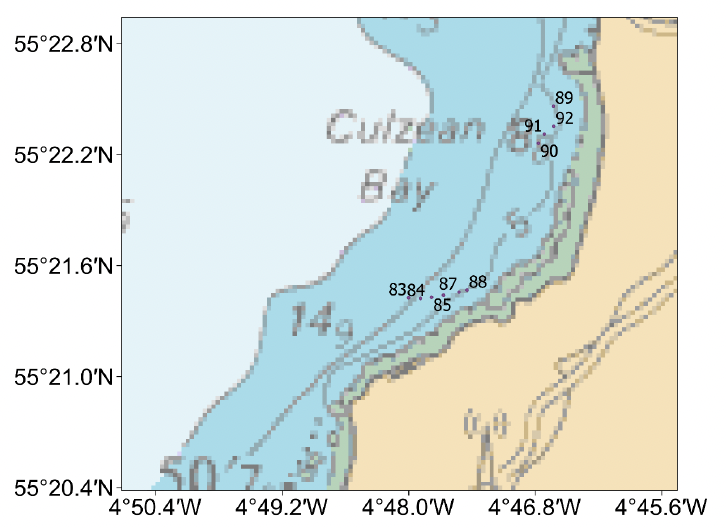
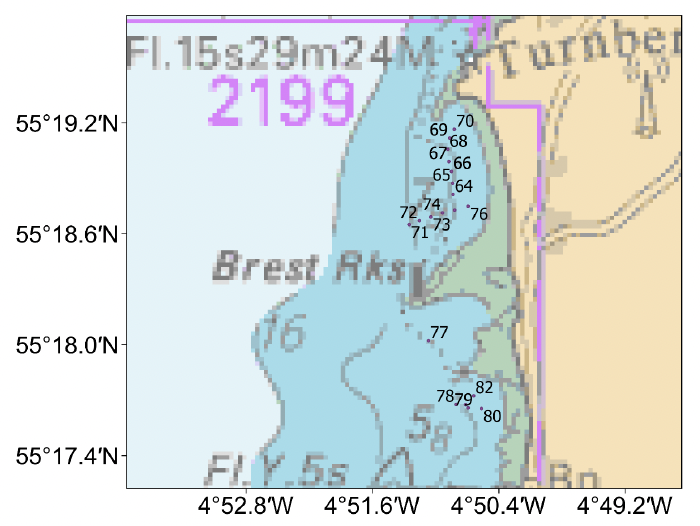
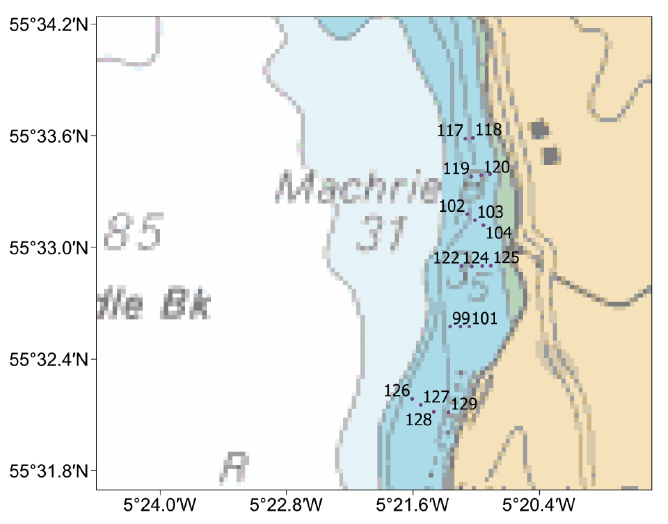
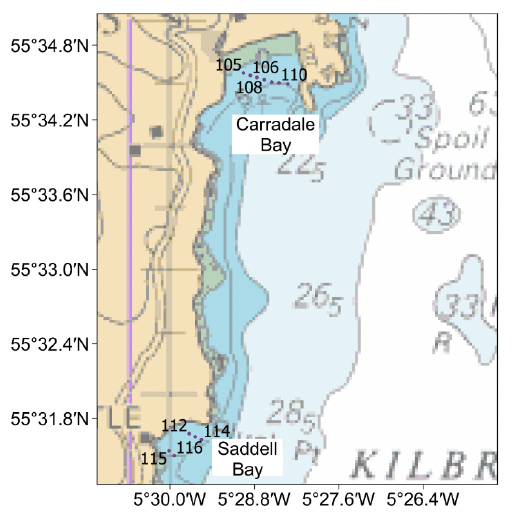
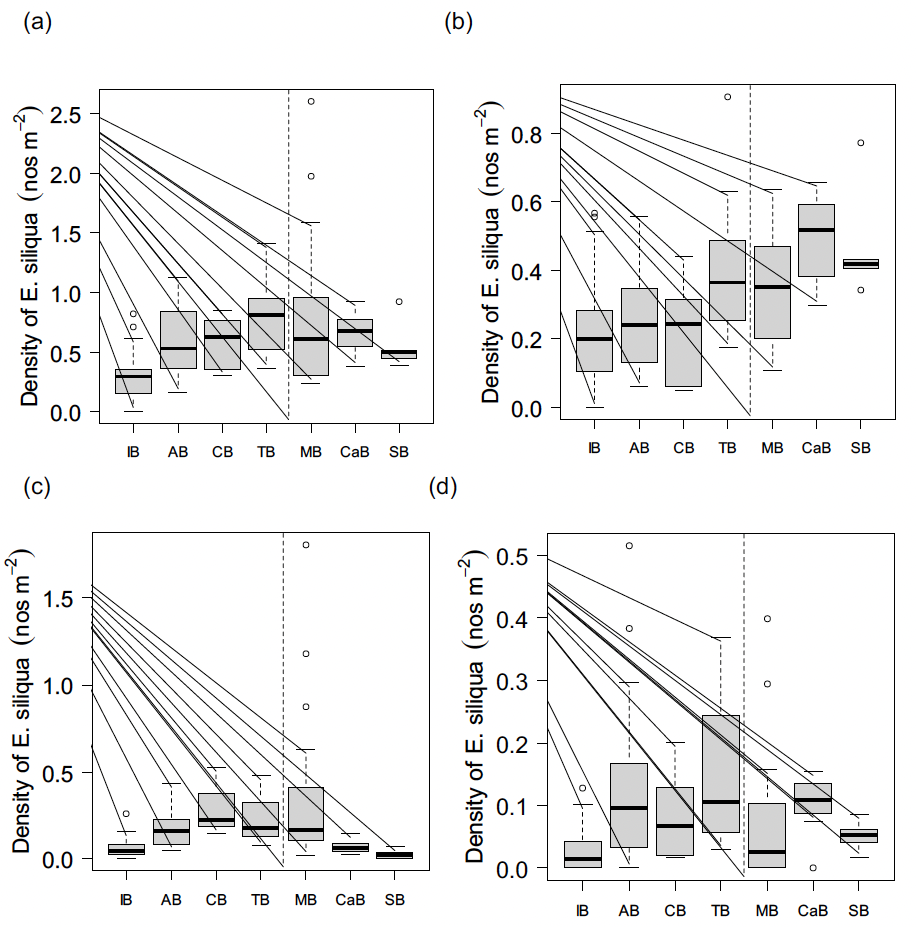
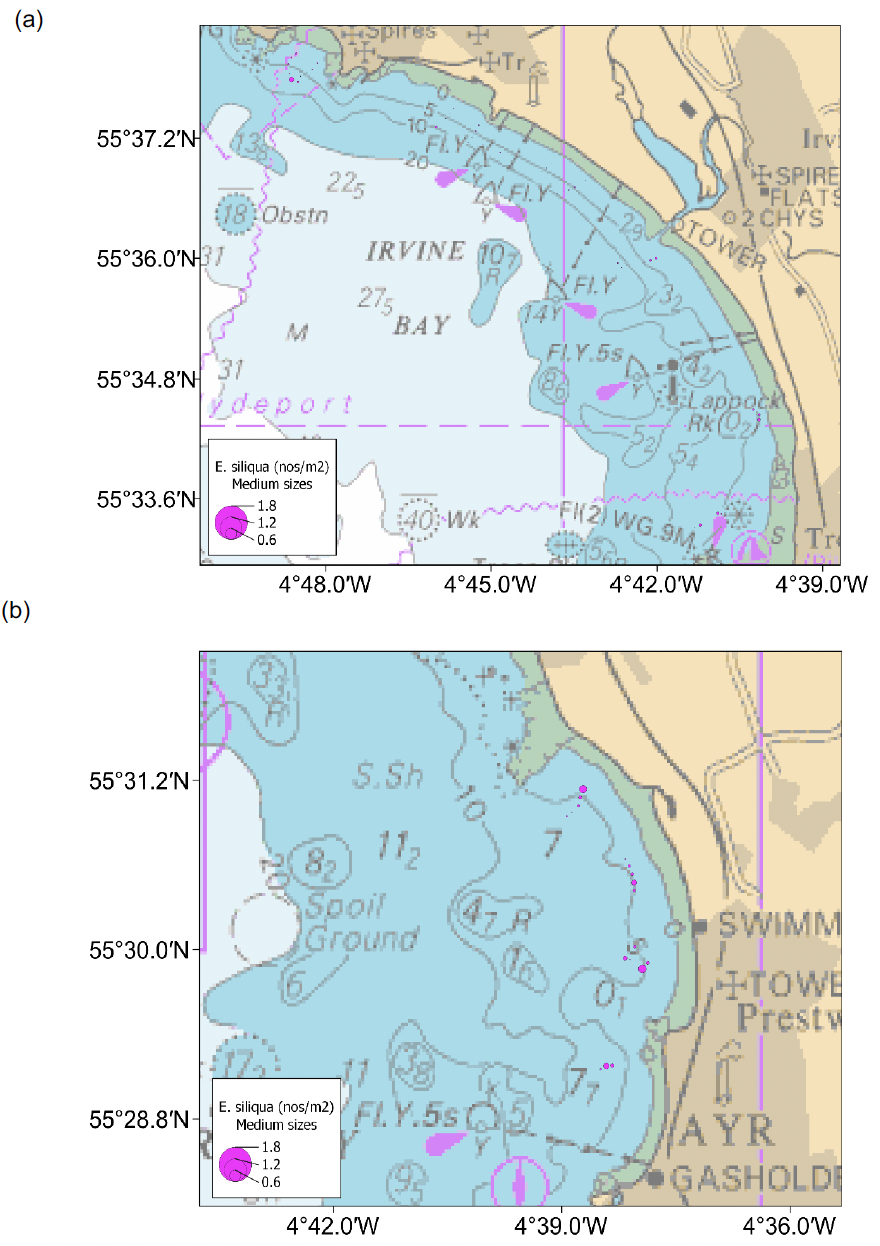
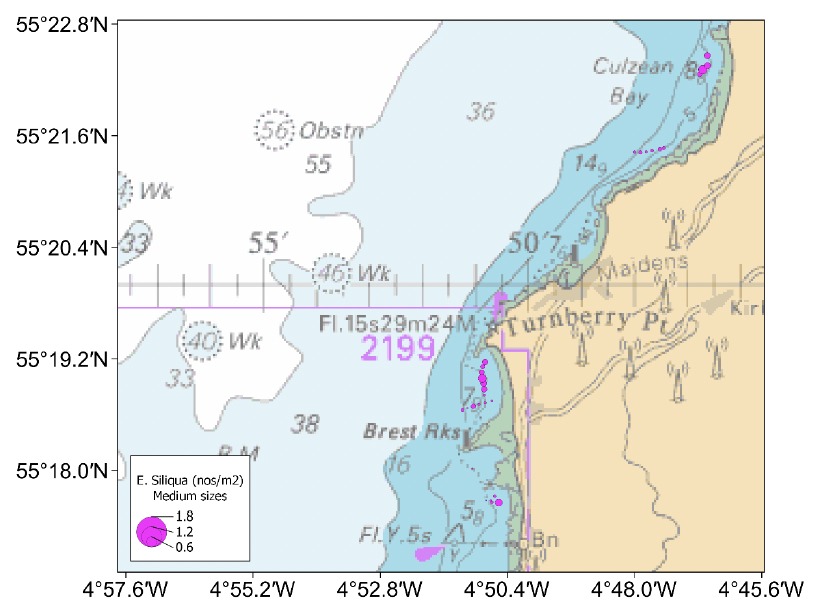
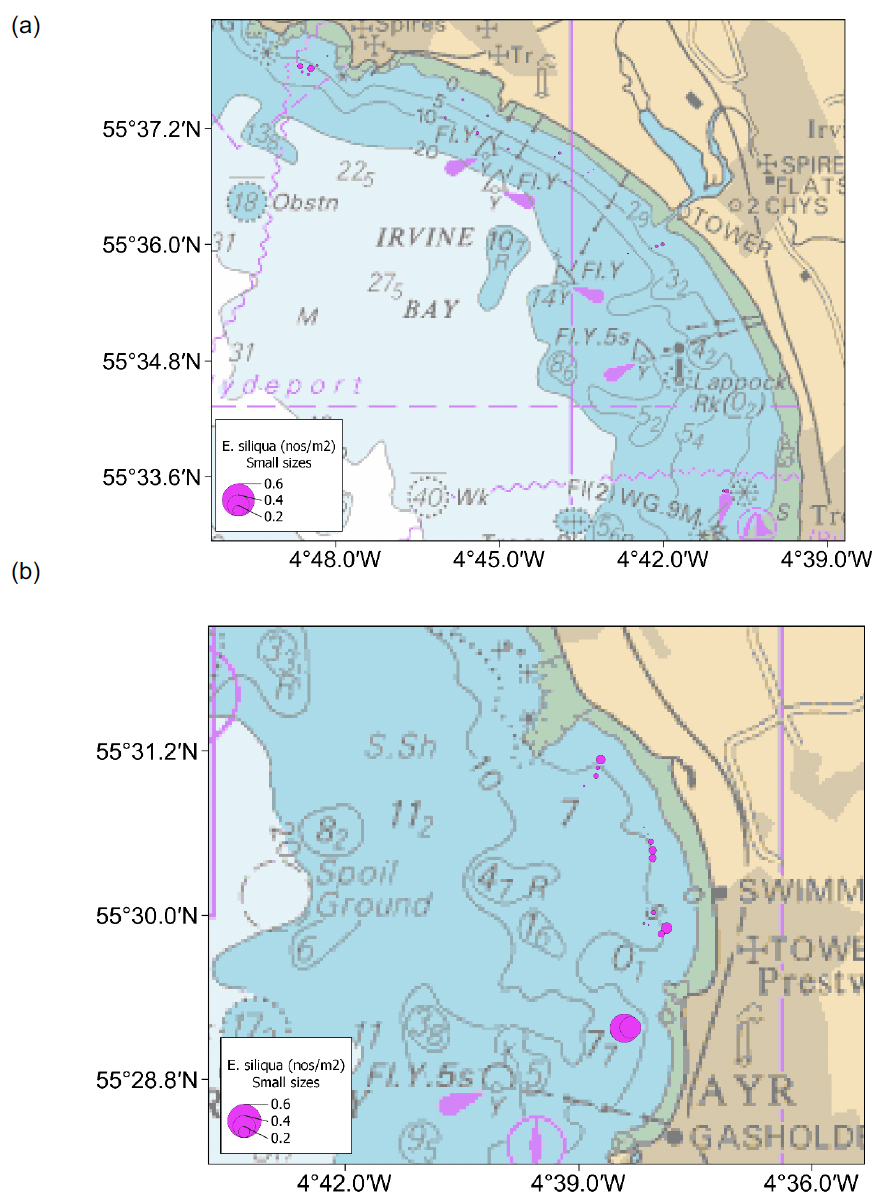
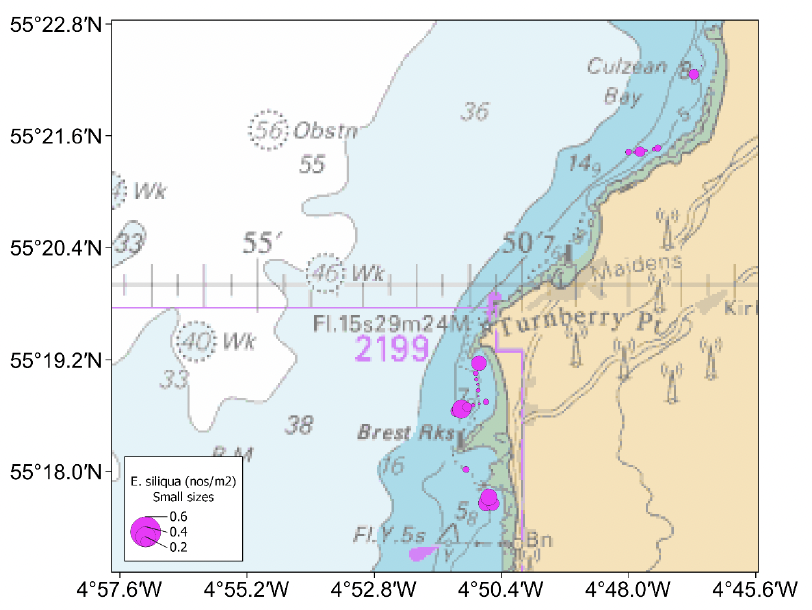
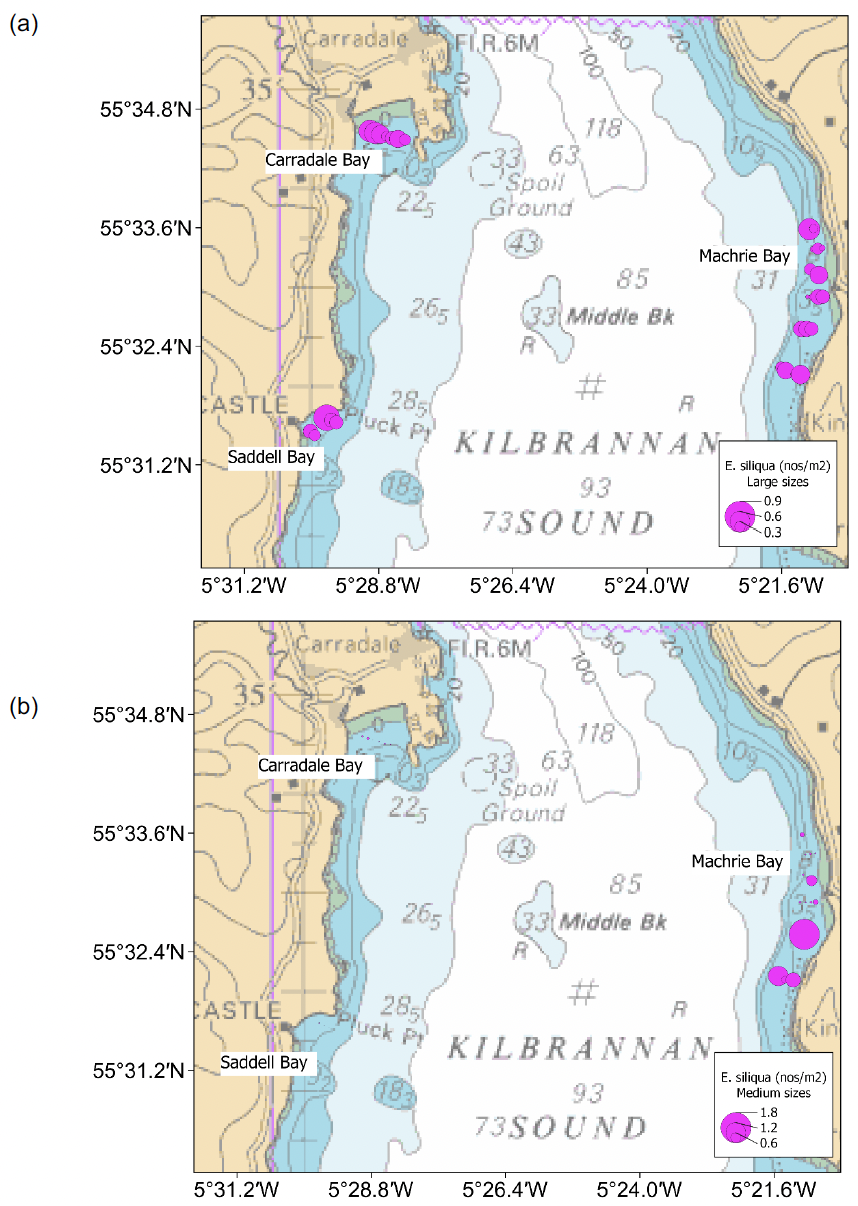
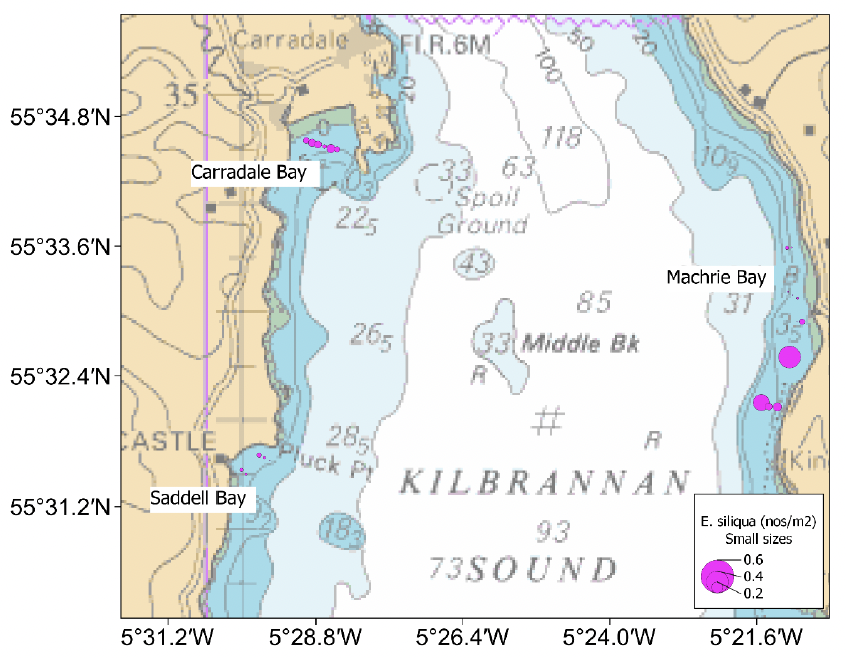
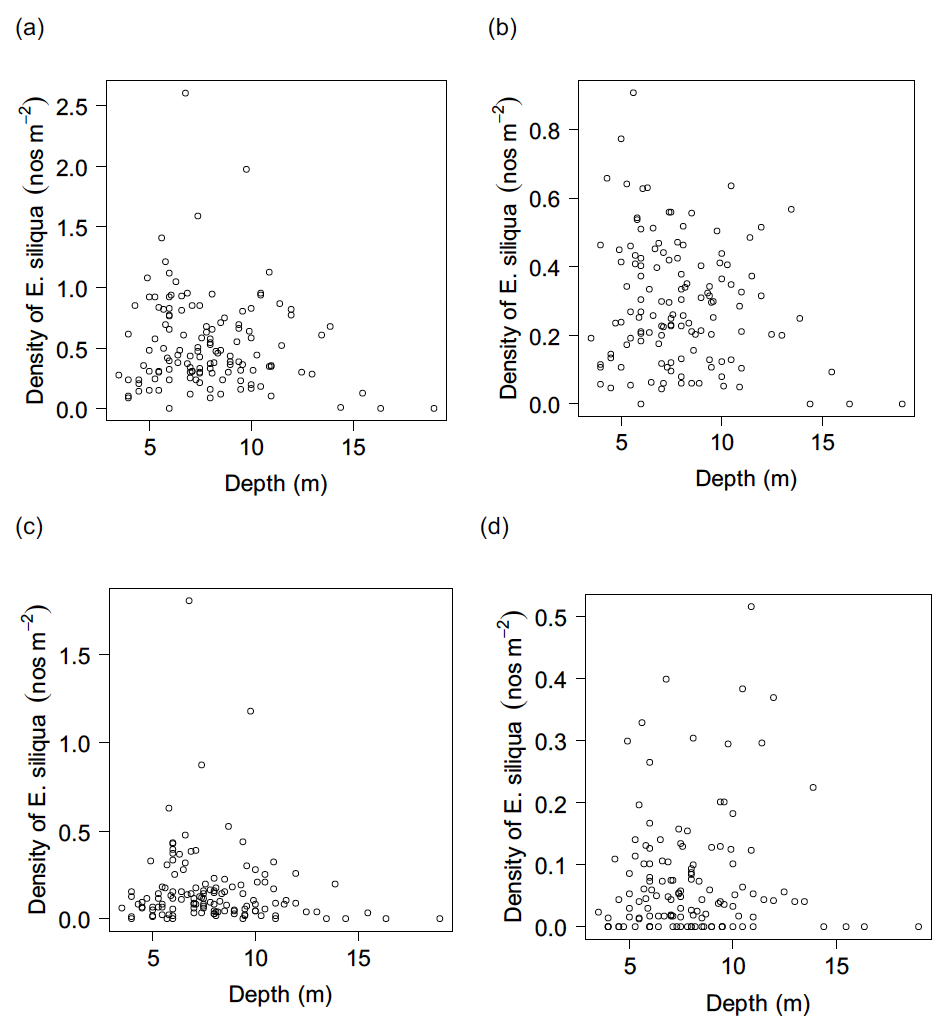
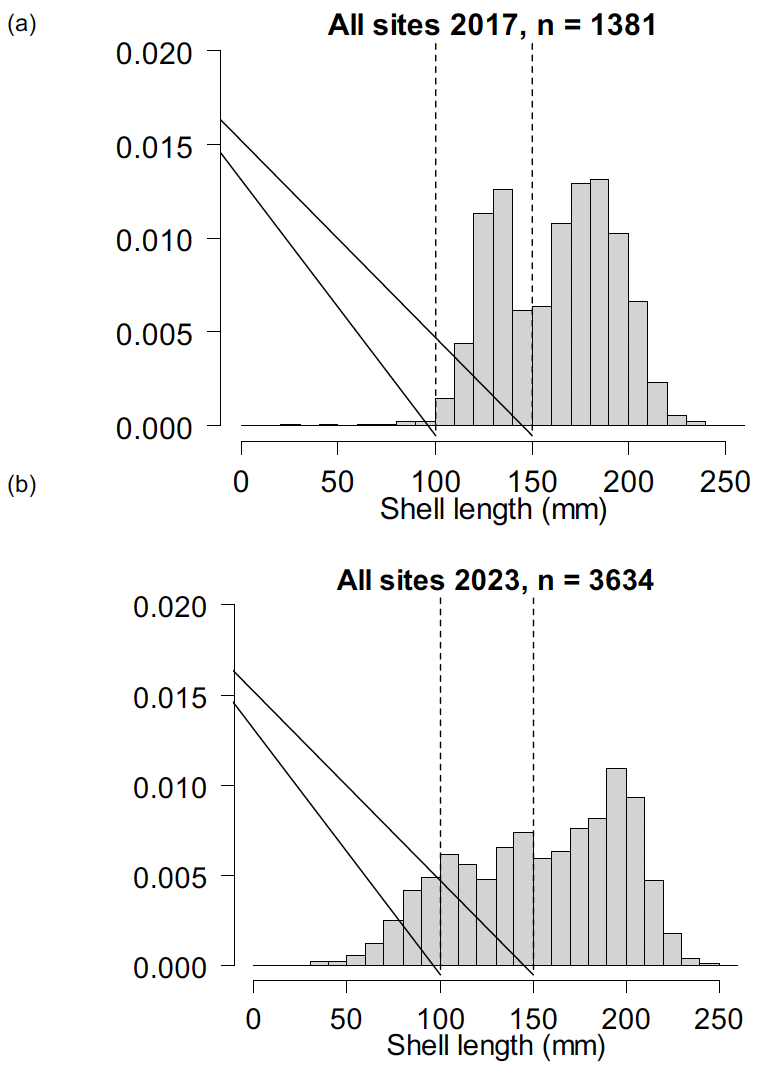
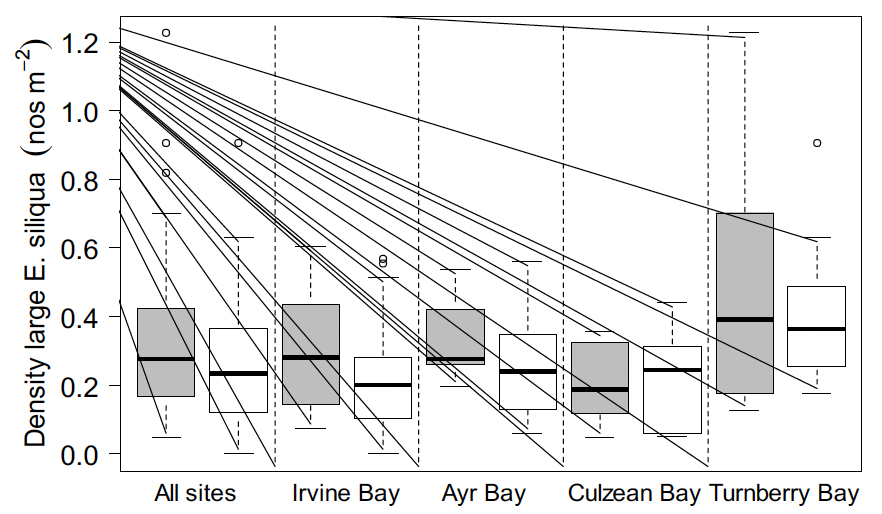
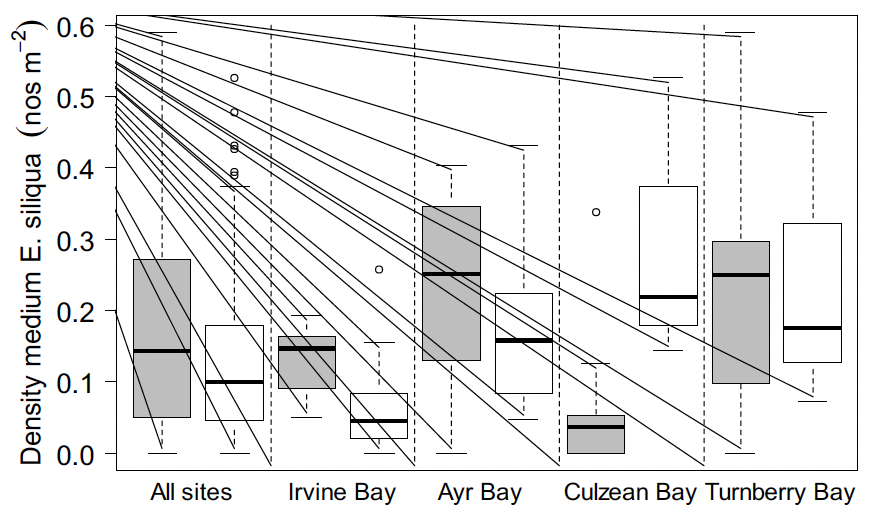
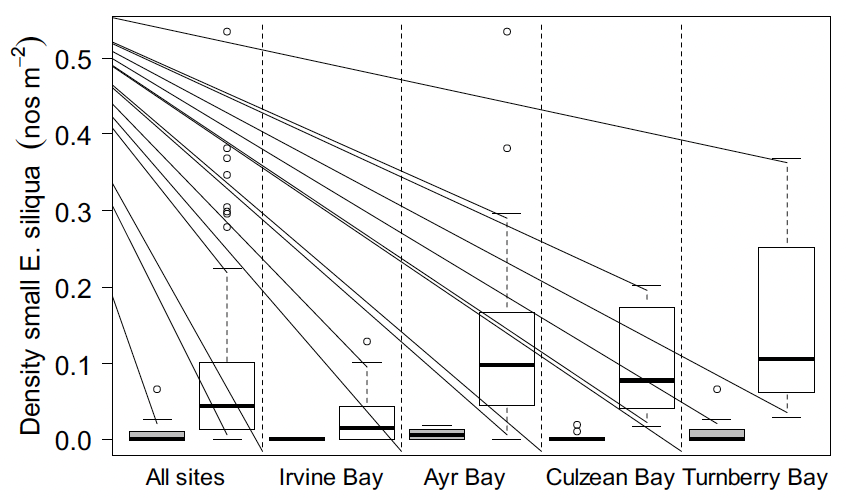
IB = Irvine Bay, AB = Ayr Bay, CB = Culzean Bay, TB = Turnberry Bay, MB = Machrie Bay, CaB = Carradale Bay, SB = Saddell Bay. Vertical dashed line separates sites within the scientific trial from sites outside the permitted fishing area. Heavy horizontal lines indicate the medians, the boxes the interquartile ranges, whiskers show the quartiles +/- 1.5 times the interquartile range, circles indicate outliers: (a) All sizes of E. siliqua; (b) Large E. siliqua ≥ 150 mm shell length; (c) Medium E. siliqua ≥100 mm and < 150 mm; (d) Small E. siliqua < 100 mm shell length.
![Bubble plots showing the spatial distribution of large sized Ensis siliqua in Irvine and Ayr Bays. Razors larger than 150 millimetres shell length were found across the area with no obvious spatial pattern.](/binaries/content/gallery/publications/research-analysis/2024/12/report-2023-razor-clam-survey-firth-clyde-2024-survey-solway/SCT09244696881_g15.png)
![Bubble plots showing the spatial distribution of large sized Ensis siliqua in Culzean and Turnberry Bays. Razors larger than 150 millimetres shell length were recorded on most of the tows with higher densities in Turnberry Bay compared to the other sites within the trial fishery zone.](/binaries/content/gallery/publications/research-analysis/2024/12/report-2023-razor-clam-survey-firth-clyde-2024-survey-solway/SCT09244696881_g16.png)
![Bubble plots showing the spatial distribution of medium sized Ensis siliqua in Irvine and Ayr Bays. Razors between 100 to 150 millimetres shell length were less common in Irvine Bay but recorded on most tows in Ayr Bay.](/binaries/content/gallery/publications/research-analysis/2024/12/report-2023-razor-clam-survey-firth-clyde-2024-survey-solway/SCT09244696881_g17.png)
![Bubble plots showing the spatial distribution of medium sized Ensis siliqua in Culzean and Turnberry Bays. Razors between 100 to 150 millimetres shell length were recorded on most of the tows and were a little more common in these sites compared to Irvine and Ayr Bays.](/binaries/content/gallery/publications/research-analysis/2024/12/report-2023-razor-clam-survey-firth-clyde-2024-survey-solway/SCT09244696881_g18.png)
![Bubble plots showing the spatial distribution of small sized Ensis siliqua in Irvine and Ayr Bays. Razors smaller than 100 millimetres shell length were found in a small patch off Ardrossan harbour but appeared more widely spread in Ayr Bay.](/binaries/content/gallery/publications/research-analysis/2024/12/report-2023-razor-clam-survey-firth-clyde-2024-survey-solway/SCT09244696881_g19.png)
![Bubble plots showing the spatial distribution of small sized Ensis siliqua in Culzean and Turnberry Bays. Razors smaller than 100 millimetres shell length were recorded on nearly all the tows and seemed to become more common moving south into Turnberry Bay.](/binaries/content/gallery/publications/research-analysis/2024/12/report-2023-razor-clam-survey-firth-clyde-2024-survey-solway/SCT09244696881_g20.png)
![Bubble plots showing the spatial distribution of large and medium sized Ensis siliqua in Machrie, Carradale and Saddell Bays which are outside of the trial fishing zone. Razors larger than 150 millimetres shell length were found on nearly all the tows with little obvious spatial pattern. Razors between 100 to 150 millimetres shell length were more common in Machrie Bay and higher density tows were spatially clustered towards the southern end of the bay.](/binaries/content/gallery/publications/research-analysis/2024/12/report-2023-razor-clam-survey-firth-clyde-2024-survey-solway/SCT09244696881_g21.png)
![Bubble plots showing the spatial distribution of small sized Ensis siliqua in Machrie, Carradale and Saddell Bays which are outside of the trial fishing zone. Razors smaller than 100 millimetres were more common in the southern end of Machrie Bay and in Carradale Bay with apparently lower densities in Saddell Bay.](/binaries/content/gallery/publications/research-analysis/2024/12/report-2023-razor-clam-survey-firth-clyde-2024-survey-solway/SCT09244696881_g22.png)
![Two of four scatterplots showing the densities of all sizes and the large Ensis siliqua plotted against water depths at the time of sampling in the Firth of Clyde survey. There were no obvious patterns in these data. Two of four scatterplots showing the densities of the medium and small size Ensis siliqua plotted against water depths at the time of sampling in the Firth of Clyde survey. There were no obvious patterns in these data.](/binaries/content/gallery/publications/research-analysis/2024/12/report-2023-razor-clam-survey-firth-clyde-2024-survey-solway/SCT09244696881_g23.png)
![Two of four plots showing the frequency distribution of partial emergence rates for razor clams from the Clyde survey, and the partial emergence rates plotted against exposure time to the electrical field, on each tow. There were no obviously strong relationships although some suggestion of a positive link with water depth. Two of four plots showing the partial emergence rates plotted against water depth at the time of sampling and the average density of Ensis siliqua on each tow. There were no obviously strong relationships although some suggestion of a positive link with water depth.](/binaries/content/gallery/publications/research-analysis/2024/12/report-2023-razor-clam-survey-firth-clyde-2024-survey-solway/SCT09244696881_g24.png)
![Two density histograms showing the shell lengths for Ensis siliqua for the Ayrshire coast, Firth of Clyde surveys conducted in 2017 and 2023. The more recent data show a shift towards a greater proportion of the reconstructed lengths being comprised of razor clams smaller than 100 mm shell length. This indicates that recruitment of young razor clams has taken place during the period of the electrofishing trial.](/binaries/content/gallery/publications/research-analysis/2024/12/report-2023-razor-clam-survey-firth-clyde-2024-survey-solway/SCT09244696881_g25.png)
![Boxplots of the densities of large size Ensis siliqua by site and comparing results from the 2017 and 2023 Ayrshire coast, Firth of Clyde surveys. The plots show that the median densities of razor clams larger than 150 millimetres shell length have declined when averaged across all the surveyed sites, and within Irvine, Ayr and Turnberry Bays. However, for Culzean Bay there was a slight increase in the median density of large size razors.](/binaries/content/gallery/publications/research-analysis/2024/12/report-2023-razor-clam-survey-firth-clyde-2024-survey-solway/SCT09244696881_g26.png)
![Boxplots of the densities of medium size Ensis siliqua by site and comparing results from the 2017 and 2023 Ayrshire coast, Firth of Clyde surveys. The plots show that the median densities of razor clams sized 100 to 150 millimetres shell length have declined when averaged across all the surveyed sites, and within Irvine, Ayr and Turnberry Bays. However, for Culzean Bay there was a reasonably large increase in the median density of medium size razors.](/binaries/content/gallery/publications/research-analysis/2024/12/report-2023-razor-clam-survey-firth-clyde-2024-survey-solway/SCT09244696881_g27.png)
![Boxplots of the densities of small size Ensis siliqua by site and comparing results from the 2017 and 2023 Ayrshire coast, Firth of Clyde surveys. The plots show that the median densities of razor clams smaller than 100 millimetres shell length have increased when averaged across all the surveyed sites, and within Irvine, Ayr, Culzean and Turnberry Bays.](/binaries/content/gallery/publications/research-analysis/2024/12/report-2023-razor-clam-survey-firth-clyde-2024-survey-solway/SCT09244696881_g28.png)
![Water column profiles of temperature and salinity Fleet Bay, Solway. Temperature and salinity profiles were slightly cooler and fresher towards the surface on both days.](/binaries/content/gallery/publications/research-analysis/2024/12/report-2023-razor-clam-survey-firth-clyde-2024-survey-solway/SCT09244696881_g29.png)
![An illustrative example of the image quality captured by the razor clam video camera sled during the Fleet Bay, Solway survey. The images are murky due to the large quantities of silt in the water, but an emerged razor clam can be seen lying on the seabed.](/binaries/content/gallery/publications/research-analysis/2024/12/report-2023-razor-clam-survey-firth-clyde-2024-survey-solway/SCT09244696881_g30.png)
![Density histogram showing the Ensis siliqua shell length distributions as reconstructed from the videos recorded during the Fleet Bay, Solway survey. The plot suggests the presence of four length modes, one at around 40 to 50; a second around 90 to 100; a third around 120 to 130, and a fourth around 170 to 180 millimetres.](/binaries/content/gallery/publications/research-analysis/2024/12/report-2023-razor-clam-survey-firth-clyde-2024-survey-solway/SCT09244696881_g31.png)
![Bubble plots showing the spatial distribution of large and medium size Ensis siliqua in Fleet Bay, Solway. Densities for razors larger than 150 millimetres shell length were higher in tows to the north of the bay whilst the inverse pattern was seen for razors between 100 and 150 millimetres shell length. Bubble plots showing the spatial distribution of small size Ensis siliqua in Fleet Bay, Solway. Densities for razors smaller than 100 millimetres shell length were higher in tows to the north of the bay.](/binaries/content/gallery/publications/research-analysis/2024/12/report-2023-razor-clam-survey-firth-clyde-2024-survey-solway/SCT09244696881_g32.png)
![Bubble plots showing the spatial distribution of small size Ensis siliqua in Fleet Bay, Solway, with higher densities in the more central area.](/binaries/content/gallery/publications/research-analysis/2024/12/report-2023-razor-clam-survey-firth-clyde-2024-survey-solway/SCT09244696881_g33.png)
Contact
There is a problem
Thanks for your feedback