Protection of Water Against Agricultural Nitrate Pollution (Scotland) Regulations 1996: implementation report 2020 to 2023
This implementation report, published every four years, summarises the status of water quality and the impact of action programmes on water quality and agricultural practices, in accordance with the Protection of Water Against Agricultural Nitrate Pollution (Scotland) Regulations 1996.
2. Water quality: monitoring assessment
2.1 Introduction
This report gives a summary of the monitoring undertaken and the annual nitrates values for surface waters and groundwaters up to 2023. Their comparison throughout this period and between reporting years provides an indication of changes that have occurred. The data presented have been updated to bring them in line with other methodologies for reporting nitrate data (e.g., groundwater classification data, and nitrate prioritisation reporting).
The water quality section of this report shows that surface waters are less impacted by nitrate from agricultural sources than groundwater. The surface water data provides an insight into the water quality of the catchment, and the groundwater data implies more localised water quality.
2.2 Groundwaters
2.2.1 Groundwater monitoring network
Data on groundwaters is gathered from SEPA's national groundwater monitoring network. The number of monitoring points changes each year with a notable reduction during the Covid-19 pandemic (Figure 2.1). The recovery of the number of monitoring locations and samples taken was impacted by the SEPA cyberattack, but these have continued to recover through 2024, and we expect this to continue through 2025 with typical monitoring levels to resume in 2026. The number of monitoring locations is greater in those groundwater bodies where the impact, or risk of impact, of diffuse pollution is higher (e.g. within Nitrate Vulnerable Zones). Groundwater bodies can be grouped, such that monitoring results are extrapolated across a number of bodies with similar pressures and characteristics.
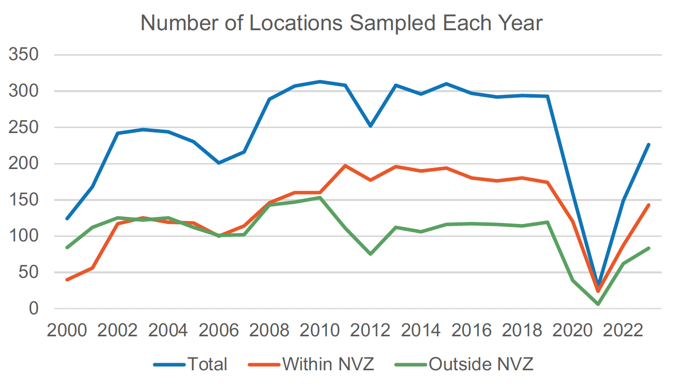
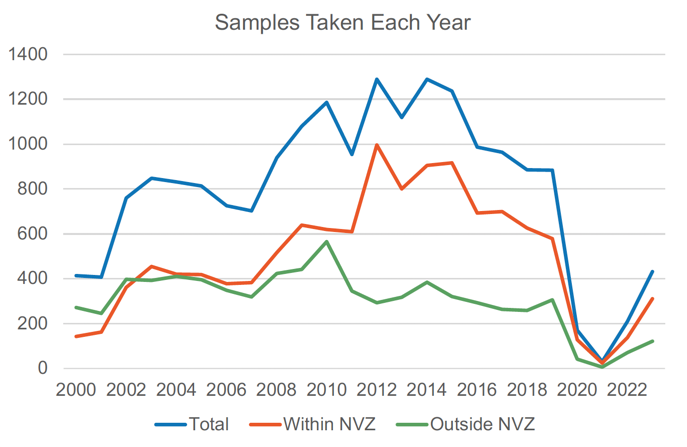
SEPA's groundwater monitoring network for the Nitrates Directive and WFD is regularly reviewed to make sure that it remains aligned with identified and emerging risks to the water environment, and that water supplies and aquatic ecosystems are protected going forward.
2.2.2 Nitrate concentrations in groundwaters
Groundwater samples tend to contain older water than surface water samples. Thus, groundwater samples will tend to reflect conditions at surface from some point in the past. The relative age difference between surface and groundwaters will vary depending on a range of factors, including the proportion of groundwater flow in a river, the depth of flow in the groundwater and the porosity type of the aquifer. In Scotland, due to the dominance of shallow, fracture flow aquifers, this "time lag" effect is estimated to be between a few weeks to several years.
For groundwaters, nitrate concentrations were generally higher than in surface water stations, with 9.15% of all stations having annual average concentrations in excess of 50 mg NO3/L (Table 1.1). This was 14.21% of stations within Nitrate Vulnerable Zones (NVZ), and 1.63% of stations outside NVZs.
All sites |
Total sites |
Number over 50 mg/l |
% over 50 mg/l |
|---|---|---|---|
2015 |
438 |
46 |
10.5 |
2019 |
348 |
34 |
9.77 |
2023 |
306 |
28 |
9.15 |
Inside NVZ |
Total sites |
Number over 50 mg/l |
% over 50 mg/l |
|---|---|---|---|
2015 |
438 |
46 |
10.5 |
2019 |
348 |
34 |
9.77 |
2023 |
306 |
28 |
9.15 |
Outside NVZ |
Total sites |
Number over 50 mg/l |
% over 50 mg/l |
|---|---|---|---|
2015 |
208 |
4 |
1.92 |
2019 |
141 |
3 |
2.13 |
2023 |
123 |
2 |
1.63 |
Groundwater status is a good indicator of the state of groundwater with respect to nitrate. Figure 2.2 shows the area of groundwater bodies that were classified as poor status for each year between 2012 and 2023 has decreased, with around 1000 km2 no longer at poor status for nitrate.
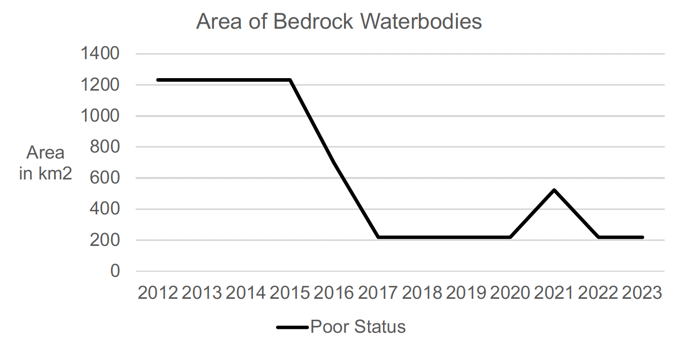
Figure 2.2 – The area of bedrock groundwater bodies classified as Poor status for nitrate in each year between 2012 and 2023.
To consider the changes in nitrate concentration over time, SEPA used a six-yearly moving average of nitrate concentrations from the national monitoring network from 2006 to 2023. This approach takes average nitrate concentrations from a moving window of six consecutive years, which moves forward in yearly steps to show nitrate concentration changes with time. This is consistent with SEPA's approach to groundwater classification and allows comparison of nitrate concentration changes in a smooth dynamic progression compared with the previous methodology.
Figures 2.3 and 2.4 split the sites into nitrate concentration thresholds or 'Quality Classes'. The nitrate concentrations thresholds are based on the nitrate drinking water standard of 50mg/l and representative fractions used in the groundwater classification process i.e. the high-risk threshold of 37.5mg/l (75%) and low risk threshold of 25mg/l (50%) allowing a comparison of the results with the groundwater classification output.
Figure 2.3 shows that there has been a decrease in the number of sites with high nitrate concentrations (above 37.5mg/l) from 2016 onwards. This suggests that measures in place to reduce nitrates (see Section 4.1) are having an impact for these sites. The increasing concentrations in the data between 2006 and 2016 are influenced by the evolution of the monitoring network. The focus during this period was to increase monitoring in the NVZs and groundwater bodies with the highest risk.
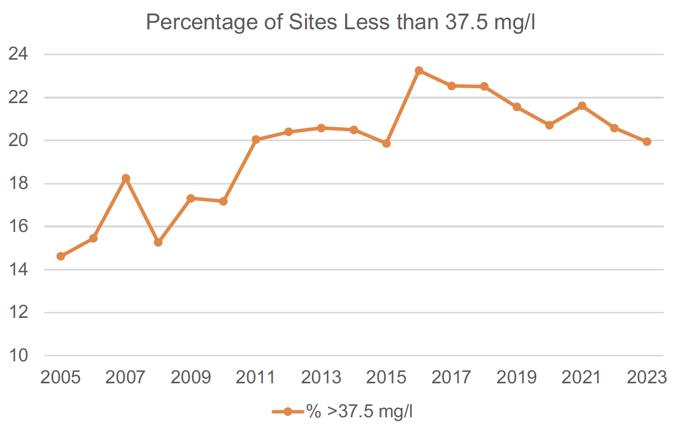
Figure 2.3 – Percentage of sites above the classification threshold of 37.5 mg/l in each year between 2005 and 2023.
This supports the groundwater classification results which show an improvement in the overall risk assessment with 1178 Km2 of Scotland at lower risk from nitrate diffuse pollution impact in 2023 compared to 2012.
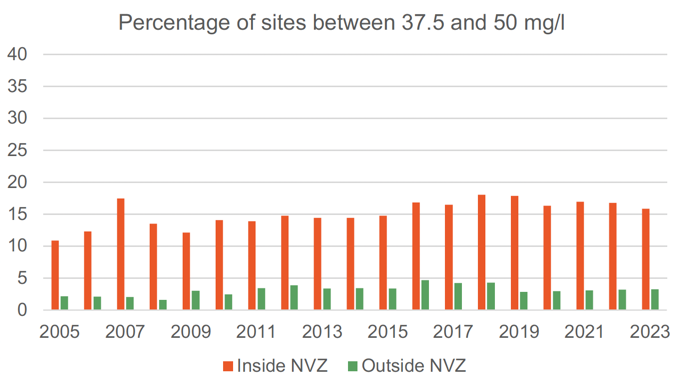
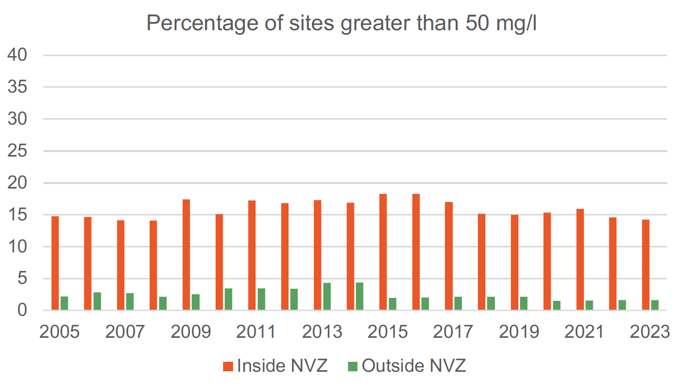
Figure 2.4 shows the percentage of sites split by nitrate concentration thresholds and locations inside and outside the NVZs to appreciate possible changes that could be attributed to the application of diffuse pollution reduction measures. Figure 2.4 shows that there is a greater reduction in the percentage of sites with concentrations above 37.5mg/l within the NVZ than outside, with a greater reduction in sites above 50mg/l (Figure 2.4 (f)) albeit this appears to be stalling in the last four years possibly due to the reduction in the number of samples collected during the Covid-19 pandemic (see Figure 2.1).
It is worth noting that as the reported values in Figure 2.4 are expressed in percentages, a reduction of percentage in sites with concentration greater than 50mg/l is matched by an increase of percentage in sites with concentration of less than 50mg/l.
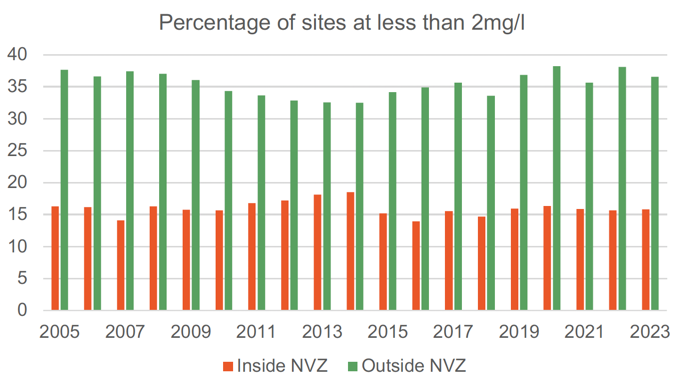
(a)
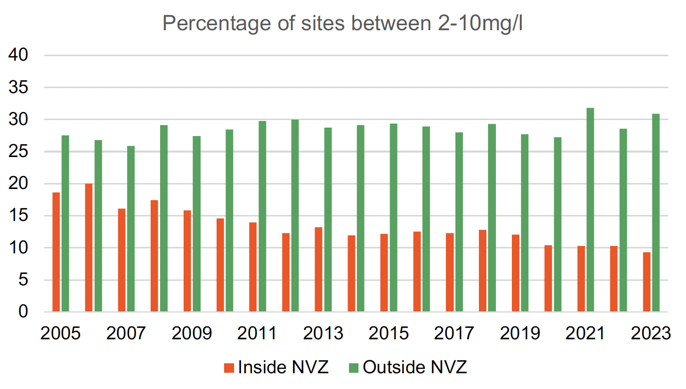
(b)
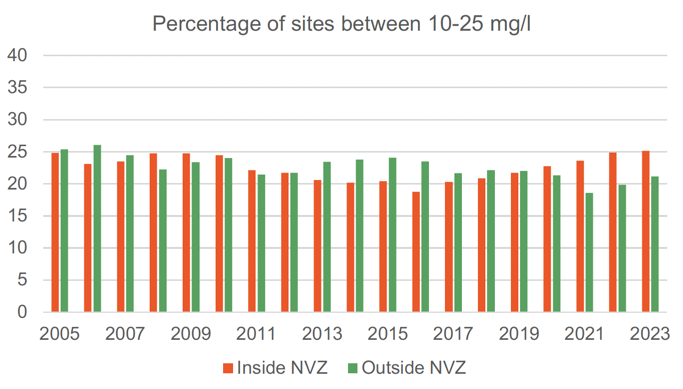
(c)
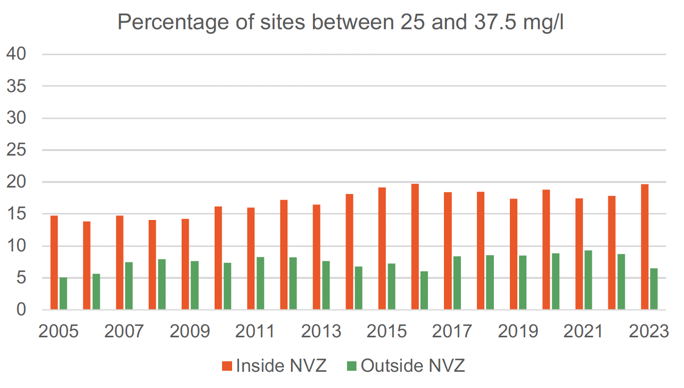
(d)
(e)
(f)
Figure 2.4 – Percentage of groundwater sites inside and outside of NVZs for nitrate concentrations thresholds of: (a) <2mg/l, (b) 2–10mg/l, (c) 10-25mg/l, (d) 25 – 37.5 mg/l, (e) 37.5-50mg/l, and (f) >50mg/l.
Table 2.4 shows a comparison of the percentage of sites in each of the Quality Classes using average nitrate concentrations over the previous six years to each of the previous reporting years. The same trend as noted above (Figure 2.4) is evident, with a reduction in sites above 50mg/L, particularly for sites within NVZs since 2015.
Table 2.5 provides a summary of the changes in average nitrate concentration at sampling points between previous (2016-2019) and current (2020-2023) reporting periods. While the picture is largely stable, Table 2.5 does suggest the largest decreases occurred at sites within NVZs, although there are also some increases at sites both within and outwith NVZs, as would be expected.
Percentage |
Reporting period |
All |
Inside NVZ |
Outside NVZ |
|---|---|---|---|---|
%<2 |
to 2015 |
24.20 |
15.22 |
34.13 |
to 2019 |
24.43 |
15.94 |
36.88 |
|
to 2023 |
24.18 |
15.85 |
36.59 |
|
%2-10 |
to 2015 |
20.32 |
12.17 |
29.33 |
to 2019 |
18.39 |
12.08 |
27.66 |
|
to 2023 |
17.97 |
9.29 |
30.89 |
|
%10-25 |
to 2015 |
22.15 |
20.43 |
24.04 |
to 2019 |
21.84 |
21.74 |
21.99 |
|
to 2023 |
23.53 |
25.14 |
21.14 |
|
%25-40 |
to 2015 |
13.47 |
19.13 |
7.21 |
to 2019 |
13.79 |
17.39 |
8.51 |
|
to 2023 |
14.38 |
19.67 |
6.5 |
|
%40-50 |
to 2015 |
9.36 |
14.78 |
3.37 |
to 2019 |
11.78 |
17.87 |
2.84 |
|
to 2023 |
10.78 |
15.85 |
3.25 |
|
| >50% |
to 2015 |
10.5 |
18.26 |
1.92 |
to 2019 |
9.77 |
14.98 |
2.13 |
|
to 2023 |
9.15 |
14.21 |
1.63 |
Indication of decrease |
strong decrease |
weak decrease |
stable |
weak increase |
strong increase |
Total increase |
|---|---|---|---|---|---|---|
% of stations |
<-5 |
-5 to -1 |
-1 to +1 |
+1 to +5 |
>+5 |
Total |
Inside NVZ |
10.38 |
16.94 |
48.09 |
18.58 |
6.01 |
100 |
% of stations Outside NVZ |
4.10 |
14.75 |
61.48 |
14.75 |
4.92 |
100 |
% of stations Total |
7.87 |
16.07 |
53.44 |
17.05 |
5.57 |
100 |
2.3 Surface waters
2.3.1 Surface water monitoring network: nitrates
The total number of surface water monitoring stations monitored for the purpose of the Nitrates Directive for 2020-23 was 225. For comparison, the total in 2016-19 was 228.
Many of the Nitrates Directive stations are also monitored for Water Framework Directive purposes.
2.3.2 Nitrate concentrations in surface waters: rivers
As table 2.6 shows over 93% of rivers in Scotland have annual average levels of less than 25 mg NO3/l, with 81% less than 10 mg NO3/l . These figures generally confirm the continuing good condition of Scotland's surface waters.
% of stations Nitrate concentrations (mg/l NO3) |
0 - 1.99 |
2 - 9.99 |
10 - 24.99 |
25 - 37.5 |
37.5 - 50 |
>50 |
Total |
|---|---|---|---|---|---|---|---|
Inside NVZ |
15.38 |
30.77 |
28.85 |
25.00 |
0.58 |
0 |
100 |
Outside NVZ |
55.49 |
36.42 |
7.51 |
0 |
0 |
0 |
100 |
All |
46.22 |
35.11 |
12.44 |
5.78 |
0.44 |
0 |
100 |
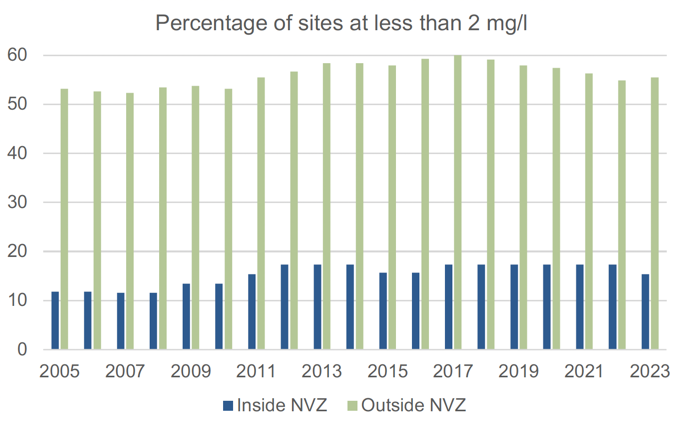
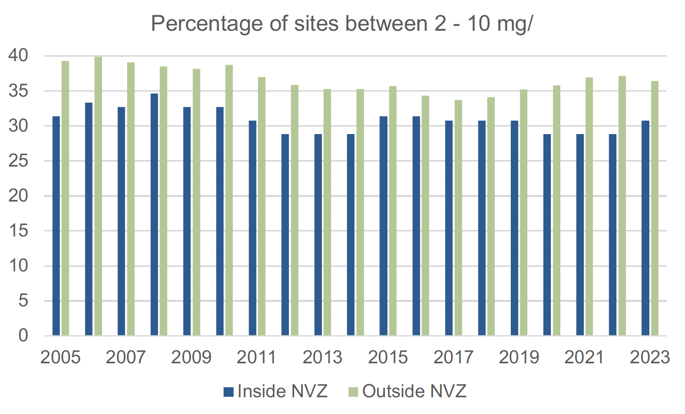
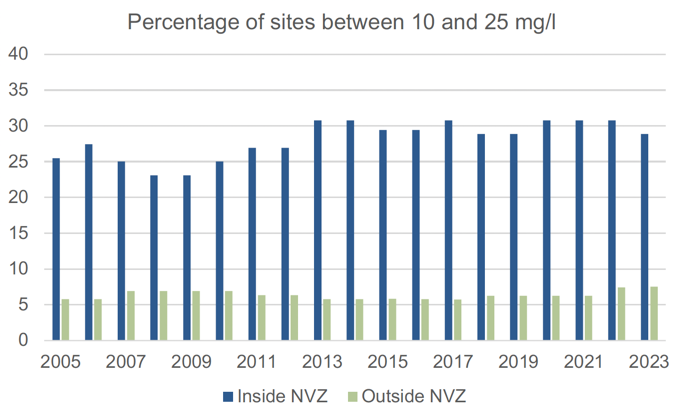
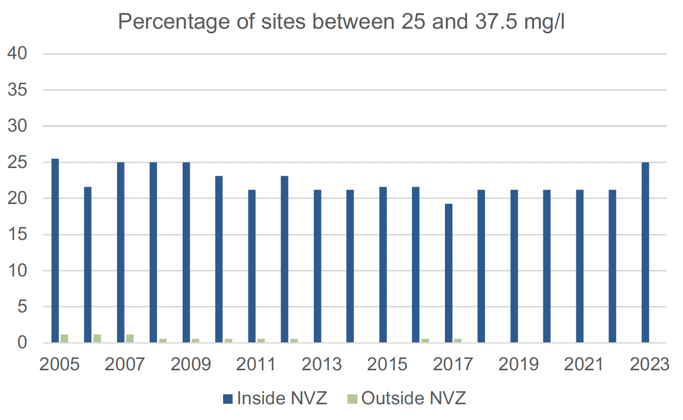
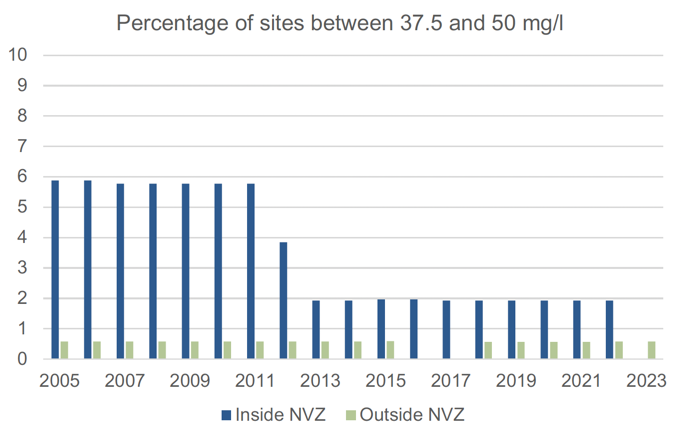
Tables 2.7 and 2.8, and Figure 2.5 provide further details of nitrate concentrations in surface waters. These broadly show that the general good condition of surface waters has been maintained across recent years and reporting periods.
Percentage |
Reporting period |
All |
Inside NVZ |
Outside NVZ |
|---|---|---|---|---|
%<2 |
to 2015 |
48.20 |
15.69 |
57.89 |
to 2019 |
48.68 |
17.31 |
57.95 |
|
to 2023 |
46.22 |
15.38 |
55.49 |
|
%2-10 |
to 2015 |
34.68 |
31.37 |
35.67 |
to 2019 |
34.21 |
30.77 |
35.23 |
|
to 2023 |
35.11 |
30.77 |
36.42 |
|
%10-25 |
to 2015 |
11.26 |
29.41 |
5.85 |
to 2019 |
11.40 |
28.85 |
6.25 |
|
to 2023 |
12.44 |
28.85 |
7.51 |
|
%25-37.5 |
to 2015 |
4.95 |
21.57 |
0.00 |
to 2019 |
4.82 |
21.15 |
0.00 |
|
to 2023 |
5.78 |
25.00 |
0.00 |
|
%37.5-50 |
to 2015 |
0.90 |
1.96 |
0.58 |
to 2019 |
0.88 |
1.92 |
0.57 |
|
to 2023 |
0.44 |
0.00 |
0.58 |
Indication of change |
strong decrease |
weak decrease |
stable |
weak increase |
strong increase |
N/A |
|---|---|---|---|---|---|---|
% of stations |
<-5 |
-5 to -1 |
-1 to +1 |
+1 to +5 |
>+5 |
Total |
Inside NVZ |
0 |
7.69 |
84.62 |
7.69 |
0 |
100 |
Outside NVZ |
0 |
0.58 |
93.06 |
6.36 |
0 |
100 |
Total |
0 |
2.22 |
91.11 |
6.67 |
0 |
100 |
(a)
(b)
(c)
(d)
(e)
No surface water locations have a six-year average greater than 50mg/l.
(f)
Figure 2.5 – Percentage of surface water sites inside and outside of NVZs for nitrate thresholds of: (a) <2mg/l, (b) 2–10mg/l, (c) 10-25mg/l, (d) 25 – 37.5 mg/l, (e) 37.5-50mg/l, (f) >50mg/l.
2.3.3 Nitrate concentrations in surface waters: transitional, coastal and marine
From 2007 to 2019, transitional and coastal waters have been monitored for Dissolved Inorganic Nitrogen (DIN) to assess compliance with the Water Framework Directive standards. These standards are designed to assess the increase in DIN above a natural background concentration and the Good/Moderate boundary represents an increase of 50% above background. Nitrate is the main form of inorganic nitrogen in transitional and coastal waters.
% of stations Nitrate concentrations (mg/l NO3) |
0 - 1.99 |
2 - 9.99 |
10 - 24.99 |
25 - 39.99 |
40 - 50 |
>50 |
Total |
|---|---|---|---|---|---|---|---|
Annual average |
40% |
60 % |
0% |
0% |
0% |
0% |
100% |
Winter average |
40% |
60% |
0% |
0% |
0% |
0% |
100% |
Maximum |
10% |
66.70% |
20% |
3.30% |
0% |
0% |
100% |
Contact
Email: waterenvironment@gov.scot
There is a problem
Thanks for your feedback