Litter and flytipping offences - enforcement review: final report
We commissioned this research report in 2022 and it was completed by Anthesis in autumn 2023. This project aimed to review the current enforcement model in Scotland and offer recommendations to strengthen that enforcement.
Appendix 2 – Litter trends
The Local Environmental Audit and Management System (LEAMS) audits and collects information on litter types and source.
The 2021/22 LEAMS audit[194] found:
- The number of locations with unacceptable[195] amounts of litter has increased on the previous year.
- Environmental quality issues tend to be in urban areas.
- High density residential areas often have the highest frequency of unacceptable litter levels.
- Strategic roads are the least likely to be completely free from litter.
- The most deprived areas continue to have higher litter levels than less deprived areas and the gap is widening.
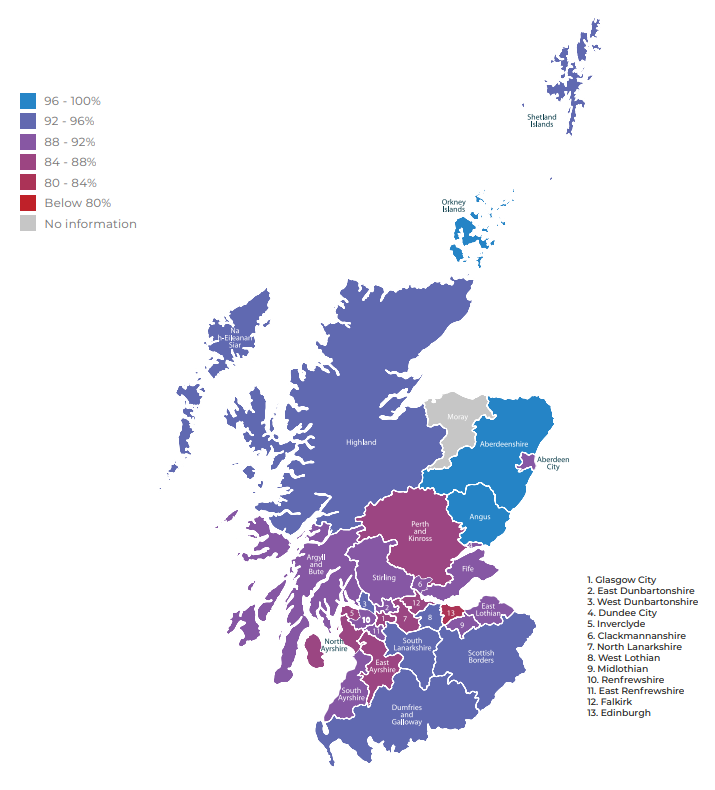
While the overall number of locations with unacceptable amounts of litter has increased on the previous year there are geographic variations across Scotland. More urban authorities with higher populations score lower on average for street cleanliness that those which are more rural or mixed urban and rural (Figure 16 Range of street cleanliness (%) in Scotland. National Cleanliness Benchmarking Report 2021-22 shared by KSB as part of this project.). The data presented in Figure 16 Range of street cleanliness (%) in Scotland. National Cleanliness Benchmarking Report 2021-22 shared by KSB as part of this project.is also displayed in
Table 10 Range of street cleanliness (%) in Scotland. National Cleanliness Benchmarking Report 2021-22 shared by KSB as part of this project.
Tourism may also have a role to play, with councils such as Edinburgh, who have high levels of tourism in concentrated urban areas, having a lower level of cleanliness. Areas of multiple deprivation also generally see a lower cleanliness score, with more than four out of five people living in Scotland’s poorest neighbourhoods saying they often see rubbish in their streets and public spaces[196]. While litter is clearly a result of behaviour it is also closely linked to social and economic circumstances.
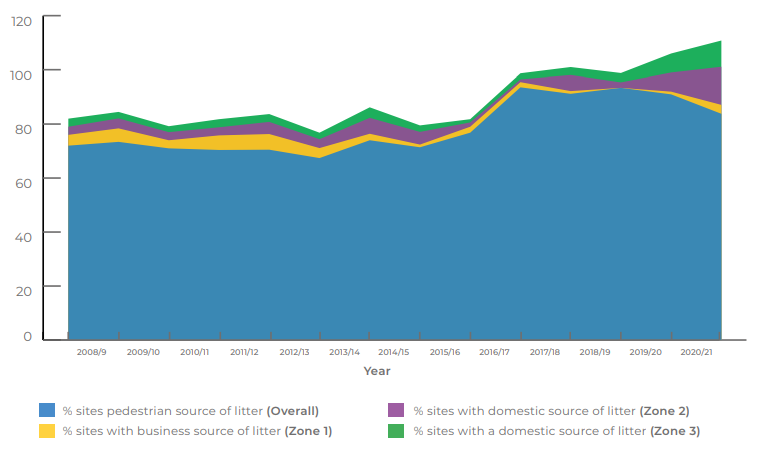
Data collected via LEAMS shows that the main cause of litter is the public. Figure 17 Litter source statistics (%) since 2008/09. National Cleanliness Benchmarking Report 2021-22 shared by KSB as part of this project. shows that the highest proportion of litter found in survey areas is from pedestrian sources. Other sources include businesses (in town/city centre areas – zone 1), domestic waste from high density residential areas (zone 2) and low-density residential areas (zone 3).
Region |
Street cleanliness |
|---|---|
Aberdeenshire, Angus, Orkney Islands |
96 - 100% |
Highland, Comhairle nan Eilean Siar, Shetland Islands, West Lothian, South Lanarkshire, Dumfries and Galloway, Scottish Border, West Dunbartonshire |
92 – 96% |
Argyll and Bute, Stirling, Clackmannanshire, Fife, East Lothian, Midlothian, East Dunbartonshire, Renfrewshire, East Renfrewshire, South Ayrshire, Dundee, Aberdeen |
88 – 92% |
Perth and Kinross, North Lanarkshire, Falkirk, Glasgow City, Inverclyde, North Ayrshire, East Ayrshire |
84 – 88% |
Edinburgh |
80 – 84% |
No local authorities |
Below 80% |
Moray |
No information |
Contact
Email: nlfs@gov.scot
There is a problem
Thanks for your feedback