Local child poverty action reports: year 4 review - 2021 to 2022
This research publication summarises key trends and actions undertaken by local areas to reduce child poverty over the period April 2021 to March 2022 so that key learnings can be shared and lessons learned.
Use of data and evidence
Key findings
- Data use is varied and most often employed to demonstrate knowledge of child poverty within a given area.
- While some reports used data to identify local needs and decide on priorities this was not the case throughout.
- When an evidence based approach was taken, this was often focused on individual policy areas or particular actions rather than guiding the strategic approach to tackling child poverty in the local area.
- Data is being used to target actions at specific groups most at risk of poverty, including in many cases the six priority families. However, this does not appear to be happening consistently and the type of data used and approach employed for targeting purposes is not always clear.
- There were some good examples of data being used for monitoring and evaluation. Some local areas used monitoring information to assess the effective delivery of their actions. Great examples of evaluation efforts included not only an assessment of process delivery, but also of the reach and impact of actions.
Introduction
This section explores how data is presented in the LCPARs and the ways in which data and evidence are being used by local authorities and health boards to understand child poverty in their area, identify local needs and priorities, inform actions, and monitor and evaluate the impact of interventions.
Presentation of data in reports
Across the reports data was used to describe the state of child poverty in local areas. Data sources varied depending on local capabilities and resources. They included, but were not limited to, SIMD data on local deprivation, the number of living wage employers and the number of people claiming council tax reductions.
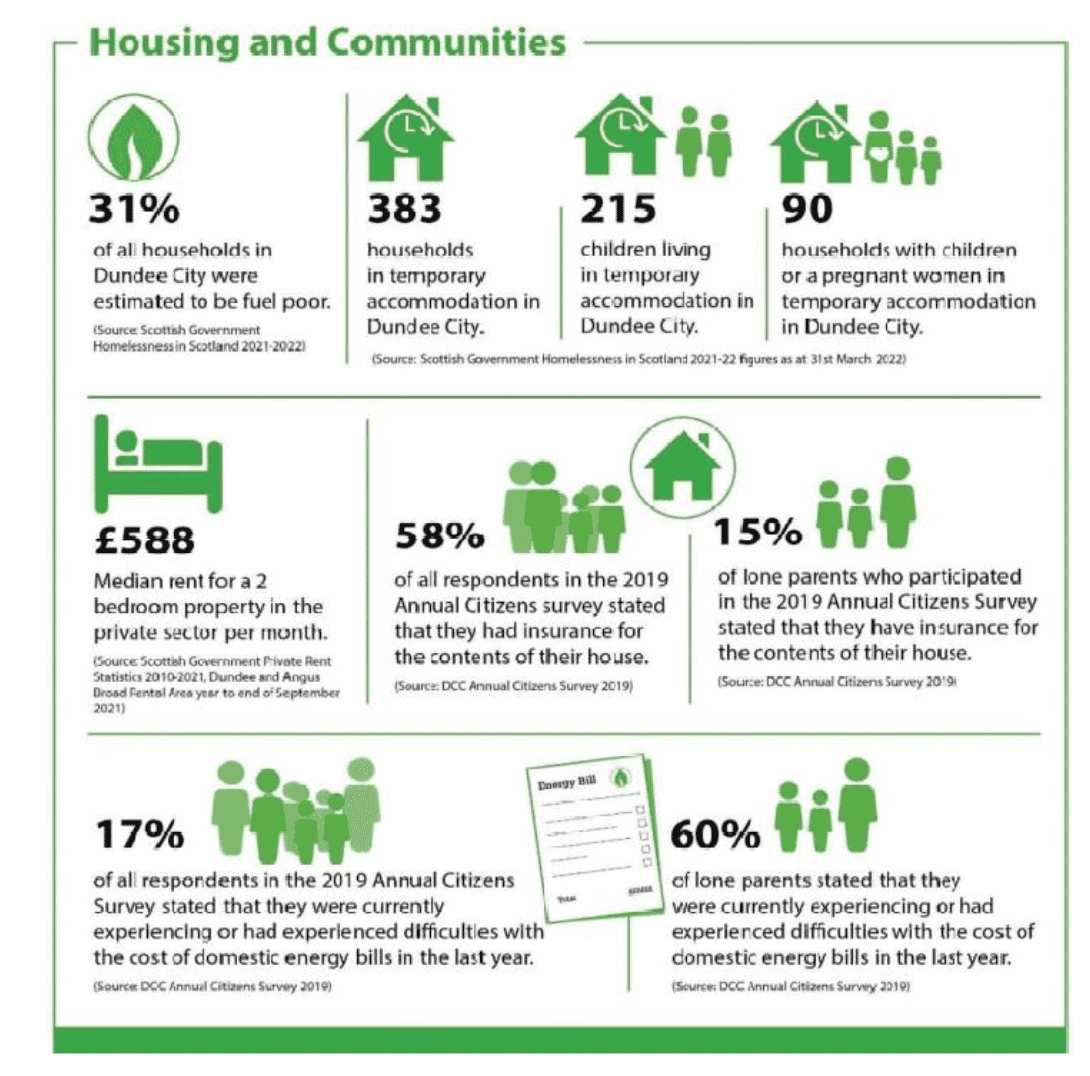
Data and evidence were used differently across local areas. Whilst all areas included data to describe the picture of child poverty in their area, there was less consistent use of data in a strategic way to inform and improve local actions. Presentation of data was a frequent way of demonstrating knowledge of child poverty and the drivers of poverty in local areas. Several reports provided graphic snapshots of important statistics on poverty, the three drivers, and/or target groups. Orkney, for example, provided estimates of the number of families in poverty, relative poverty rates, and data on fuel and food poverty. Dundee's report mixed local-level data with statistics for the six priority families and across poverty drivers. Data from the SIMD and from other governmental and third-sector sources were also included, giving a well-rounded picture of poverty in that local area. Glasgow, too, chose to present some very localized data, notably on the uptake of Housing Benefit and its Council Tax Reduction scheme.
Use of data to identify local needs and select priorities
The presentation of data is an opportunity for local areas to explain and describe child poverty in their area. However, fewer reports demonstrated use of local data in a strategic way to identify local needs and priorities.
Generally, where data was used to identify local need this was in the context of individual actions. Data would be used for example, to identify people who may benefit from a particular service and then to target support at these groups. For example, in Glasgow there was evidence that particular groups were being targeted in the list of actions taken over 2021/22. This included priority family groups and other groups identified as being particularly vulnerable. Across most local areas, where detail was given on the evidence and rationale for taking particular actions, this tended to involve consultations with stakeholders. However, it was not clear how wider data analysis and evidence gathering was being used to inform actions.
Nevertheless, there are some examples where a more strategic use of data to identify local priorities occurred. Falkirk, for example, collated data from across their local partners and used it to identify the groups they wanted to target in their actions over the year. In Orkney, a survey was used among service users titled "Making Ends Meet", which explored the respondents' ability to provide for themselves, use of services and their experience of poverty. The data collected through the survey was intended to evidence areas of particular need, though no specific examples were given and little information was provided on how the results of these surveys and other forms of data collection would be used practically. Including this information in the reports should be considered for upcoming years. There was some evidence of local areas using evidence to target actions towards priority groups, however again evidence on this was limited and it was not always clear to what extent and how this was happening across all actions in a local area.
Use of evidence on what works (and does not work) to inform actions to address local priorities
Reports rarely include evidence on what works (and does not work) to inform actions to address local priorities.
As discussed above, data-driven local knowledge and consultations with local partners and those with lived experience is useful in identifying local issues and priorities. However, where possible, once these issues have been identified evidence-based recommendations should be used to select actions which will be impactful in these priority areas. While this may be happening through different mechanisms, it was unclear from LCPARs if or how evidence on 'what works' is being employed.
Use of evidence for monitoring and evaluation
Some local areas also used data and evidence to evaluate and learn from key policies and actions. Generally, evaluation carried out was qualitative and involved speaking to service users and key stakeholders. Glasgow City Council commissioned research from the University of Glasgow on the effectiveness of their Financial Inclusion Support Officer programme. This consisted of qualitative interviews with people using the service and review of monitoring data which were collated into a report delivered back to the local authority. This evaluation was then used to engage with the Scottish Government, Glasgow City Council and NHS collectively action needed to remove the barriers faced by families accessing services. Though details of how evaluation findings have influenced decision making and further action were not provided.
West Dunbartonshire ran "lived experience" sessions with users of their "Alternatives" drug use prevention service. This took the form of a survey asking respondents to rank out of ten, with one being complete disagreement and ten being complete agreement, how much they agreed with three statements on the ease of accessing benefits, the cost of living and comfortability with income levels. The results were collated and distributed throughout the council departments and its partners responsible for delivering key services. While not stated explicitly in the report, this a simple but effective way that West Dunbartonshire are both collating information that can be used for targeting of services and measuring the effectiveness of already existing services.
Where evaluation is being carried out this is happening through consultation with those already in touch with services. Some voices are therefore not represented in the data. This would include people who are eligible for but are not claiming certain benefits or using services provided. Orkney noted this restriction in their report, writing that the small sample reached via foodbank use and the research they carried out had significant population gaps. In this particular survey no person under the age of 25 and no person over the age of 65 responded to their survey. This results in, for example, the exclusion from the data of the priority group of 'young mothers', defined as those under 25 years of age.
Some local areas are using monitoring frameworks to track indicators relevant to child poverty. For example, East Renfrewshire have a set of local indicators across employment, social security and costs of living which have been tracked since year two of the reporting period. This includes indicators such as number of living wage employers, free school meal uptake, access to financial wellbeing advice and uptake of funded early learning and childcare entitlement, among others. A written description of the trend for each indicator is also provided. Inverclyde have a similar measurement framework with local indicators across the three drivers of poverty and for different child poverty measures. The indicators are useful to track progress at a local population level.
However, there were no examples of local areas quantitatively measuring the impacts of specific actions on child poverty outcomes. Efforts to expand this could explore the use of administrative data to track outcomes for those treated and the wider population. On the qualitative data side, engagement with those who do not to access or take up support would provide insights on who is not being reached and why.
Conclusion
Data use was varied across local areas. Most frequently, data was being used to describe child poverty in a local area, including to improve understanding of the scale and challenge of child poverty and its drivers.
Data does not seem to be used consistently to identify local needs and priorities. In some cases local data was being used to identify target families and groups for particular services. However, at a more strategic level there were fewer examples where data had been used to shape approaches and identify priority areas.
No reports showed existing evidence of what works (or does not work) being used to design evidence based actions locally.
Data was being used to monitor actions taken, although often monitoring data was focused on the scale and reach of services rather than on capturing evidence to measure the impact of actions. Evaluation activity tended to be qualitative and involved working with families experiencing support and staff delivering support to families.
Contact
Email: socialresearch@gov.scot
There is a problem
Thanks for your feedback