Justice and safer communities statistics: monthly data report summary - October 2024
Summary statistics covering a number of important justice and safer communities areas. It is published with up to date statistics every month.
Community Safety
Summary statistics on community safety
Improved public perception of local crime rate since 2008-09. The public feel safer in their local communities. The SCJS found that, in 2021-22, 76% of adults thought that the local crime rate had stayed the same or reduced in the past two years. This shows an improvement from 69% in 2008-09 and 73% in 2019-20.
Most adults feel safe walking alone after dark. The SCJS found that over three-quarters (76%) of adults said that they felt very or fairly safe walking alone in their neighbourhood after dark in 2021-22, unchanged from 2019-20 but an increase from 66% in 2008-09.
Just under half of adults say police are doing a good or excellent job. The SCJS reported that, in 2021-22, 49% of adults said that the police in their local area were doing a good or excellent job, down from 55% in 2019-20 and 61% in 2012-13.
Sharp fall in emergency hospital admissions due to assault since 2013-14. In 2022-23, there were 1,600 emergency hospital admissions due to assault, including 405 due to assault with a sharp object. These were, respectively, 48% and 31% lower than in 2013-14.
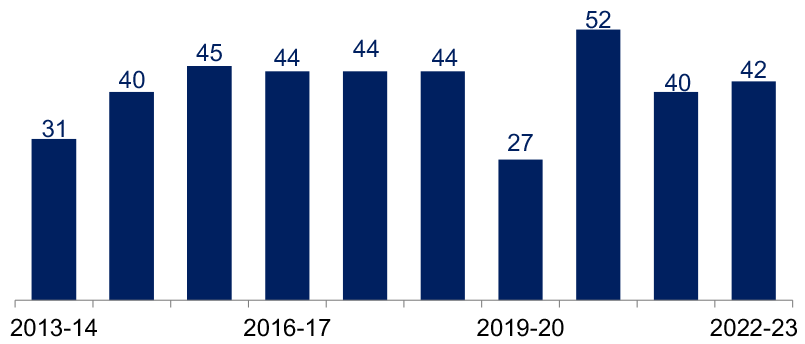
Number of fires fell 3% in the last year. In 2022-23, there were 26,825 fires in Scotland, down 3% on 2021-22 but 7% higher than in 2020-21. There were 42 fire fatalities in 2022-23, up from 40 in 2021-22 but similar to the number in most years across the last decade.

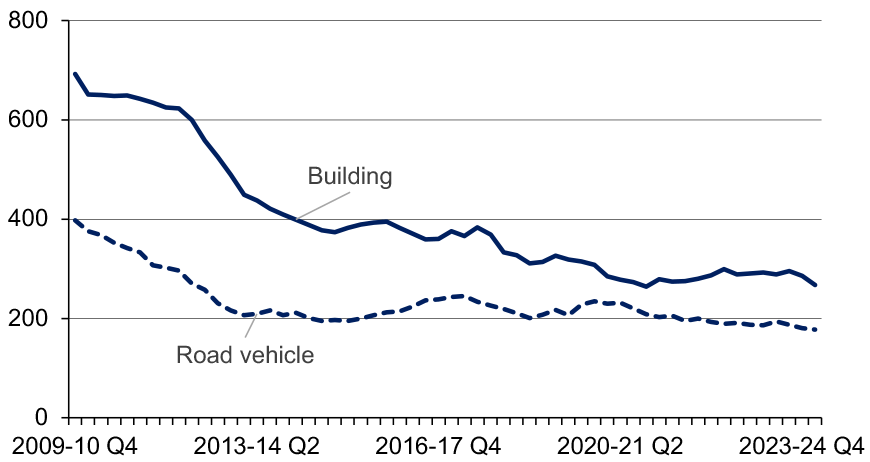
* New * Number of deliberate fires has decreased. There were 300 deliberate building fires in quarter 1 of 2024-25, down from 375 in the same quarter of 2023-24. Over the same period, the number of deliberate road vehicle fires fell from 182 to 170. There has been a long-term downward trend in deliberate building and deliberate road vehicle fires since this series began.

Note: The figures used in this chart are the average of the quarter in question and the three quarters prior, in order to allow for seasonal variation.
* New * Unwanted fire alarm signals made up 16% of incidents in the first quarter of 2024-25. Unwanted fire alarm signals (UFAS) describe avoidable false alarm signals from a workplace, either from an automatic fire alarm or from a person. There were 2,943 UFAS incidents in quarter 1 of 2024-25, which made up 16% of all incidents attended in that quarter. This is down from the same quarter of 2023-24 when UFAS made up 27% of all incidents. This decrease is attributed to the Scottish Fire and Rescue Service’s new policy regarding UFAS incidents, which outlines a change in how automatic fire alarm call outs are managed.
Contact
Email: justice_analysts@gov.scot
There is a problem
Thanks for your feedback