Offshore Wind Sustained Observation Programme (OW-SOP): scoping report
Physical processes are important as they influence the productivity of the phytoplankton which form the base of the entire North Sea ecosystem. This project recommends approaches to assess the potential impact of offshore wind farms on physical processes.
Appendix A. Supporting material (chapter 1)
i. Overview of the offshore wind development landscape in the North Sea
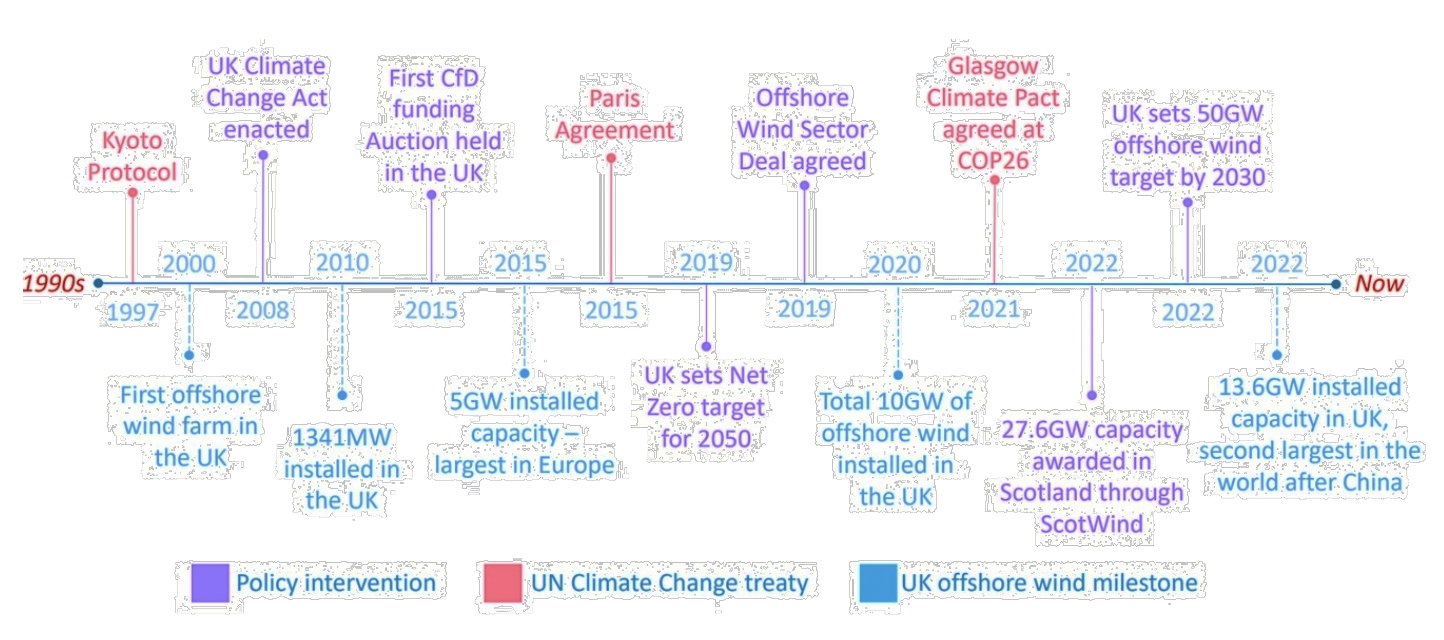
The UK offshore wind (OW) development landscape can be summarised in terms of key policies and steps of implementation (Figure A. 1). Important dates within this development landscapes and related events are also presented in Table A. 1.
 UK, from the 1990s until now."/>
Until 2017, Scottish offshore sites were leased by The Crown Estate (Rounds 1, 2 and 3), at the time a UK-wide body. The management of OW rights were devolved by the UK Government to Scotland in 2017 (Scotland Act 2016 and a secondary legislation approved in 2017) with the creation of the Crown Estate Scotland (CES) and the ensuing round of OW leasing in Scottish waters (ScotWind).
The Scottish Government, as planning authority for Scottish waters, developed the Sectoral Marine Plan (SMP) for OW energy to inform the spatial development of ScotWind (Scottish Government, 2020). This plan, adopted in October 2020, identified sustainable options for future commercial scale OW developments. The plan is currently undergoing a review, as part of the Iterative Plan Review (IPR) process, to ensure the plan remains reflective of current scientific understanding and knowledge, as well as the wider regulatory and policy context.
| Year | Event |
|---|---|
| 2000 |
|
| 2003 |
|
| 2007 |
|
| 2008 |
|
| 2009 |
|
| 2010 |
|
| 2012 |
|
| 2013 |
|
| 2017 |
|
| 2018 |
|
| 2019 |
|
| 2020 |
|
| 2021 |
|
| 2022 |
|
| 2023 |
|
ScotWind
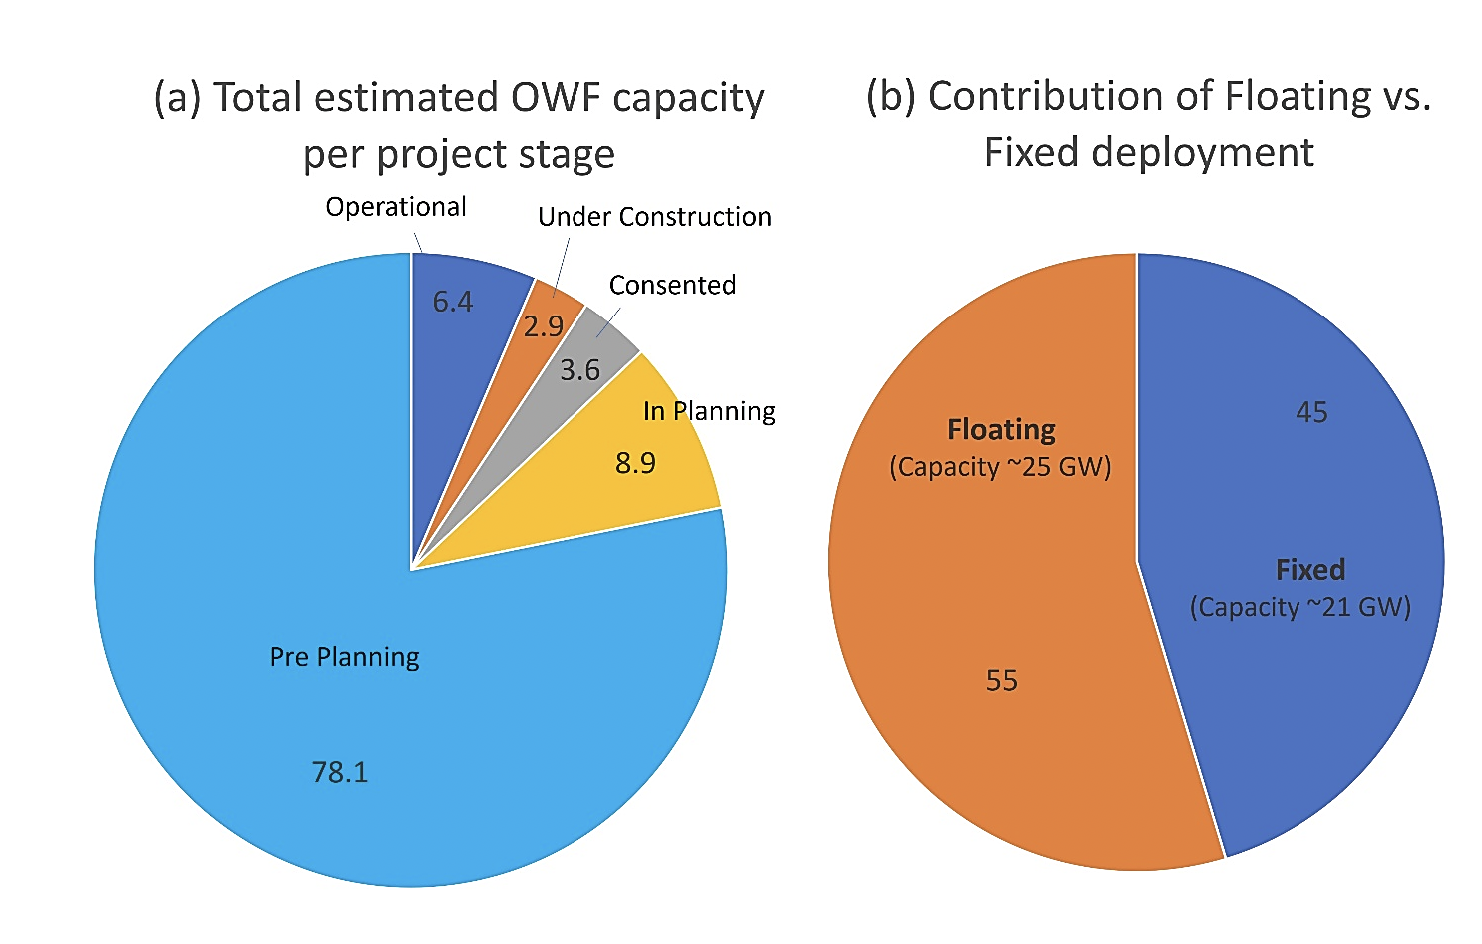
ScotWind applications opened in January 2021, with water depths suitable for bottom-fixed and FLOW (Table A. 2). The outcome of the ScotWind leasing round from CES was announced on the 17 January 2022, with 25 GW being spread across 17 projects. The additional Clearing Round, announced on 22 August 2022, added a further three projects totalling 2.8 GW and with additional developer capacity being added to ScotWind this has raised the final round total to 27.6 GW (Offshore Wind Scotland, 2023) (Table A. 2).
Before ScotWind, UK OW developments have almost all been in shallow waters (10 – 60 m), with the majority of these being in waters off the east coast of England. Instead, many (13) of ScotWind developments are anticipated to use floating turbines, allowing increasing access in deeper waters, which are also the windiest areas. FLOW is seen as presenting significant opportunities for Scotland and the UK. Globally, it is estimated that about 80% of the technical OW resource sit at depths > 60 m and thus more suitable to FLOW.
The National Grid Future Energy Scenarios (FES) work suggests there is potential for more OW in Scotland beyond ScotWind, and there will be a need for more electricity supply as the heat and transport sectors decarbonise. The uncertain nature of future demand, the readiness of the electricity network and the contracting mechanism mean that the timing and nature of further leasing rounds are difficult to predict (Future Energy Scenarios, 2023).
INnovation & Targeted Oil and Gas (INTOG)
INnovation & Targeted Oil and Gas (INTOG) was launched as a new leasing opportunity for OWFs to help maximise value from commercial scale deployment and to reduce the carbon emissions associated with North Sea O&G production. The programme has two distinct elements:
i. Innovation (IN) which is for small scale innovation projects of 100 MW or less, and
ii. Targeted Oil and Gas (TOG) which is specifically designed for OWFs which target the electrification of O&G installations.
On 24 March 2023, it was announced that 13 projects of the 19 applications - five for IN and eight for TOG - had been offered Exclusivity Agreements (Table A. 1). CES will offer a seabed lease of 50 years for TOG projects and 25 years for IN projects. Exclusivity Agreements will cover projects with a proposed capacity of up to 499 MW for IN and 5 GW for TOG (Table A. 2).
Projects will now go through planning, consenting, and financing stages.
| (a) Lease description | Developer(s) | Project stage | Type | Capacity |
|---|---|---|---|---|
| Robin Rigg (East and West) | RWE Renewables UK | Operational | Fixed | 0.17 GW |
| Methil Demo | ORE Catapult Ltd | Operational | Fixed | 0.01 GW |
| Beatrice OWF | SSE Renewables/RED Rock Power | Operational | Fixed | 0.6 GW |
| Aberdeen Bay | Vattenfall | Operational | Fixed | 0.1 GW |
| Buchan Deep (Hywind) Demo | Equinor | Operational | Floating | 0.03 GW |
| Kincardine | Kincardine Offshore WF (KOWL) | Operational | Floating | 0.05 GW |
| Moray (East) | Ocean Winds | Operational | Fixed | 1 GW |
| Seagreen Phase 1 | SSE Renewables / TotalEnergies | Operational | Fixed | 1.1 GW |
| Total generating capacity: 3 GW | ||||
| (b) Lease description | Developer(s) | Project stage | Type | Capacity |
| Neart Na Gaoithe (NnG) | EDF Renewables / ESB | Under Construction | Fixed | 0.4 GW |
| Morray West | Ocean Winds | Under Construction | Fixed | 0.9 GW |
| Total expected capacity: 1.3 GW | ||||
| (c) Lease description | Developer(s) | Project stage | Type | Capacity |
| Inch Cape | RED Rock Power | Consented | Fixed | 1.1 GW |
| Forthwind Methil Demo | Ciero | Consented | Fixed | 0.01 GW |
| Seagreen 1A | SSE Renewables / TotalEnergies | Consented | Fixed | 0.4 GW |
| Pentland | CIP | Consented | Floating | 0.1 |
| Total expected capacity: 1.6 GW | ||||
| (d) Lease description | Developer(s) | Project stage | Type | Capacity |
| Berwick Bank | SSE Renewables | In Planning | Fixed | 2.3 GW |
| Marr Bank | SSE Renewables | In Planning | Fixed | 1.8 GW |
| Total expected capacity: 4.1 GW | ||||
| (e) Lease description | Developer(s) | Project stage | Type | Capacity |
| Muir Mhor | Vattenfall / Freed Olsen Renewables | Pre-Planning | Floating | 0.8 GW |
| Stoura (Shetland) | ESB Asset Management | Pre-Planning | Floating | 0.5 GW |
| Ocean Wind (Shetland) | Mainstream RP / Ocean Winds | Pre-Planning | Floating | 0.5 GW |
| Bowdun | Thistle Wind Partners | Pre-Planning | Fixed | 1 GW |
| Ossian | SSE Renewables / CIP / Marubeni | Pre-Planning | Floating | 3.6 GW |
| Buchan | Floating Energy Alliance | Pre-Planning | Floating | 1 GW |
| Stromar | Orsted / BlueFloat Energy / Renantis Partnership | Pre-Planning | Floating | 1 GW |
| Broadshore | BlueFloat Energy / Renantis Partnership | Pre-Planning | Floating | 0.9 GW |
| Bellrock | BlueFloat Energy / Renantis Partnership | Pre-Planning | Floating | 1.2 GW |
| Marram Wind | Scottish Power Renewables / Shell | Pre-Planning | Floating | 3 GW |
| Machair Wind | Scottish Power Renewables | Pre-Planning | Fixed | 2 GW |
| Campion | Scottish Power Renewables / Shell | Pre-Planning | Floating | 2 GW |
| Ayre | Thistle Wind Partners | Pre-Planning | Floating | 1 GW |
| Spiorad na Mara | Northland Power | Pre-Planning | Fixed | 0.9 GW |
| Tallisk | Magnora Offshore Wind | Pre-Planning | Floating | 0.5 GW |
| Havbredey | Northland Power | Pre-Planning | Floating | 1.5 GW |
| West of Orkney | RIDG / Corio Generation / TotalEnergies | Pre-Planning | Fixed | 2 GW |
| Caledonia | Ocean Winds | Pre-Planning | Fixed | 2 GW |
| Morven | BP / EnBW | Pre-Planning | Fixed | 2.9 GW |
| Arven | Mainstream RP / Ocean Winds | Pre-Planning | Floating | 2.3 GW |
| IN Sinclair | BlueFloat Energy / Renantis Partnership | Pre-Planning | Floating | 0.1 GW |
| IN Scaraben | BlueFloat Energy / Renantis Partnership | Pre-Planning | Floating | 0.1 GW |
| IN Flora | BP Alternative Energy Investment | Pre-Planning | Floating | 0.05 GW |
| IN Malin | ESB Asset Development | Pre-Planning | Floating | 0.1 GW |
| IN Salamander | Orsted / Simply Blue Group | Pre-Planning | Floating | 0.1 GW |
| TOG Aspen | Cerulean Winds | Pre-Planning | Floating | 1.0 GW |
| TOG Beech | Cerulean Winds | Pre-Planning | Floating | 1.0 GW |
| TOG Cedar | Cerulean Winds | Pre-Planning | Floating | 1.0 GW |
| TOG Culzean Demo | Total Energies | Pre-Planning | Floating | 0.003GW |
| TOG Green Volt | Flotation Energy/Vargrønn | Pre-Planning | Floating | 0.6 GW |
| TOG HE Project | Harbour Energy | Pre-Planning | Floating | 0.02 GW |
| TOG Cenos | Flotation Energy/Vargrønn | Pre-Planning | Floating | 1.4 GW |
| Total expected capacity: 36.5 GW |

ii. Potential future changes to seasonal stratification
Simulations using computer models suggested that there is already a trend towards earlier onset of seasonal stratification (Sharples et al., 2020). Research found this onset occurred 8 days earlier in the western Irish Sea in 1999 compared with 1960. In the north-western North Sea, Sharples et al. (2006) found a weak trend in the earlier onset of stratification between 1991 and 2003 (1 day per year earlier). However, these trends are weak and natural variability in the timing of stratification is relatively large (standard deviation around the mean is ± 7 days). There are no clear trends in the strength of the stratification (both in seasonal warming and freshwater inputs (Sharples et al., 2020).
Climate models predict that the onset of stratification in spring will occur about one week earlier by the end of the century (Sharples et al., 2020). Similarly, projections suggest that, by 2100, breakdown of stratification in autumn will occur 5 - 10 days later than at present. This pattern is based on comparing the recent trends (1961 - 1990) with the projected conditions in future (2070 - 2098) in a business-as-usual scenario (see SRES A1B; Sharples et al., 2020). This pattern is due to the warmer air temperatures, although there is uncertainty as changes in wind patterns (especially the strength) may change stratification. Model projections suggest that the strength of stratification (the density difference between the two layers) will also intensify across the shelf sea regions, which will reduce upward mixing of nutrients and therefore will have an impact on primary productivity of the marine ecosystem (Sharples et al., 2020).
For the northern North Sea, changes in the strength of the exchange with the North Atlantic Oscillation (NAO) are also likely to occur, leading to possibly permanent stratification due to salinity differences in winter and due to temperature differences in summer (Holt et al., 2018; Sharples et al., 2020). Changes in stratification could have an impact on other properties, such as dissolved oxygen concentration due to longer periods of reduced air-sea exchange and productivity from phytoplankton and lower trophic levels due to reduced upward mixing of nutrients from the deeper layer.
Contact
Email: ScotMER@gov.scot
There is a problem
Thanks for your feedback