Offshore Wind Sustained Observation Programme (OW-SOP): scoping report
Physical processes are important as they influence the productivity of the phytoplankton which form the base of the entire North Sea ecosystem. This project recommends approaches to assess the potential impact of offshore wind farms on physical processes.
2 What is changing? Baseline parameters and existing data
In order to assess what the impact may be due to the presence of new infrastructures, there are some key questions that need to be answered:
i. What are the baseline conditions (including climate change) of the system?
ii. What changes are expected?
iii. What are the Essential Ocean Variables (EOVs) needed to detect OWF-induced change and evaluate the scale of resulting impact?
This chapter introduces the prevailing physical properties of the North Sea (Section 2.1) and discusses available data and gaps in our understanding of the system (Section 2.2).
2.1 Prevailing physical properties of the North Sea waters
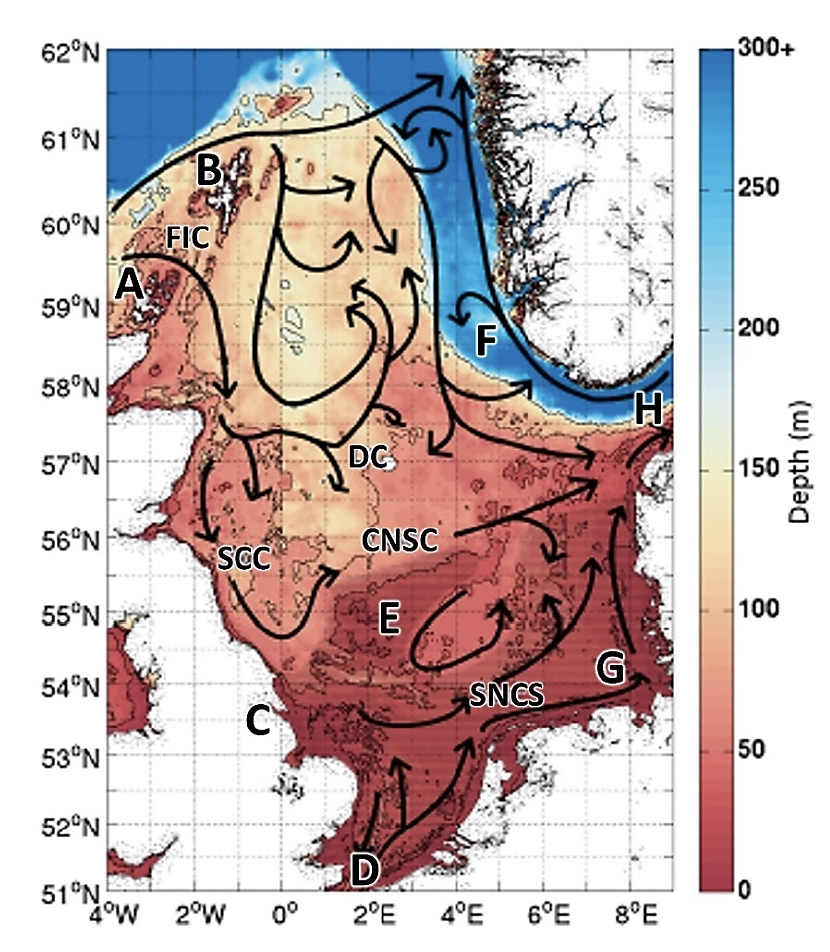
The North Sea is a relatively shallow shelf sea (15-200 m), generally increasing in depth from south to north, with the Dogger Bank separating the North Sea into two regions of different physical and biogeochemical properties, which are driven by regional and local water circulation, tides, etc. (Figure 2.1) (Queste et al., 2016; Otto et al., 1990). Prevailing (historic) physical properties of the North Sea waters, inclusive of climate change effects, are considered here to represent the ‘baseline’ conditions. Baselines are defined, therefore, as the water column properties (inclusive of climate change effects) in absence of OWF infrastructures. The impact of new infrastructure is to be quantified relative to this baseline.

More details about the ‘prevailing physical properties of the North Sea waters’, including water circulation and tidal currents, are presented in Appendix B.
2.1.1 Water column structure
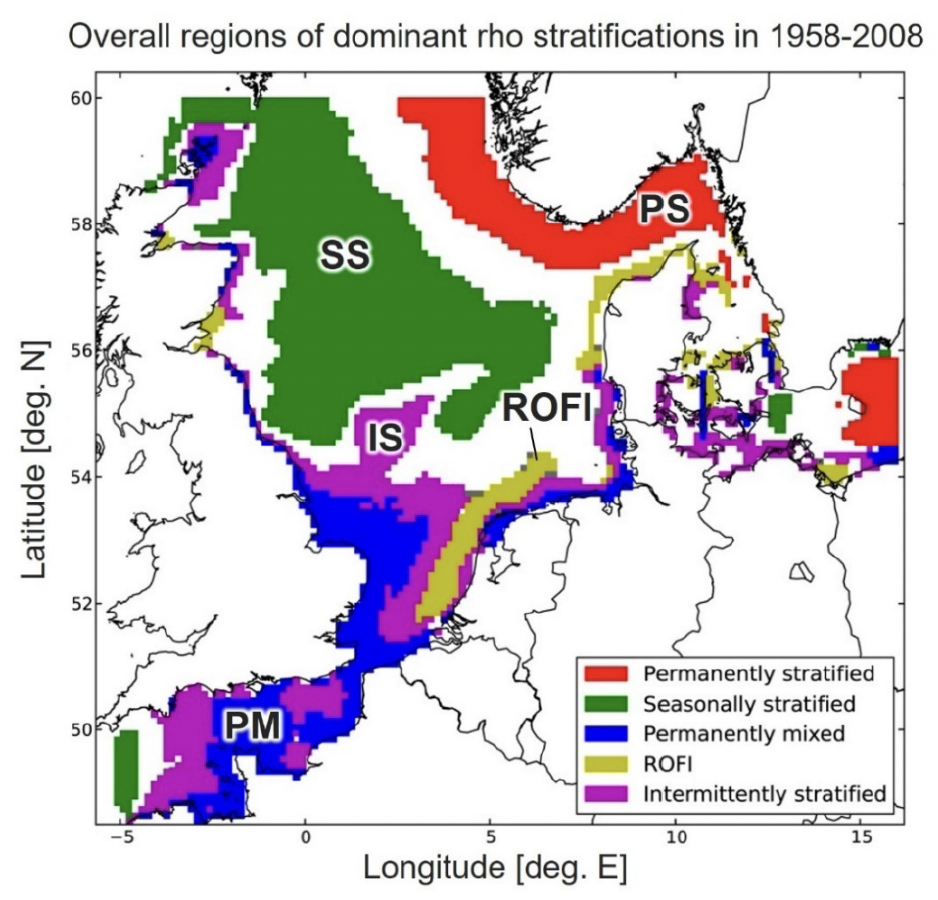
Owing to its shallow depths, much of the water column in the southern half of the North Sea (south of Dogger Bank) is well-mixed throughout the year (Figure 2.1) (Otto et al., 1990). Shallower water requires less energy from the wind and tides, compared to deeper water, to become fully mixed. Van Leeuwen et al. (2015) utilised 51 years of simulation data to identify five stratification regimes in the North Sea (Figure 2.2), however, they failed to classify ~ 30% of the North Sea, especially in the southern part which exhibits interannual variations. North of Dogger Bank (excluding the Norwegian Trench which is permanently stratified) much of the North Sea undergoes seasonal stratification (green areas indicated as SS in Figure 2.2).
Thus, much of the northern North Sea undergoes seasonal thermal (temperature driven) stratification from spring (March/April), when stabilising buoyancy input from solar heating out-competes the mixing from the tides, wind and wave, and a layer of warmer water overlies a layer of cooler water separated by a vertical density gradient driven by temperature (the thermocline; Figure 1.2). In some areas, buoyancy input from freshwater sources contributes to stabilising stratification by reducing the density in the surface mixed layer. In autumn, when solar heating reduces and wind and waves increase, this temperature gradient is broken down and the water column becomes fully mixed again. The thermocline effectively acts as a barrier between surface and bottom waters, limiting the vertical exchange of heat, salt and nutrients between the two layers.

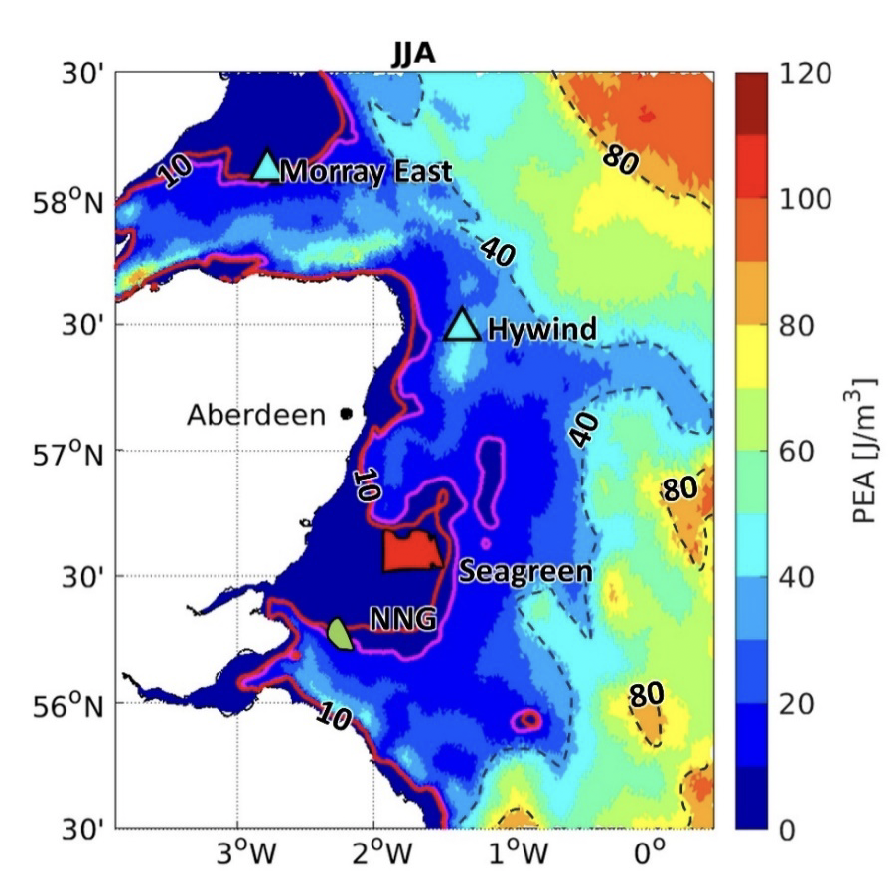
The ‘Potential Energy Anomaly’ (PEA) is a measure of how much energy is needed to fully mix the water column, or how ‘strong’ the stratification is; a PEA value of 0 indicates a mixed water column as no energy is required to mix it. PEA can be used to 'classify' regions according to their vertical structure (PEA map represented in Figure 2.3).

A recent study from Holt et al. (2022) demonstrated that, under projected climate scenarios, the length and strength of seasonal stratification in the North Sea will increase. Therefore, it is also important to understand how OWF infrastructures may interact with climate-driven changes. Baseline physical properties of the water column in complex settings such as the North Sea are affected by seasonal variability (through water stratification), mixing, and changes in meteorological forcing. In order to understand the impact of anthropogenic activity (e.g. energy industry operations), these factors need to be separated from the natural variability of the system. This requires data and models at the appropriate spatial and temporal resolution, in order to provide a robust understanding of physical properties and their change in space and time.
2.2 Existing data on water column baseline and potential gaps
The North Sea is one of the most intensely investigated sea areas in the world (Sündermann & Pohlmann, 2011). Long-term routine monitoring of baseline parameters (e.g. temperature, salinity, dissolved oxygen and chlorophyll) in the North Sea is carried out by a number of European organisations. A number of European data centres such as the British Oceanographic Data Centre (BODC), International Council for the Exploration of the Sea (ICES) and the Marine Environmental Data and Information Network (MEDIN) provide more than 100 years’ worth of environmental data from the North Sea collected by hundreds of organisations.
2.2.1 Parameters indicative of ecosystem pressure
Offshore platforms and marine renewable energy installations were identified in the literature as one of the main potential environmental pressure elements changing the hydrodynamic conditions, though large data sets are required to observe and detect changes in these conditions (see Galparsoro et al., 2022, and references therein). In particular, underwater structures such as foundations and piles may cause turbulent current wakes, which impact circulation, stratification, mixing, and sediment resuspension (Forster, 2018) (see Chapter 3). Consequently, stratification of the water column affects nutrient availability in the euphotic zone indicating potential impact on marine ecosystem processes; however, Daewel et al. (2022) noted that ecosystem impacts are less clear for the following reasons:
i. The changes in nutrient concentration would start a cause-effect chain that translates into changes in primary production and effectively alters the food chain.
ii. In a dynamic system like the North Sea, characterised by strong tidal and residual currents, changes in the biotic and abiotic environment are exposed to advective processes.
iii. The expected changes depend strongly on the prevailing hydrodynamic conditions, which makes it difficult to disentangle natural changes from those due to offshore wind deployments. Changes in the hydrodynamic conditions can have significant and varied effects on marine ecosystems (Shields et al., 2011).
In-situ measurements of salinity and turbidity, combined with remote sensing (Li et al., 2014; Vanhellemont & Ruddick, 2014) and modelling (Cazenave et al., 2016; Lass et al., 2008; Rennau et al., 2012) demonstrated that each turbine can generate an upwelling effect of up to 1 km. This increase in primary production (potentially leading to enhanced nutrient supply to the light, surface layer) can enhance phytoplankton biomass, which provides the base for marine food webs, and thus favour the concentration of pelagic fish.
Enhanced primary production in the surface results in more organic matter being available to be remineralised by bacteria, and some of this organic detritus sinks through the water column into the bottom mixed layer. Bacterial respiration of organic matter in bottom waters results in a net consumption of oxygen (as no oxygen is being produced by phytoplankton due to the low light levels and there is no exchange with the atmosphere) and a remineralisation of nutrients such as nitrate and phosphate. Thus, in stratified waters, bottom oxygen levels will be lower than in the surface mixed layer. In some seasonally stratified shelf seas, bottom mixed layer oxygen concentrations may reach ecologically concerning levels by the end of the stratified period (e.g. Queste et al., 2016; Diaz & Rosenberg, 2008).
Amongst the most relevant monitoring parameters indicative for pressure elements, the ones representing EOVs which allow definition of the strength and duration of stratification (when sampled at the correct location and time), are outlined below (sub-sections 2.2.2 and 2.2.3).
2.2.2 Essential Ocean Variables: temperature, conductivity and depth
Temperature, conductivity and depth are the most confidently sampled oceanographic variables. These variables are commonly measured using a CTD (conductivity, temperature, depth) sensor which is at the highest Technology Readiness Level (TRL; 9-10). The largest amount of baseline data vertically through the water column (i.e. not from remote sensing) in the North Sea is that collected from CTDs. Salinity is derived from measuring the conductivity of seawater and, when combined with measurements of temperature this can be used to calculate the density of seawater. Through vertical profiles of density one can simply derive the potential energy anomaly, which is a measure of how much energy would be required to fully mix the water column, or how stratified the water column is. From the available studies on the potential impact of OWFs on the marine environment, it is evident that the vertical stratification is considered most likely to vary due to the presence of OWFs (via OWFs driven changes to mixing). Any change to stratification resonates through the marine ecosystem, as the position of the pycnocline (the vertical gradient in density) also dictates the location and concentration of phytoplankton. The depth of the pycnocline will dictate the vertical position of the Subsurface Chlorophyll Maximum (SCM) during summer months, which occurs when nutrients have been depleted in the well-lit surface layer following the spring bloom. In summer, phytoplankton biomass becomes concentrated at the pycnocline where phytoplankton can utilise nutrient fluxes from the nutrient rich bottom waters combined with sufficient light levels. The strength, length, and the timing of the onset of stratification, as well the surface mixed layer depth/position of pycnocline are all ecologically important parameters that can be gained from measurements of temperature, salinity and depth performed at the right time and in the right location. It is important to note that there is high horizontal variability in temperature, salinity and depth across the North Sea, as well as high temporal variability in temperature and salinity. Seasonal cycles drive some of the temporal variability, however extreme weather events (e.g. heat waves, storms, rainfall) can also drive periodic changes to temperature and salinity. A monitoring strategy would need to resolve some of these high spatial and temporal variabilities in the immediate vicinity/near-field of OWFs and to increase confidence in modelling tools at measurement locations to enable models to be applied over larger spatial areas, and to underpin longer term model predictions.
2.2.3 Essential Ocean Variables: Chlorophyll biomass
Measurements of chlorophyll biomass can be used to infer the concentration of phytoplankton in the water column. In-situ fluorometers are widely used to estimate chlorophyll-a (Chl-a) biomass as they are at a reasonably high TRL (8-9), low power and easily installed on moorings, ship-based and autonomous platforms. This has resulted in the temporal and spatial resolution of Chl-a measurements in the North Sea being dramatically increased with increasing glider (small autonomous unmanned vehicle, AUV) deployments. Productivity and phytoplankton biomass observations across large spatial scales mainly rely on ocean colour measurements derived from satellites. However, satellite derived ocean colour products do not necessarily penetrate very far through the water column to where much of the production in the North Sea occurs, particularly during summer within the SCM, and thus these data are spatially limited (Weston et al., 2005). Marine Autonomous Systems (MAS) can be used for surface calibration of satellite derived Chl-a. Glider mounted fluorometers can be used to measure phytoplankton abundance throughout the entire water column. Additionally, multiple wavelengths can be used to differentiate between different pigments found within various species of phytoplankton. Furthermore, as these data are available in near real time, glider missions and sampling strategies can be continuously updated.
Despite fluorometers being widely deployed as a standard sensor to measure Chl-a, factory calibrations can differ widely from the natural environment as they are typically based on the Chl-a concentration of one phytoplankton species, when in fact there are many in the natural environment at different times throughout the year. In addition, instrument signals can fluctuate and drift due to power and temperature oscillations. Furthermore, physical damage and biofouling to the sensors can occur during long-term deployments, which has been observed in many North Sea glider deployments (Charlotte Williams, personal comm.). Best practice is typically to carry out in situ calibrations in close proximity to the fluorometer at the beginning and end of deployment, although remote sensing data from satellites can also be used to calibrate the surface fluorometry value. Thus, although easily available, Chl-a fluorometers require more expense to gain accurate data than CTD as they need to be calibrated against discrete water samples.
2.2.4 Data repositories
Although thousands of surveys have been carried out in the North Sea (Appendix B), there is no standard repository for all environmental information. There are individual databases that contain some of the information compiled from consultancy reports. A good example of this is the UK Benthos database (BGS, 2014). Although some data have been deemed commercially important, most data collected are in theory available but difficult to find and access in practice, and therefore fail to meet one or more of the Findability, Accessibility, Interoperability and Reusability (FAIR) data principles (Wilkinson et al., 2016). There have been ongoing efforts to make more commercial data and metadata available, for example through the INSITE Interactive data portal.
More information on ‘existing data on water column baseline and potential gaps’ related to ocean observations generally performed for various purposes and including water column parameters (e.g. CTD/hydrographic data including turbidity; current speeds, direction/tides) and seafloor data are presented in Appendix B. Appendix B also discusses some of the standards for ‘strategic assessment’, ‘current state of the art and adopting future technologies’, and ‘relevant data collection from past and current programmes’.
2.2.5 Data collected to-date on OWF impacts
The reviewed studies show that OWF foundations and structures generate a turbulent wake that contributes to localized vertical mixing which can move nutrients confined to the near bed layer higher up into the water column making it more readily available for primary production (Broström, 2008; Nerge & Lenhart, 2010; Ludewig, 2014) (see Chapter 3). Therefore, the development of large OWFs in areas already sensitive to seasonal low oxygen concentrations (such as Oyster Grounds) may experience further decreases in dissolved oxygen (DO) concentrations in the bottom mixed layer due to accumulation of phytoplankton biomass in the bottom mixed layer. Additionally, enhanced mixing at the seabed will resuspend organic matter within the sediments, making it available for pelagic bacterial respiration, and thus further biological oxygen consumption. Consequently, any changes to mixing and sediment resuspension at the bed resulting from the presence of OWFs may also further impact DO and remineralised nutrient concentrations in the bottom mixed layer.
Regular monitoring and in-situ analyses of the levels of dissolved oxygen (DO), total nitrogen, total phosphorus, and Chl‑a concentration at OWFs provide insight into marine oxygen deficiency problems (Janßen et al., 2015; Qvarfordt et al., 2006).
To effectively protect the marine environment across Europe, the European Union put in place the Marine Strategy Framework Directive (MSFD) in 2008. EU member states are required to take actions and measures in order to achieve and maintain Good Environmental Status (GES) in the marine environment. GES is a qualitative description defined as ‘ecologically diverse and dynamic ocean and seas which are clean, healthy and productive’. The UK Marine Strategy outlines how the UK is currently performing and how GES status can be achieved in the future via a number of existing and planned marine monitoring programmes. In general terms, there are relevant GES quality descriptors, and associated variables, which can be monitored and used to assess the potential environmental impact of OWFs.
Contact
Email: ScotMER@gov.scot
There is a problem
Thanks for your feedback