Soil organic carbon sequestration: scoping study
A report evaluating the ability of existing datasets to answer questions regarding the status of organic carbon in Scottish soils.
5 How much carbon is stored in Scottish soils and where?
Of the datasets listed in Appendix 1, only a few can be used to produce national scale maps of either carbon concentrations or carbon stocks. To do this, these datasets need to have national cover and not be land use specific. One such dataset is the Representative Soil Profiles of Scotland Database held by the James Hutton Institute. This Institute also holds soil spatial (map) data including the National Soil Map of Scotland (Soil Survey of Scotland Staff, 1981) which covers the entire country and the Soil Map of Scotland (partial cover) which covers most of the cultivated land and adjacent uplands (Soil Survey of Scotland Staff, 1970-87).
As both these soil maps show the distribution of the various soil types found in Scotland using the same classification system as used in the Representative Soil Profiles dataset, the soil data can be directly linked to the soil map to show the amount of carbon in Scottish soils and where it occurs.
The Countryside Survey, undertaken by the Centre for Ecology and Hydrology (CEH) in 1978, 1998 and 2007, has also been used to assess how much carbon is stored in Scottish soils and where. Both SOC stocks and SOC concentrations at a depth of 0-15 cm were collected from a number of broad-scale habitats (including arable and horticultural land, improved grassland, various semi-natural grasslands, deciduous woodland, coniferous woodland, heather moorland and peatlands). The concentrations and stocks were then mapped by linking the SOC values with similar habitats in each a 1 km square throughout the country. The maps, therefore, represent carbon stocks and concentrations by habitat types.
5.1 Distribution of soil organic carbon concentrations
Average SOC topsoil concentrations for each of the soil types shown on the National Soil Map of Scotland have been mapped by linking averaged SOC concentrations calculated from the Representative Soil Profiles dataset (with some additional data from the National Soil Inventories, grid and transect samples and some site-specific research samples) to soil map units within a Geographic Information System. The map (Figure 2) of the average topsoil SOC shows the distinctive peaty surface layers of the organo-mineral (soils with an organic surface layer over a mineral subsoil) and peat soils (where the organic surface layer is greater than 50 cm thick) of the hills and uplands as well as lesser SOC concentrations of the mineral soils in the more cultivated lowlands.

The average carbon concentrations at 0-15 cm for the 2007 Countryside survey were mapped on a 1 km grid using a model-based soil parent material and broad habitat type Figure 3). This map reflects land cover and habitats to a greater extent than the soils underlying them.

5.1.1 Limitations in the maps
The National Soil Map of Scotland is based on identifying the soils within specific landforms rather than mapping individual soil types. The number of different soil types within each landform varies from 1 to (in rare and specific cases) 8. This means that in order to map the SOC concentrations, it is generally necessary to select one soil type (generally the most extensive one in the landform unit) to represent the SOC concentration on a map.
This can be overcome with electronic datasets that can be interrogated online (eg Soil Indicators for Scottish Soils (SIfSS) or the Topsoil Organic Matter Tool) where the SOC concentrations of each soil type within the map unit can viewed. As the mapping units on the Soil map of Scotland (partial cover) (Soil Survey of Scotland Staff,1970-1987) mainly comprise only one soil type, the SOC concentrations of each soil type are more easily mapped.
As previously mentioned, some of the data within the Representative Soil Profile database is relatively old and may not be representative of current SOC concentrations but, as already shown, a general correction factor could be applied.
With all national (or regional) scale assessments, it is important to assess the resolution at which the mapping has occurred in order to determine its use in assessing carbon stocks or concentrations across smaller spatial extents. For example, a 1 km gridded data set provides an overview of where highly organic or mineral soils are likely to occur, whereas data based on the partial cover map at 1:25,000 scale could be used to identify areas within a farm that may require specific management, for example areas of peat.
5.2 Distribution of soil organic carbon stocks
There have been many attempts to estimate the quantity of carbon stored in Scottish soils from 1995 where Howard et al. estimated the stock of carbon in the upper 100 cm of Scottish soils to be 19,011 Mt C to more recent estimates by Poggio and Gimona (2014), Aitkenhead and Coull (2016, 2020) and Baggaley et al., 2016. These latter estimates coalesce around 3,000 Mt C (Figure 4). Each of the estimates by Poggio and Gimona (2014), Aitkenhead and Coull (2016, 2020) and Baggaley and Lilly used data from the Representative Soil Profile database and/or the National Soil Inventories of Scotland but used different methods to calculate the stocks (Figure 5).

Briefly, Baggaley & Lilly (2016) used a method similar to that used to map SOC concentrations (Figure 2). They calculated SOC stocks for each soil type based on average SOC concentration, estimates of typical horizon thicknesses, and predicted bulk density (Figure 5 c). A measure of the uncertainty (shown as error bars in Figure 4) was calculated based on the range in the measured soil carbon and the uncertainty from using a predicted bulk density. The average stock, and associated uncertainty, was then calculated for each soil map unit taking land cover into account and mapped using the National Soil Map combined with a national land cover map.
Poggio & Gimona (2014) and Aitkenhead & Coull (2016,2020) used approaches based on statistical relationships between calculated carbon stocks and different combinations of the key soil forming factors, such as topography, land cover, vegetation information from remote sensing, climate and parent material (Figure 5 a and b). Both methods made use of the National Soil Inventory of Scotland (NSIS 2007-9) data and Poggio & Gimona added measured carbon stocks from 19,500 soil horizons (layers) held within the Scottish Soils Database. While Poggio & Gimona mapped the SOC stocks to 100 cm depth for each 1 km2 throughout Scotland (excluding Shetland due to the lack of satellite derived land cover data), Aitkenhead & Coull mapped the stocks for each 100 m grid cell.
All these methods have inherent uncertainty as they all rely on models and relationships between various soil properties such as landscape characteristics, but they all give similar values. Appendix 2 outlines where the various statistical uncertainty in the estimates lie.
Maps at this scale or resolution are not suited to managing stocks at a farm level; the Poggio & Gimona map is too crude a resolution, while the Baggaley & Lilly map averages the stocks over the different soil types within the map unit as does Aitkenhead & Coull. Instead, they are designed to give an overview of where the stocks are greatest or least and to give baseline estimates of current national stocks.
Better estimates of SOC stocks could be obtained by improving the resolution of the Poggio & Gimona approach or using maps with a single soil type in each map unit as the basis for the assessment. This is possible with the traditional approach by Baggaley et al. using the more detailed 1:25 000 Soil maps of Scotland (partial cover) which covers around 95% of the cultivated land in Scotland. This approach has been adopted in a project to provide data on topsoil SOC stocks for over 500,000 fields in Scotland, covering 83 % of the total land area and where a correction factor was also applied to the older SOC concentration data.

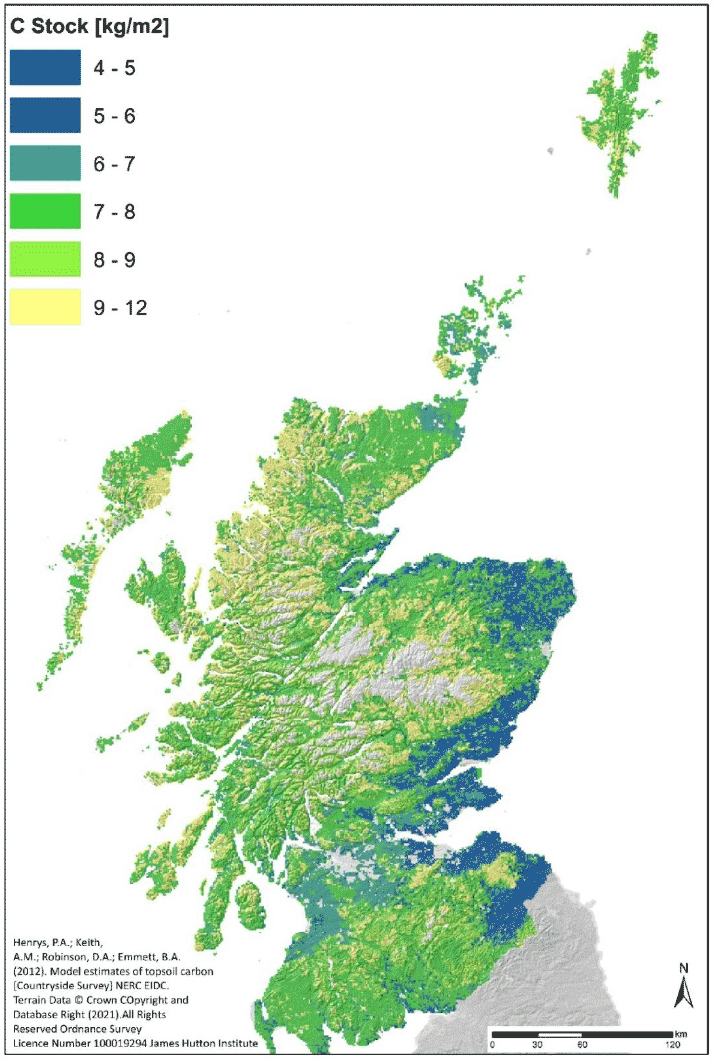
The Stocks to 15cm depth from the combined 1978, 1998 and 2007 Countryside Surveys (Figure 6) have also been mapped on a 1 km grid using a simple statistical method based on characteristics of parent material map and habitat type, providing indication of the spatial distribution of stocks by habitat type (Henrys et al., 2012).
The estimates of the SOC stock in Scottish soils are often calculated to 100cm depth as aligns with the Intergovernmental Panel on Climate Change (IPCC) protocols and, in Scotland, the soil material below this depth generally has little SOC. However, this is not the case for peats which often exceed 100 cm depth. Chapman et al. (2009) estimated that stocks of peat below 100cm could be 500 Mt C.
Contact
There is a problem
Thanks for your feedback