Scotland's Marine Economic Statistics 2019
Statistics on the economic contributions of Scotland’s marine sectors in 2019. Includes a time series of Gross Value Added (GVA), turnover and employment for marine sectors. The supporting documents include: accessible tables, a summary topic sheet and a pdf version of the publication.
3. Commercial fishing
3.1 Introduction
Scotland’s commercial fishing fleet and sea fisheries are significant contributors to Scotland’s rural and coastal economies. The commercial fishing industry contributes significantly to Scotland’s food and drink economy, in particular playing an important part in many remote and potentially fragile communities.
In this section the economic contribution of the commercial fishing sector is sourced from the Seafish[4] survey, with employment figures from Scottish Sea Fisheries Statistics. This approach provides more reliable estimates of economic activity than the SABS figures, primarily because the source data covers the entire population of commercial fishing vessels and the Seafish survey provides financial data that is used to estimate GVA for the UK fleet. Seafish provide bespoke extracts of economic values for the Scottish fleet for this publication.
3.2 Key economic points
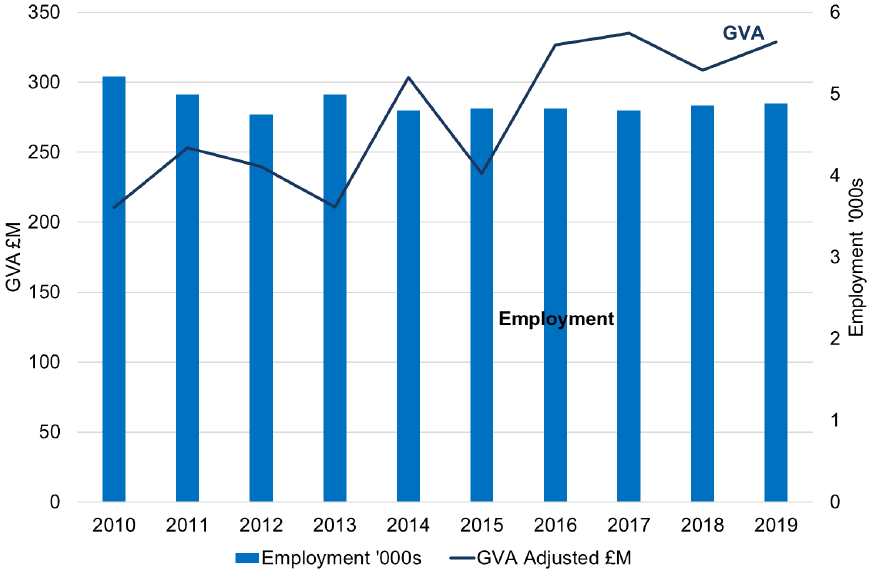
In 2019, fishing generated £329 million GVA: accounting for 0.22% of the overall Scottish economy and 6.5% of the marine economy GVA. The commercial fishing industry provided employment for a headcount of 4,886 people, contributing 0.18% of the total Scottish employment and 6.5% of the marine economy employment.
3.3 Sea fishing trends
From 2018 to 2019, the GVA from fishing (adjusted to 2019 prices) increased by 6%. The longer term trend from 2010 to 2019, showed that fishing GVA increased by 56% and GVA per person increased 67% from £40 thousand per person to £67 thousand per person.
From 2010 to 2019, employment fell by 6%, though it has been stable in recent years.
| Year | GVA (millions of pounds) | Turnover (millions of pounds) | Employment headcount (thousands) | GVA per head (pounds) |
|---|---|---|---|---|
| 2010 | 210 | 520 | 5.22 | 40,329 |
| 2011 | 253 | 593 | 5.00 | 50,734 |
| 2012 | 240 | 551 | 4.75 | 50,557 |
| 2013 | 211 | 501 | 4.99 | 42,232 |
| 2014 | 303 | 586 | 4.80 | 63,271 |
| 2015 | 235 | 487 | 4.82 | 48,668 |
| 2016 | 327 | 609 | 4.82 | 67,746 |
| 2017 | 335 | 616 | 4.80 | 69,809 |
| 2018 | 309 | 603 | 4.86 | 63,536 |
| 2019 | 329 | 596 | 4.89 | 67,257 |

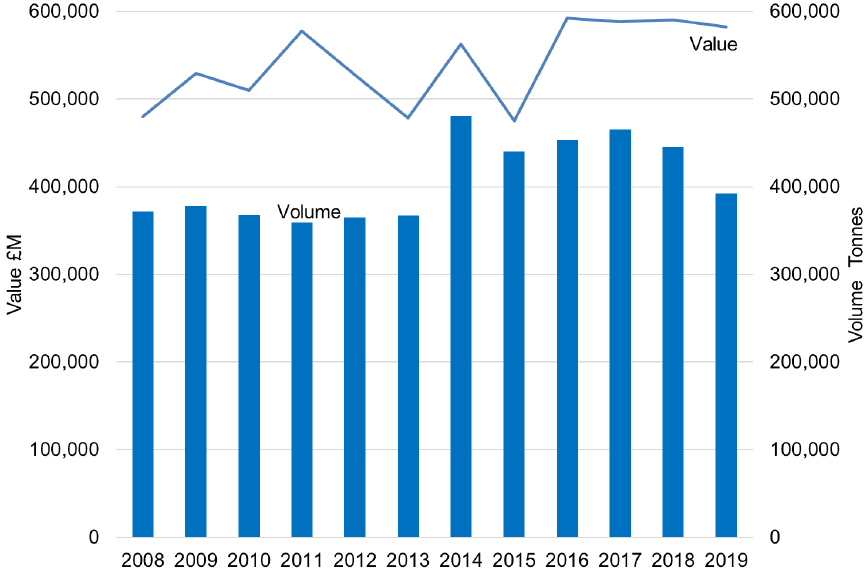
Fishing GVA is mostly driven by the volume of landings and price. However, total volume of landings can be influenced by quota changes, such as the 31% increase in quantity of landings in 2014 (see Figure 5). Between 2010 and 2019, the quantity of fish landed increased by 7% and value by 14%.
Figure 5 shows landings volume and value for Scottish registered vessels from 2010 to 2019.

Source: Scottish Sea Fisheries Statistics 2020
Full data tables are shown in the Tables section on page 49.
3.4 Sea fishing by geography
The table below presents the value of landings at local authority level based on the vessel’s registered port. Table 24 shows the time series from 2016 to 2019 for the value of landings by local authority areas. While the methodology used allocates value to the port of register, it does not relate to the area of catch.
Sixteen local authorities are reported here. The other 16 either have no reported value of landings from fishing or have so few vessels registered that their statistics are disclosive. The suppressed statistics are reported in the table as ‘unallocated’.
Employment on Scottish registered vessels is regularly reported in the Marine Scotland Scottish Sea Fisheries Statistics. The employment figures are currently reported by regions, which are broadly local authority areas, with the island local authorities combined.
With fishers, Aberdeenshire has the largest number of people employed in sea fishing in Scotland and accounted for 25% of the total number of fishers on Scottish vessels in 2019. The Highland region accounted for 18% of the employment.
| Local authority | Value of landings (millions of pounds) | Employment headcount |
|---|---|---|
| Aberdeenshire | 258.4 | 1,238 |
| Shetland Islands | 108.1 | 501 |
| Highland | 56 | 881 |
| Argyll And Bute | 28.8 | 513 |
| Orkney Islands | 22.6 | 288 |
| Na h-Eileanan Siar | 17.1 | 376 |
| Moray | 16.3 | 162 |
| Dumfries And Galloway | 15.2 | 235 |
| South Ayrshire | 11.6 | 215 |
| Fife | 6 | 153 |
| Scottish Borders | 5 | 106 |
| Angus | 3.3 | 60 |
| East Lothian | 2.8 | 94 |
| North Ayrshire | 1.8 | 35 |
| Aberdeen City | 0.5 | 12 |
| City of Edinburgh | c | 17 |
| Unallocated | 42.7 | |
| Scotland Total | 596.3 | 4,886 |
Ranked in order of value of landings.
The letter ‘c’ denotes disclosive data.
Contact
There is a problem
Thanks for your feedback