Scotland's New National Park Appraisal Panel: final report
This report includes the Appraisal Panel’s advice to Ministers on the extent to which nominated areas meet each of the criteria for consideration for designation as new National Parks.
Appendix 2
Supplementary analysis of areas nominated as National Parks
1. Introduction
The supplementary analysis presented here has been undertaken by RESAS using publicly available spatial datasets (see Appendix B) to inform appraisal panel members in relation to specific areas of interest, where relevant data is available. The nominated areas used as the basis for this analysis (See Appendix A) have been provided by the nominating groups. This summary is primarily focused on analysis of natural heritage and cultural features and protected sites, as a basis for providing relevant information related to assessment criteria 1 (outstanding national importance). Some of the information presented on woodland potential and peatlands may also be of broad relevance to criteria 3 (meeting the special needs of the area) and criteria 6 (strategic contribution). In response to a request from the core appraisal team, analysis of socio-economic data has also been provided where relevant data is available (i.e. population ranges, rural-urban classification and indicators of multiple deprivation which includes scores for health, housing, education, income and employment). The analysis should be used by panel members to help inform their consideration of nominations and the material within them relating to these topics. This supplementary analysis is not in any way intended as a form of appraisal or scoring.
2. Caveats/Key points
The findings presented here are not intended as a comprehensive review of all features and assets of relevance to the appraisal criteria. They are also not a formal component of the appraisal and no form of ranking of the nominated areas has been undertaken. The proposed areas used for this analysis have been provided by the nominating groups. The outline areas (Appendix A) should be considered as broadly indicative only and while they provide a useful basis for identifying the areas being nominated, they should not in any way be considered as definitive and therefore any direct comparison across areas should be treated with caution. As such, the findings presented here should only be considered as an outline analysis of some relevant features of the general area relating to the nomination. The findings presented here are based on the data in the publicly available datasets used for this analysis (Appendix B). The quality and accuracy of these datasets (and how up to date they may be) is likely to vary and this has not been accounted for in the analysis presented here. It should also be noted that the peatland coverage data (Section 6.6) has a high degree of uncertainty.
3. Objectives of this supplementary analysis
The aim of this analysis has been to collate datasets relevant to natural and cultural heritage features of national importance and undertake spatial analysis to assess the extent of these features within the indicative areas proposed in the new national park nominations. Within this broader aim there are three specific objectives:
i) To assess the extent and number of statutory sites designated for their natural heritage and/or landscape features and other non-statutory sites/features of interest within each of the indicative areas proposed as national parks
ii) To assess the extent and number of cultural heritage sites and features of interest within each of the indicative areas proposed as national parks.
iii) To assess the extent of priority habitats/habitat features and the extent of peatland habitat and woodland potential within each of the indicative areas proposed as national parks; and
iv) To provide the core appraisal team with socio-economic data for each of the areas proposed as national parks where relevant data is available.
4. Method/Approach
The findings presented here are based on collating spatial datasets for all relevant statutory designations and other sites of interest for natural and cultural heritage and landscape values (see Appendix B for a full list of datasets used including links to underlying definitions and purpose). Following collation of the data a spatial assessment was undertaken based on the areas proposed in each of the nominations to identify the number of each protected area type within or partly within the proposed national park area, the total area (hectarage) for each protected area type which is fully within the proposed national park area and the proportion (%) of the proposed national park area under each protected area type and the total area (hectarage) and proportion (%) under at least one protected area.
In addition to the analysis of protected areas and cultural heritage features, a spatial assessment was undertaken to determine the extent of existing woodland and woodland expansion potential, the extent/coverage of Annex 1 and Priority Habitats and the extent and percentage coverage of peatland (by peatland categories). The findings and related definitions are set out in Sections 5.1 to 5.9 below.
The areas used in this analysis for the Borders, Galloway and Tay Forest nominations were provided as spatial files by Lateral North (the external organisation that was contracted to provide support to the nominating groups). For Lochaber multiple area options were provided. This analysis used the area shown in Appendix B for Lochaber based on the nominating group confirming this as the area being nominated. In relation to Loch Awe, two different areas were provided by Lateral North (as spatial files), both of which were larger than the area identified in the Loch Awe nomination (see Loch Awe website: About Loch Awe - Loch Awe National Park). To ensure a consistent approach which used spatial files to define all of the proposed areas, this analysis includes an assessment for the area identified within the Loch Awe nomination converted to a spatial file format (see Appendix A for maps of all nominated areas).
5. Summary of spatial analysis
5.1 Size and indicative population of nominated areas
The size of the nominated areas and their indicative populations is shown in Table 1. The size is based on the proposed areas provided by the nominating groups. These areas should be considered as broadly indicative only. Population estimates for the areas are shown as lower and upper bounds based on the total population for data zones fully within the proposed areas (lower bound) and the total population of all data zones sitting within and sitting over (to any extent) the outline of the proposed area. The exact population for each area will lie somewhere between these two figures.
Nominating Area |
Size of proposed area (Ha) |
Population (Lower Bound) |
Population (Upper Bound) |
|---|---|---|---|
Loch Awe |
91,810 |
0 |
7,504 |
Borders |
136,138 |
19,165 |
40,110 |
Lochaber |
465,340 |
5,371 |
25,784 |
Galloway |
346,819 |
27,802 |
68,126 |
Tay Forest |
290,183 |
13,656 |
37,031 |
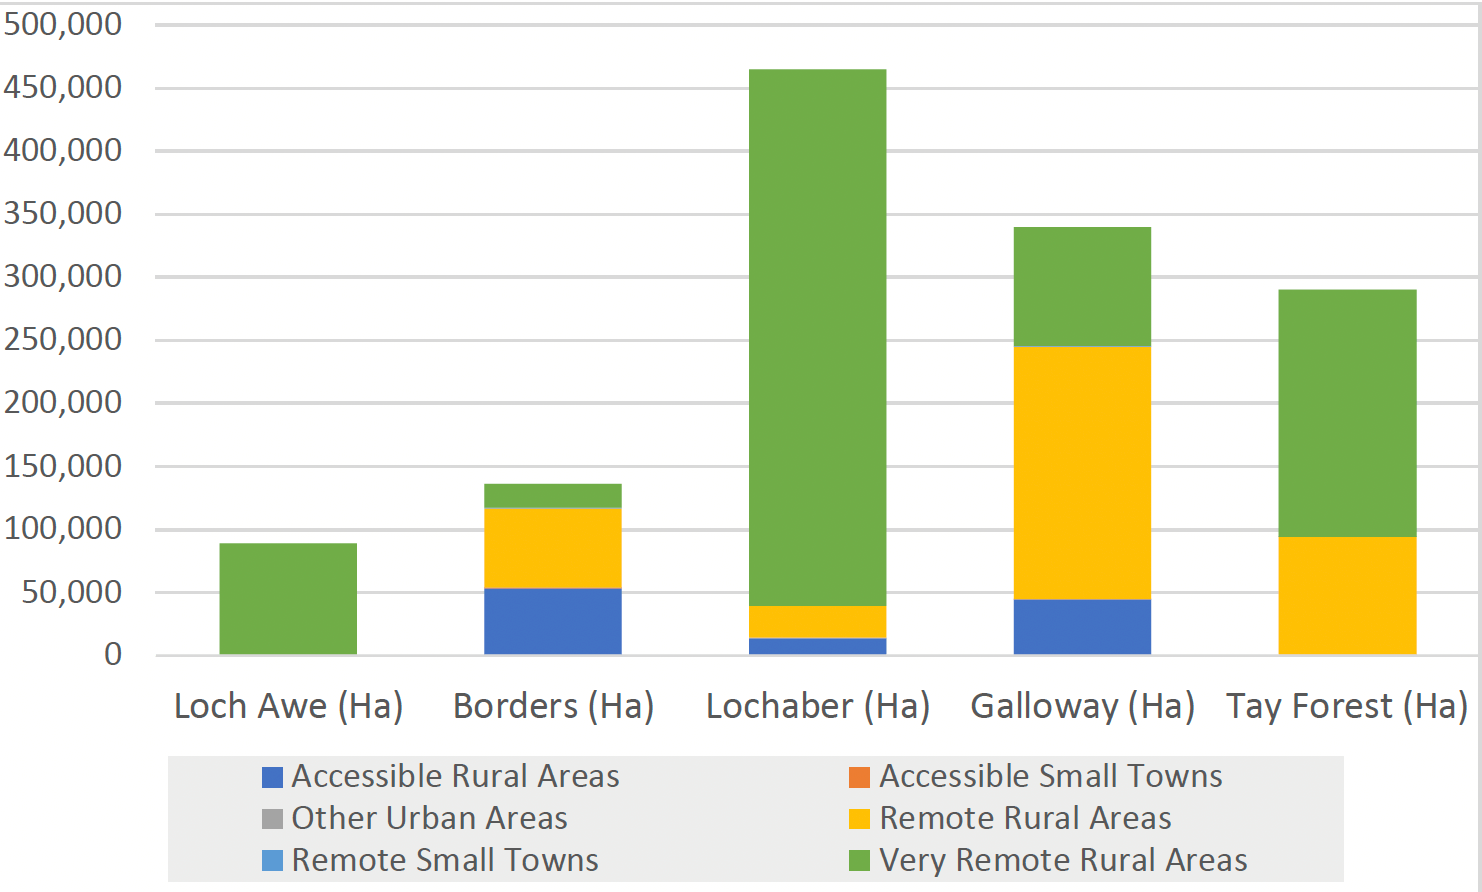
5.2 Rural-Urban Classification
Figure 2 shows the classification of the five nominated areas by land area (total hectares) based on the Scottish Government’s six-fold rural-urban classification[3]. Table 2 shows this area data for rural urban classification in addition to the proportion of land (%) within the proposed national park area in each of the rural-urban categories. The total land area and percentage cover in Table 2 may not add up to the total area of the proposed sites (or to 100%) in all cases as waterbodies are not included within rural-urban category calculations.
Urban/Rural Classification |
Loch Awe (Ha) |
Loch Awe (%) |
Borders (Ha) |
Borders (%) |
Lochaber (Ha) |
Lochaber (%) |
Galloway (Ha) |
Galloway (%) |
Tay Forest (Ha) |
Tay Forest (%) |
|---|---|---|---|---|---|---|---|---|---|---|
Accessible Rural Areas |
- |
- |
53,499 |
39.3% |
13,563 |
2.9% |
44,254 |
12.8% |
432 |
<1% |
Accessible Small Towns |
- |
- |
177 |
<1% |
- |
- |
150 |
<1% |
- |
- |
Other Urban Areas |
- |
- |
202 |
<1% |
913 |
0.2% |
377 |
<1% |
- |
- |
Remote Rural Areas |
32 |
<1% |
63,107 |
46.4% |
25,056 |
5.4% |
200,411 |
57.8% |
93,371 |
32.2% |
Remote Small Towns |
- |
- |
277 |
<1% |
- |
- |
465 |
<1% |
341 |
<1% |
Very Remote Rural Areas |
89,152 |
97.1% |
18,870 |
13.9% |
425,238 |
91.4% |
94,293 |
27.2% |
196,039 |
67.6% |
Very Remote Small Towns |
- |
- |
- |
- |
- |
- |
- |
- |
- |
- |
5.3 Designated Sites
Tables 3 to 5 present the data for total number, total area (hectares) and the proportion (%) of the nominated areas under each designation type and the total (hectares and %) under at least one designation. For total number of sites (Table 3) this relates to the number of sites located wholly or partly within the proposed national park area.
Designated Site |
Loch Awe |
Borders |
Lochaber |
Galloway |
Tay Forest |
|---|---|---|---|---|---|
NNR |
2 |
0 |
5 |
2 |
1 |
SSSI |
14 |
28 |
52 |
81 |
68 |
SAC |
4 |
3 |
20 |
14 |
16 |
SPA |
2 |
2 |
8 |
4 |
5 |
Ramsar |
0 |
1 |
2 |
4 |
2 |
Combined Total |
22 |
34 |
87 |
105 |
92 |
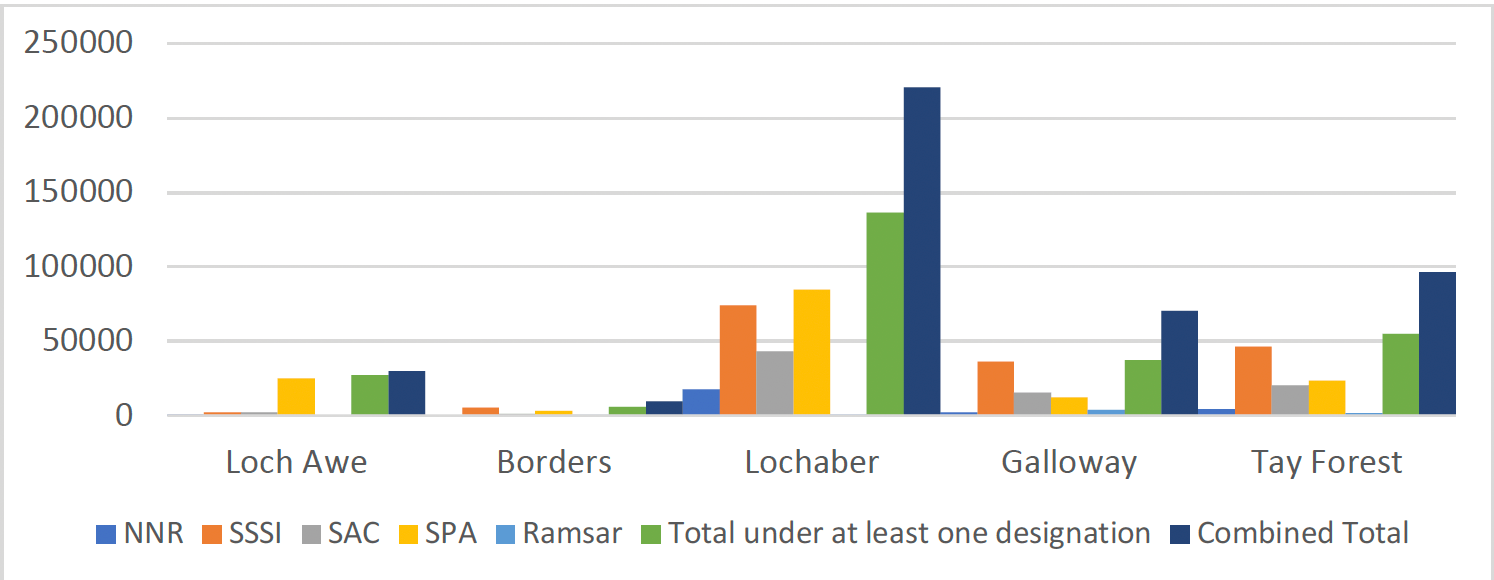
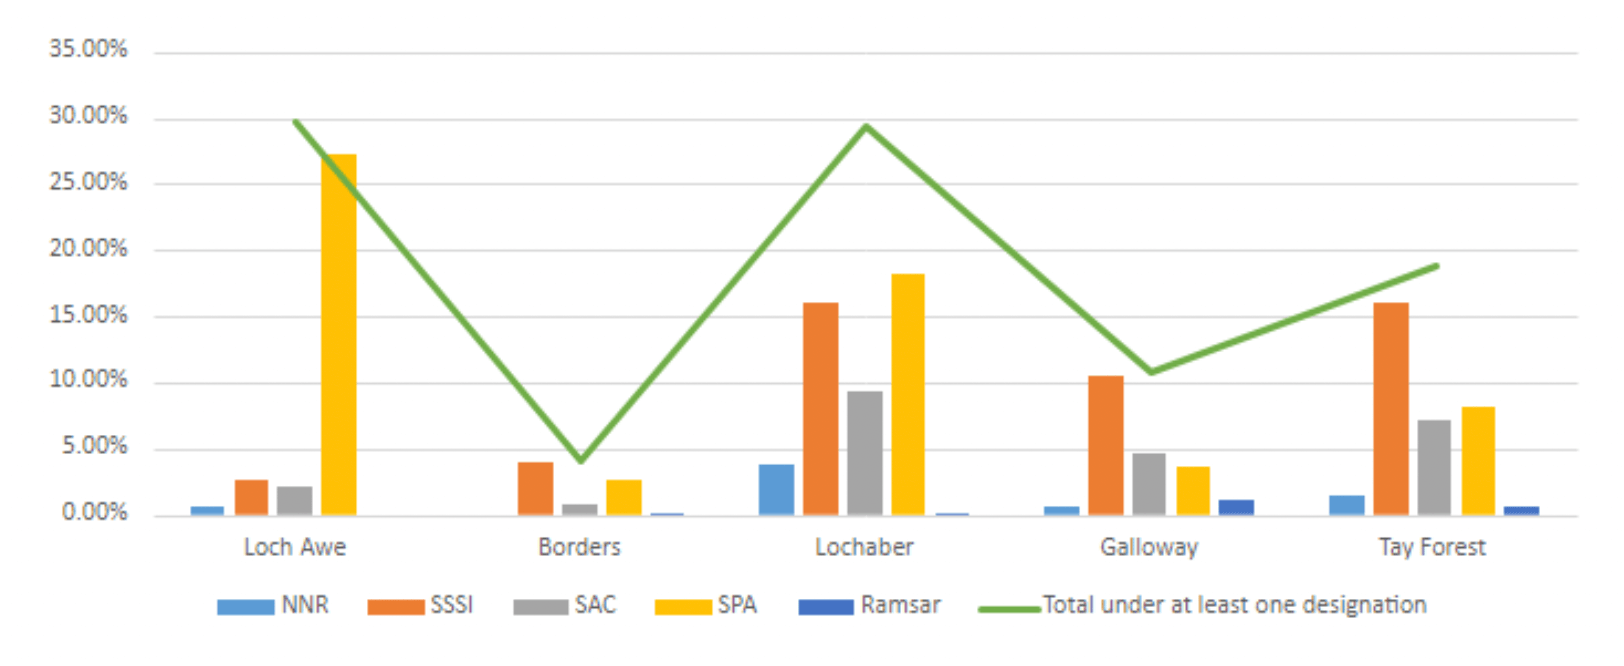
The total area (ha) for each designated site type (Table 4 and Figure 2) and the related proportion of the proposed national park area (Table 5 and Figure 3) is based on the total hectarage fully contained within the proposed national park area for each designated site type.
Designated Site |
Loch Awe |
Borders |
Lochaber |
Galloway |
Tay Forest |
|---|---|---|---|---|---|
NNR |
541 |
0 |
17,789 |
2,106 |
4,154 |
SSSI |
2,397 |
5,410 |
74,185 |
36,093 |
46,590 |
SAC |
1,938 |
943 |
43,277 |
15,738 |
20,526 |
SPA |
25,053 |
3,521 |
84,871 |
12,434 |
23,609 |
Ramsar |
0 |
36 |
570 |
3,865 |
1,572 |
Under at least one designation |
27,370 |
5,704 |
136,584 |
37,509 |
54,792 |
Combined Total |
29,929 |
9,910 |
220,691 |
70,236 |
96,450 |
Protected Area (Site Type) |
Loch Awe |
Borders |
Lochaber |
Galloway |
Tay Forest |
|---|---|---|---|---|---|
NNR |
0.6% |
0% |
3.8% |
0.6% |
1.4% |
SSSI |
2.6% |
4% |
15.9% |
10.4% |
16% |
SAC |
2.1% |
0.7% |
9.3% |
4.5% |
7% |
SPA |
27.3% |
2.6% |
18.2% |
3.6% |
8.1% |
Ramsar |
0% |
0% |
0.1% |
1.1% |
0.5% |
Under at least one designation |
29.8% |
4.2% |
29.4% |
10.8% |
18.9% |
5.4 Other protected areas and sites of interest
Tables 6 to 8 present the data for total number, total area (ha) and the proportion (%) of the nominated areas for each of the additional protected areas/sites of interest. As for the designated sites analysis, the total number of sites (Table 6) relates to the number of sites located wholly or partly within the proposed national park areas.
Site Type |
Loch Awe |
Borders |
Lochaber |
Galloway |
Tay Forest |
|---|---|---|---|---|---|
Marine Protected Area |
1 |
0 |
4 |
1 |
0 |
National Scenic Areas |
2 |
1 |
6 |
3 |
5 |
Wild Land Areas |
2 |
0 |
6 |
1 |
5 |
Local Nature Reserves |
0 |
0 |
0 |
1 |
0 |
Local Landscape Areas |
2 |
5 |
8 |
11 |
13 |
Biosphere Reserves |
0 |
0 |
1 |
1 |
0 |
Combined number of sites |
7 |
6 |
25 |
18 |
23 |
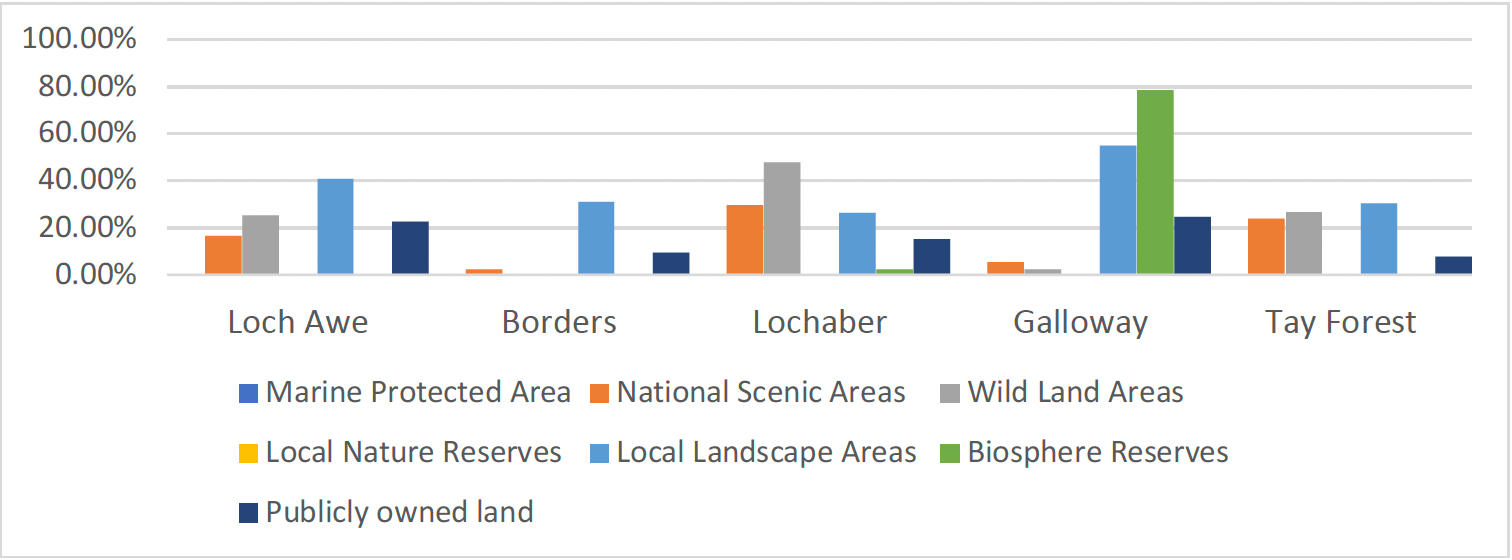
The total area (ha) for each site type (including publicly owned land) (Table 7) and the related proportion of the proposed national park area (Table 8 and Figure 4) is based on the total hectarage fully contained within the proposed national park area for each site type. These tables also include data on the number, total hectarage and proportion of publicly owned land. This includes land managed by Forestry and Land Scotland, Transport Scotland, the Ministry of Defence, Scottish Water, Naturescot and the ministerial crofting estates.
Site Type |
Loch Awe |
Borders |
Lochaber |
Galloway |
Tay Forest |
|---|---|---|---|---|---|
Marine Protected Area |
14 |
0 |
55 |
4 |
0 |
National Scenic Areas |
15,244 |
3,430 |
137,719 |
18,375 |
69,285 |
Wild Land Areas |
23,274 |
0 |
222,716 |
8,176 |
77,159 |
Local Nature Reserves |
0 |
0 |
0 |
986 |
0 |
Local Landscape Areas |
37,532 |
42,169 |
122,158 |
190,712 |
88,518 |
Biosphere Reserves |
0 |
0 |
10,537 |
272,728 |
0 |
Publicly owned land |
20,677 |
12,944 |
70,825 |
85,512 |
22,704 |
Combined area of sites |
96,741 |
58,543 |
564,010 |
576,494 |
257,666 |
Site Type |
Loch Awe |
Borders |
Lochaber |
Galloway |
Tay Forest |
|---|---|---|---|---|---|
Marine Protected Area |
<1% |
0% |
<1% |
<1%% |
0% |
National Scenic Areas |
16.6% |
2.5% |
29.6% |
5.3% |
23.9% |
Wild Land Areas |
25.4% |
0% |
47.9% |
2.4% |
26.6% |
Local Nature Reserves |
0% |
0% |
0% |
<1% |
0% |
Local Landscape Areas |
40.9% |
31% |
26.3% |
55% |
30.5% |
Biosphere Reserves |
0% |
0% |
2.3% |
78.6% |
0% |
Publicly owned land |
22.5% |
9.5% |
15.2% |
24.6% |
7.8% |
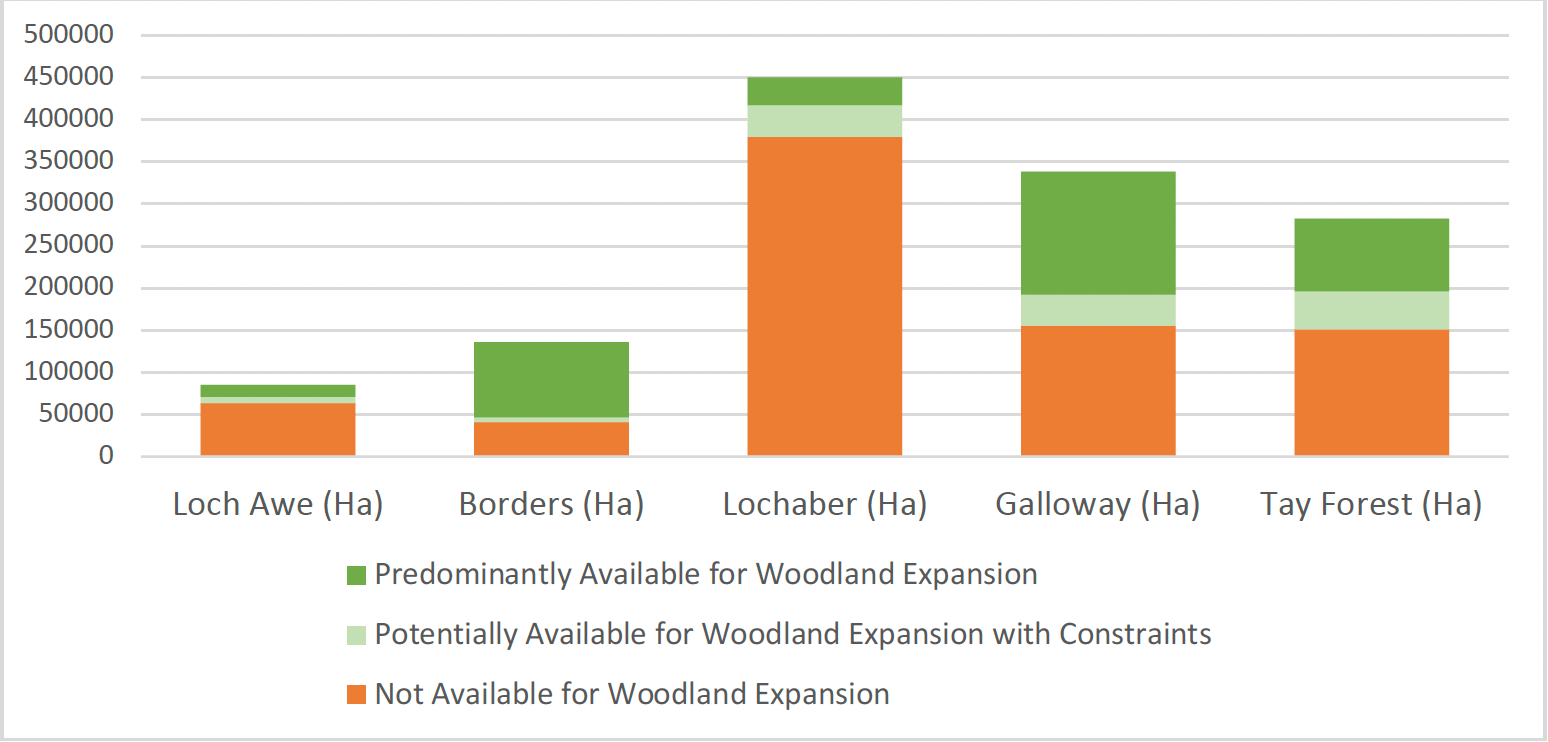
5.5 Woodland and Woodland Expansion Potential
Table 9 and Figure 5 present the data on existing woodland cover (based on the National Forest Inventory) and the extent of land not available for woodland expansion and land potentially and predominantly available for woodland expansion (based on the woodland expansion dataset for Scotland)[4]. The area classed as land ‘not available for woodland expansion’ includes existing woodland. These findings relate to all woodland/forestry types and are not specific to native woodland potential.
Woodland/Expansion Category |
Loch Awe (%) |
Borders (%) |
Lochaber (%) |
Galloway (%) |
Tay Forest (%) |
|---|---|---|---|---|---|
Not Available for Woodland Expansion |
69.6% |
30.2% |
81.5% |
44.9% |
52% |
Potentially Available for Woodland Expansion with Constraints |
8.1% |
3.7% |
8.1% |
10.5% |
15.4% |
Predominantly Available for Woodland Expansion |
14.5% |
66% |
7.2% |
42% |
29.9% |
Woodland Cover (National Forest Inventory) |
32% (29,419ha) |
24.7% (33,667ha) |
17.9% (83,175ha) |
28.5% (98,865ha) |
21.7% (63,049ha) |
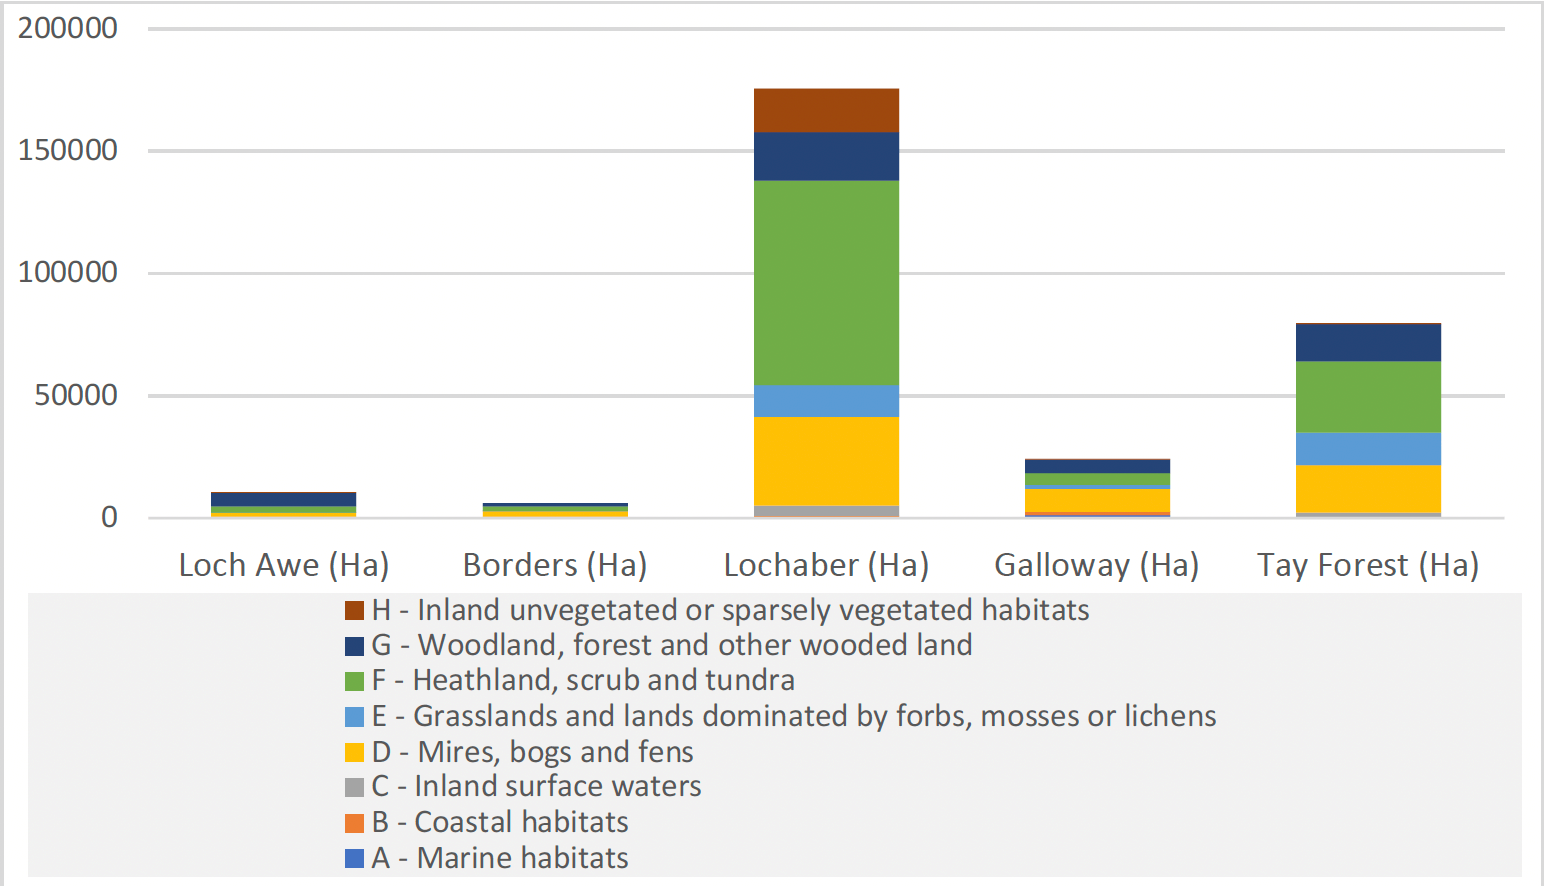
5.6 Annex 1 and Priority Habitats
Figure 6 and Table 10 present the data on the total area (ha) and the proportion (%) of the nominated areas under Annex 1 Habitats. Annex 1 habitats[5] are habitat types listed on Annex 1 of the EU Habitats Directive which occur in Scotland and for which Special Areas of Conservation (SACs) are selected.
Annex 1 Habitat Breakdown |
Loch Awe (%) |
Borders (%) |
Lochaber (%) |
Galloway (%) |
Tay Forest (%) |
|---|---|---|---|---|---|
A - Marine habitats |
<0.1% |
0 |
<0.1% |
0.4% |
0% |
B - Coastal habitats |
< 0.1% |
0 |
0.2% |
0.3% |
0% |
C - Inland surface waters |
0.1% |
<0.1% |
0.9% |
<0.1% |
0.7% |
D - Mires, bogs and fens |
2.37% |
2.00% |
7.80% |
2.7% |
6.8% |
E - Grasslands and lands dominated by forbs, mosses or lichens |
<0.1% |
0.2% |
2.8% |
0.5% |
4.5% |
F - Heathland, scrub and tundra |
2.9% |
1.4% |
17.9% |
1.4% |
10.1% |
G - Woodland, forest and other wooded land |
5.9% |
0.9% |
4.3% |
1.6% |
5.3% |
H - Inland unvegetated or sparsely vegetated habitats |
< 0.1% |
0% |
3.9% |
<0.1% |
0.1% |
Total Area of Annex 1 Habitat |
11.3% |
4.5% |
37.8% |
7% |
27.5% |
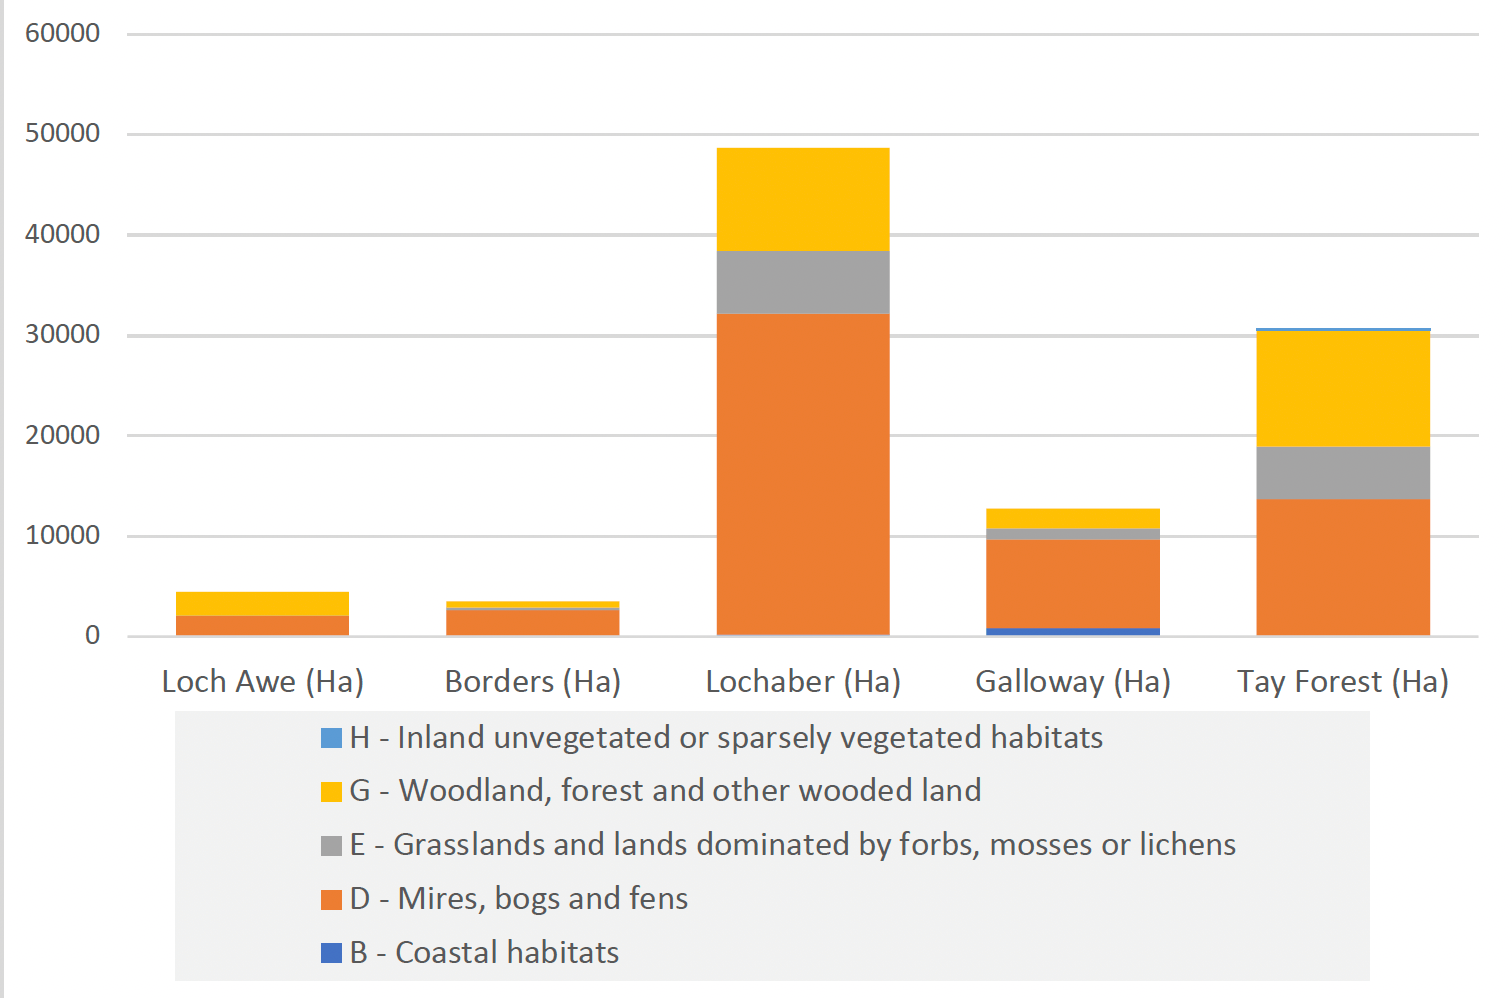
Figure 7 and Table 11 present the data on the total area (ha) and the proportion (%) of the nominated areas under Priority Habitats. Priority Habitats are habitat types listed on Annex 1 of the EU Habitats Directive which are in danger of disappearance and whose natural range mainly falls within the territory of the European Union.
Priority Habitat Breakdown |
Loch Awe (%) |
Borders (%) |
Lochaber (%) |
Galloway (%) |
Tay Forest (%) |
|---|---|---|---|---|---|
B - Coastal habitats |
0% |
<0.1% |
0.3% |
0% |
|
D - Mires, bogs and fens |
2.3% |
2% |
6.9% |
2.6% |
4.7% |
E - Grasslands and lands dominated by forbs, mosses or lichens |
<0.1% |
0.1% |
1.3% |
0.3% |
1.8% |
G - Woodland, forest and other wooded land |
2.5% |
0.45% |
2.2% |
0.6% |
4% |
H - Inland unvegetated or sparsely vegetated habitats |
0% |
0% |
0% |
0% |
0.06% |
Total area of Priority habitat |
4.9% |
2.6% |
10.5% |
3.7% |
10.6% |
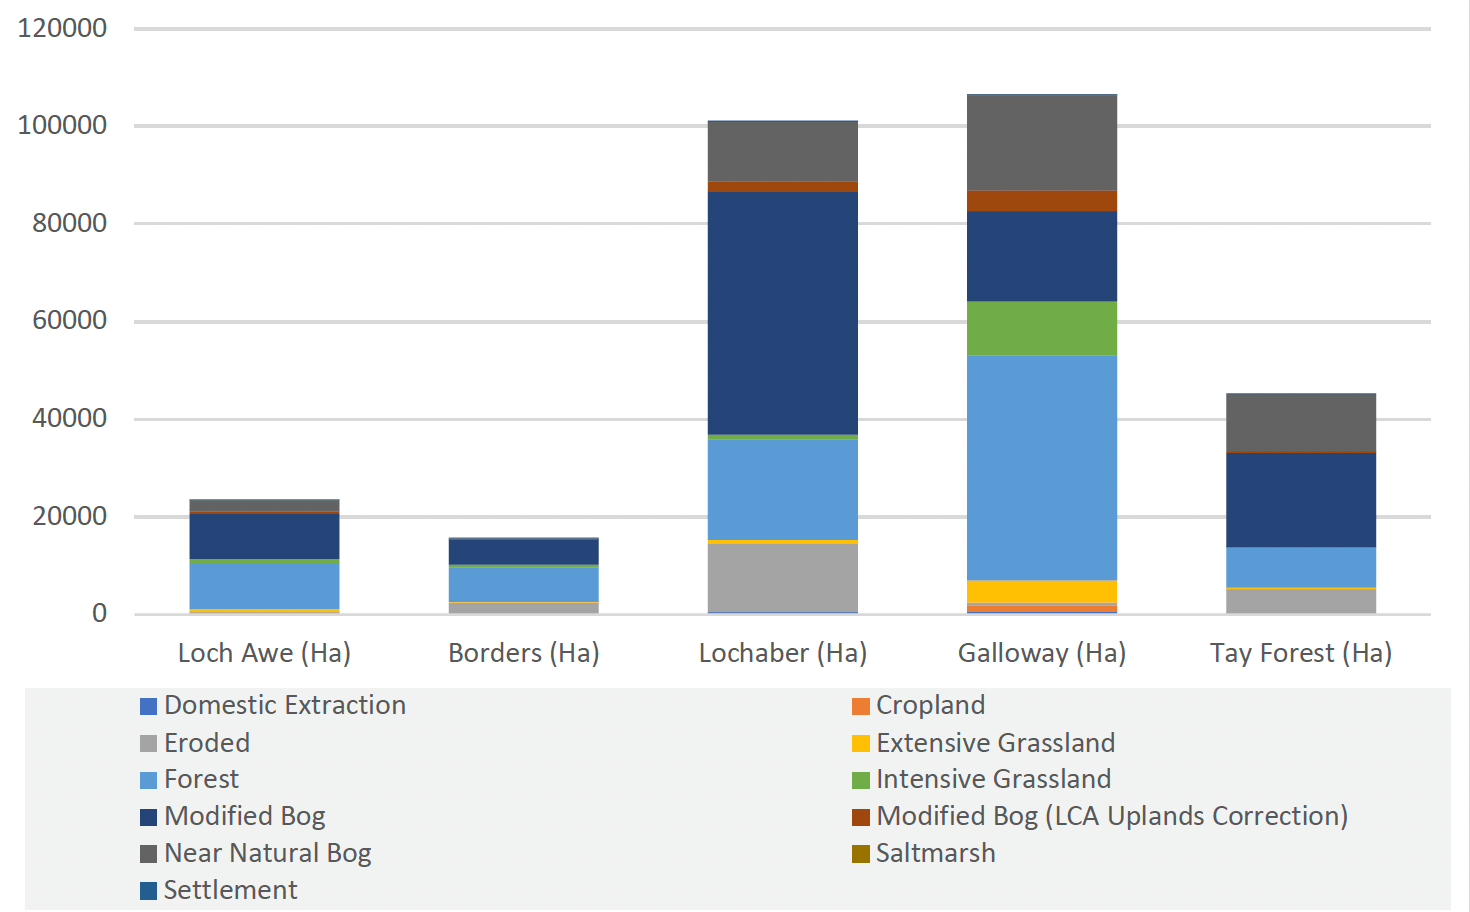
5.7 Peatland
Figure 8 and Table 12 present data on the total area (ha) of peatland (by peatland category) and the proportion (%) of the nominated areas under different categories of peatland. The peatland analysis is based on data on peatland coverage and condition from the Emissions Inventory for UK Peatlands[6]. It should be noted that the peatland coverage data has a high degree of uncertainty.
Peatland (by category) |
Loch Awe (%) |
Borders (%) |
Lochaber (%) |
Galloway (%) |
Tay Forest (%) |
|---|---|---|---|---|---|
Domestic Extraction |
<0.1% |
0 |
0.1% |
0.2% |
0% |
Cropland |
0 |
<0.1% |
0% |
0.4% |
0% |
Eroded |
0.5% |
1.8% |
3% |
0.2% |
1.8% |
Extensive Grassland |
0.8% |
0.2% |
0.2% |
1.3% |
0.1% |
Forest |
10.3% |
5.% |
4.4% |
13.3% |
2.8% |
Intensive Grassland |
0.8% |
0.6% |
0.2% |
3.2% |
<0.1% |
Modified Bog |
10.1% |
3.7% |
10.7% |
5.3% |
6.6% |
Modified Bog (LCA Uplands Correction) |
0.6% |
<0.1% |
0.5% |
1.3% |
0.1% |
Near Natural Bog |
2.4% |
0.3% |
2.6% |
5.6% |
4% |
Saltmarsh |
<0.1% |
<0.1% |
0% |
0% |
|
Settlement |
<0.1% |
<0.1% |
<0.1% |
<0.1% |
0% |
Total Peatland Cover |
25.5% |
11.5% |
21.7% |
30.7% |
15.6% |
5.8 Cultural Heritage Features
Table 13 presents data on the number of cultural heritage features and the related total land area (hectares) for each of the sites and feature categories.
Cultural Features |
Loch Awe |
Borders |
Lochaber |
Galloway |
Tay Forest |
|---|---|---|---|---|---|
Listed buildings |
3 (0ha) |
9 (1ha) |
10 (0ha) |
11 (0ha) |
12 (0ha) |
Scheduled monuments |
137 (72ha) |
228 (1017ha) |
152 (360ha) |
636 (766ha) |
253 (1667ha) |
Gardens and designed landscapes |
2 (101ha) |
8 (2042ha) |
10 (438ha) |
15 (4486ha) |
16 (3408ha) |
Battlefields |
0 |
2 (1425ha) |
4 (1732ha) |
0 |
2 (183ha) |
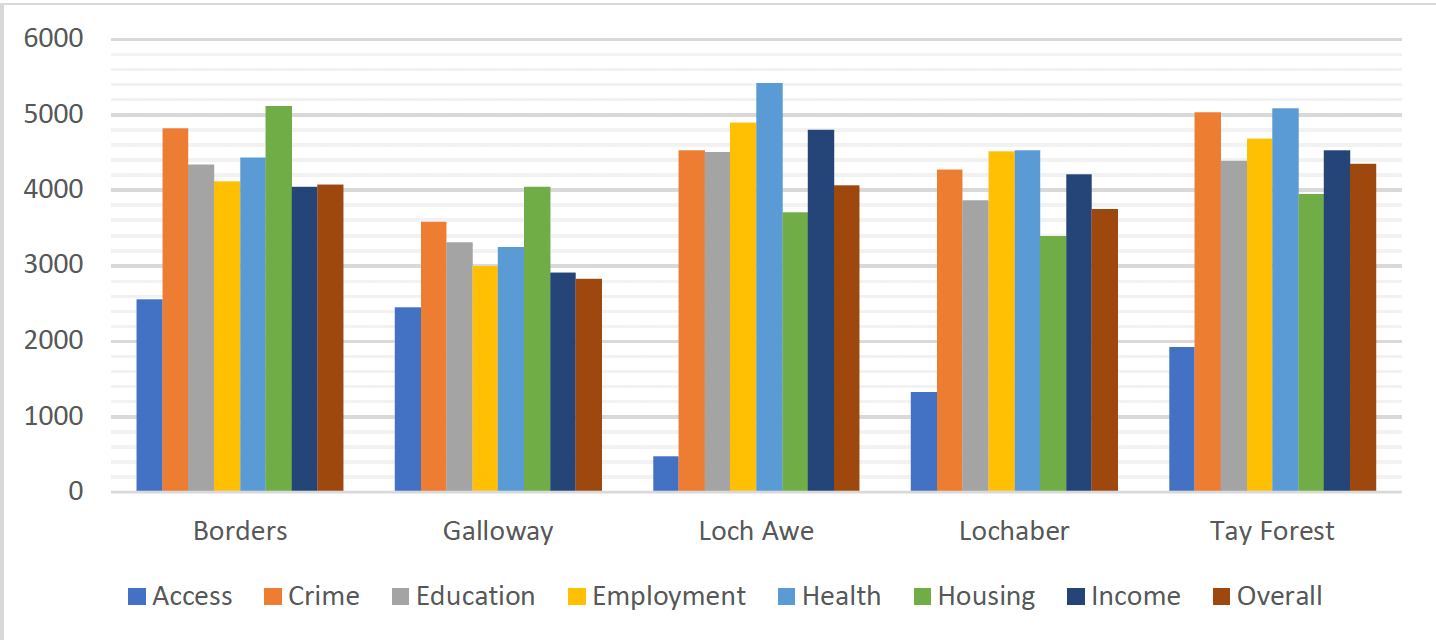
5.9 Scottish Index of Multiple Deprivation (SIMD)
Table 14 and Figure 8 present the average SIMD (Scottish Index of Multiple Deprivation[7]) scores across the seven SIMD categories and a combined average score for the nominated areas. This is based on an average score for all the data zones within the proposed areas (variation in levels of deprivation would occur across the areas). In Table 14 any cells shaded in green represent a score above the Scottish average score and anything shaded red is below the Scottish average.
SIMD looks at the extent to which an area is deprived across seven domains: income, employment, education, health, access to services, crime and housing. The index ranks all data zones in Scotland from most deprived (ranked 1) to least deprived (ranked 6,976). SIMD is an area-based measure of relative deprivation: not every person in a highly deprived area will themselves be experiencing high levels of deprivation.
National Park |
Borders Average |
Galloway Average |
Loch Awe Average |
Lochaber Average |
Tay Forest Average |
|---|---|---|---|---|---|
Access to Services |
2554 |
2444 |
470 |
1325 |
1927 |
Crime |
4826 |
3579 |
4528 |
4281 |
5037 |
Education |
4336 |
3314 |
4508 |
3866 |
4395 |
Employment |
4123 |
3000 |
4903 |
4516 |
4685 |
Health |
4434 |
3252 |
5419 |
4532 |
5091 |
Housing |
5117 |
4047 |
3711 |
3390 |
3955 |
Income |
4049 |
2912 |
4804 |
4211 |
4535 |
Overall |
4078 |
2830 |
4069 |
3752 |
4350 |
Contact
Email: NationalParks@gov.scot
There is a problem
Thanks for your feedback