Scottish Budget 2025 to 2026: distributional analysis of the Scottish Budget
Analysis of the impact on household incomes of tax, social security and public spending decisions taken in the 2025-26 Scottish Budget.
Part One: Overall impact of the tax and social security system
The tax and social security system that applies in Scotland is progressive – the higher a household’s income, the greater the share of their income they pay in income taxes. This enables redistribution of income from higher income to lower income households, both in the form of direct payments – the focus of this part of the analysis – and the funding of public services considered in part three.
Figure 1 shows this through the total impact of personal taxes and social security payments in 2025-26 on household incomes[2]. It includes both devolved taxes (Scottish Income Tax and Council Tax), reserved taxes (Employee National Insurance Contributions and Income Tax on savings and dividends), and devolved and reserved social security payments.
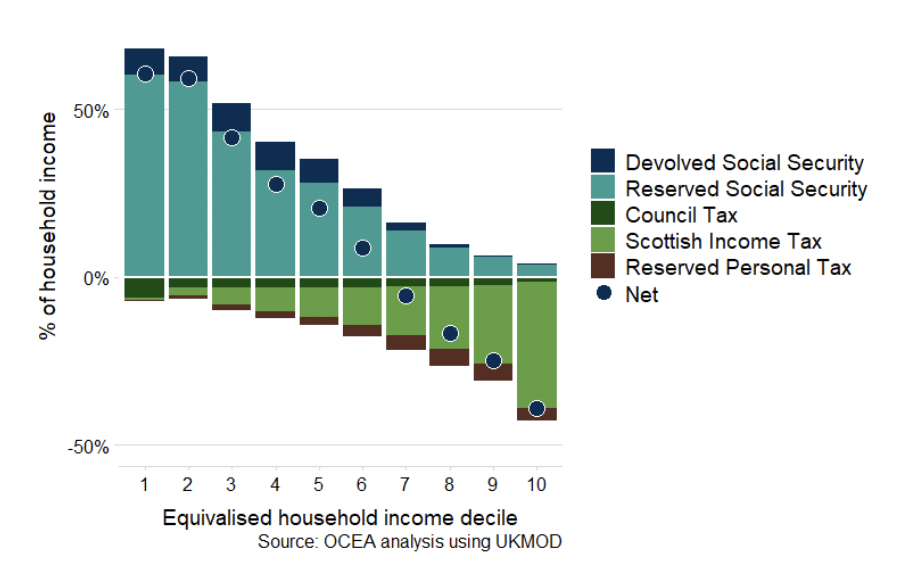
The impact of Scottish Income Tax on households increases with household income. The benefits of social security payments are greatest for the lowest income households, although the bulk of these – notably Universal Credit and the State Pension – remain reserved to the UK Government. Council Tax (after accounting for the impact of the Council Tax reduction scheme and Council Tax discounts) has a proportionally greater impact on lower income households, with higher income households paying a lower share of their income. Overall, the tax and social security system as a whole redistributes from high income households to those on middle and lower incomes, with (on average) households in the six lowest income deciles being net beneficiaries.
The average impact of the tax and social security system across all households is close to zero. However, it is important to note that the taxes included in this analysis do not directly or exclusively fund the social security payments shown.
This analysis excludes significant sources of tax revenue not levied directly on households – several of which saw significant policy changes by the UK Government this year such as employer NICs, Capital Gains Tax and Inheritance Tax, along with benefits-in-kind. Distributional analysis of some elements of public spending can be found below in Section 3.
Whether the average household receives a net benefit from social security payments and personal taxes will depend on both UK Government and Scottish Government decisions on the balance between social security and other types of spending; and between direct personal taxes and other forms of taxation.
Differences between Scotland and the rest of the UK
Since further powers over some taxes and social security payments were devolved to the Scottish Parliament in 2016, there has been increased divergence between the tax and social security systems in Scotland and the rest of the UK.
Figures 2 and 3 below show how Scotland’s tax and social security system compares to the system currently in place in the rest of the UK, including the impact of policy changes announced in the 2025-26 Scottish Budget.[4] The figures show the annual impact as a share of household income and in cash terms, respectively.
As a result of divergence between Scottish and UK Government policies, on average the bottom five deciles are better off in Scotland than in the rest of the UK.
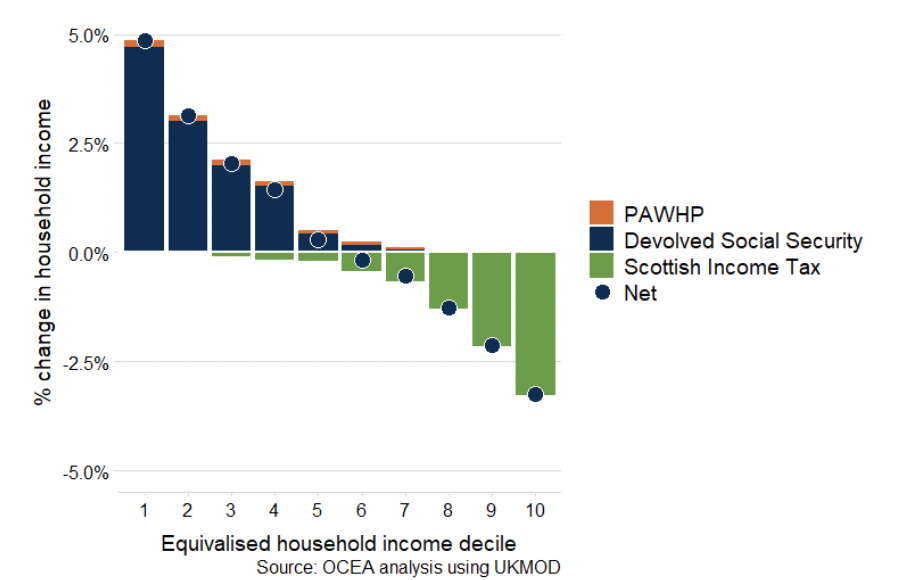
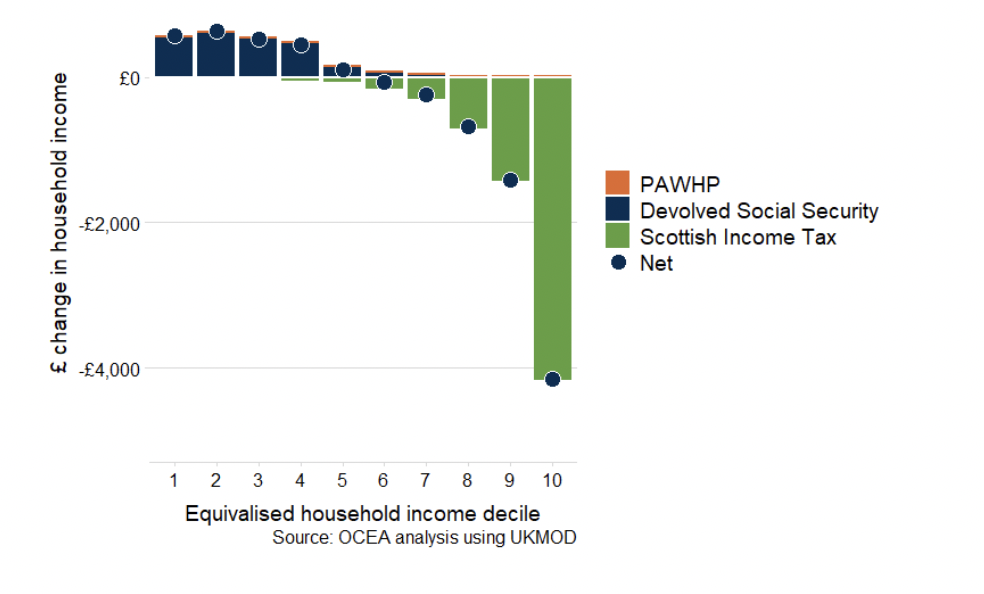
The Scottish Child Payment is the largest single contributor to the improved financial resources of low-income households relative to the rest of the UK, while the impact on higher income households is driven by the Income Tax system in Scotland. This results in people paying more Income Tax than in the rest of the UK on higher incomes and slightly less among those earning under around £30,300[5]. The Scottish Government decision to provide a £100 payment to those not in receipt of a relevant qualifying benefit means most pensioner families will be £100 better off than in the rest of the UK.
Taking changes to the tax and social security system together, 62% of households are better off or unaffected under the Scottish system than in the rest of the UK, with the majority of these in the bottom half of the income distribution. In addition to considering the impact across the income distribution, we can also consider the impact of policy changes on specific household types. Figure 4 shows the difference between Scotland and the rest of the UK’s policies on tax and social security by eight household types. These household types have been selected with reference to protected characteristics as defined in the Equalities Act 2010, and the priority household types used in Scottish child poverty analysis.[6] Additional urban/rural measures have been added this year for the first time.
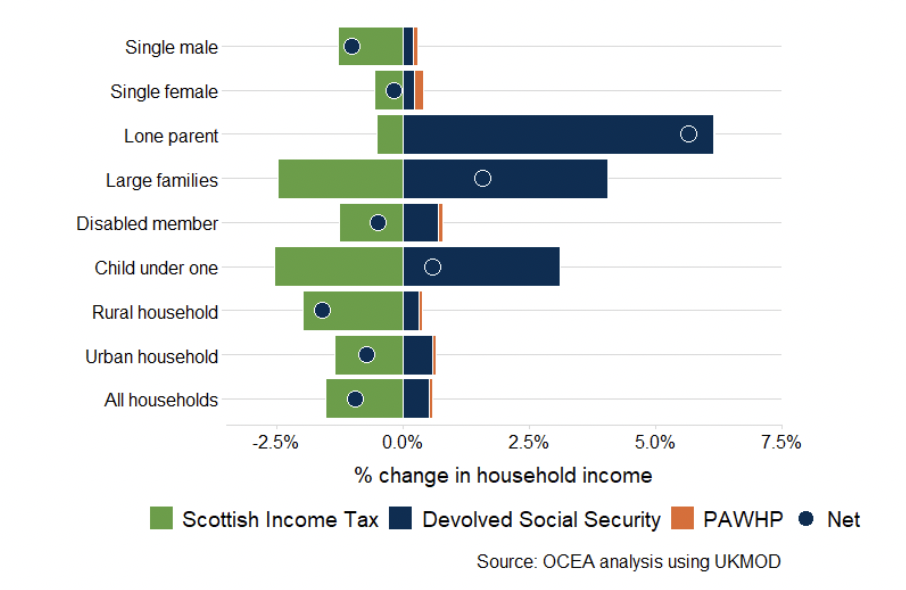
Again, largely driven by the Scottish Child Payment, households with children generally see the greatest benefit relative to their income.
The impacts of differences between the tax and social security systems also vary by age. Figure 5 below shows the impact of differences based on the age of the household reference person.[8]
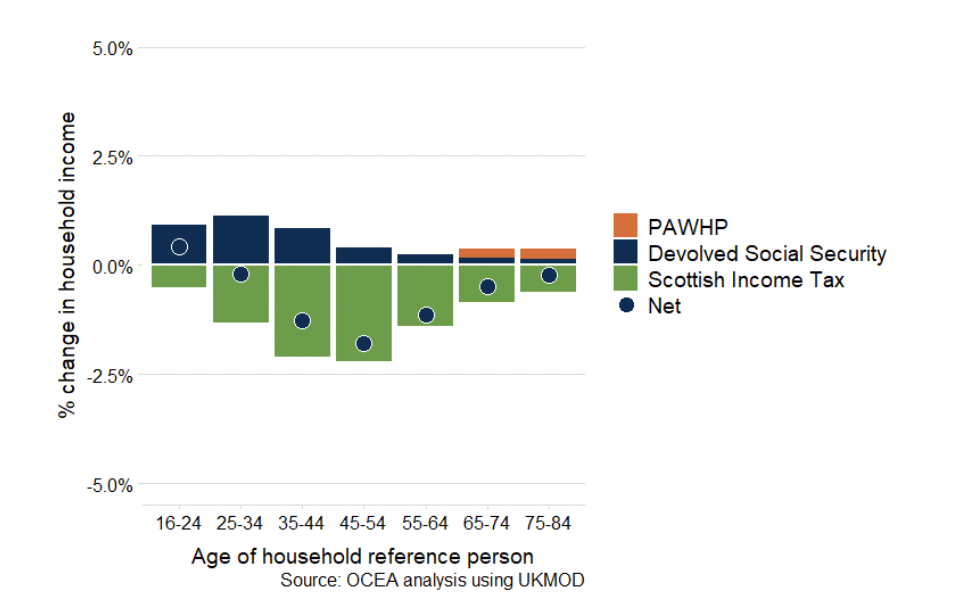
Figure 5 shows that the impact of differences in Income Tax policy is greatest in the middle age cohorts (those aged 35 to 54) where average incomes are highest. In older age cohorts, increasing numbers of workers retire or reduce their working hours, causing average incomes to fall. The impact of differences in social security payments is greatest in younger age cohorts who are more likely to have children, again due to the impact of the Scottish Child Payment.
Contact
Email: jim.bowie@gov.scot
There is a problem
Thanks for your feedback