Scottish Budget 2025 to 2026: distributional analysis of the Scottish Budget
Analysis of the impact on household incomes of tax, social security and public spending decisions taken in the 2025-26 Scottish Budget.
Part Two: Analysis of 2025-26 Budget decisions
This section analyses the impact of the tax and social security policy decisions made or confirmed in the Scottish Budget. It changes more substantially than part one from publication to publication due to its reflecting a different set of budget decisions each time. For Budget 2025-26 it shows the impact on household incomes of:
- An increase in the Basic rate and Intermediate rate thresholds of 3.5% to £15,397 and £27,491 respectively[9].
- Freezing the Higher rate, Advanced rate and Top rate thresholds at £43,662, £75,000 and £125,140 respectively.
- Reforming the Pension Age Winter Heating Payment to pay £200 or £300 payments to pension age families in receipt of a relevant qualifying benefit, following the UK Government decision to target eligibility for the Winter Fuel Payment. And providing a further £100 payment to other pension age families.
These are assessed against an assumed ‘no policy change’ counterfactual. This consists of:
- Uprating most social security payments and tax bands (excluding the Personal Allowance) with inflation – including the Top rate thresholds given the SFC’s approach to baselines[10].
- A universal Pension Age Winter Heating Payment for all pensioners.
Council Tax has been assumed to be uprated in line with CPI. Councils will make decisions on local rates following the Scottish Budget.
The increase of the Scottish Carer’s Payment earnings threshold is not modelled. Whether someone is a carer is taken from the underlying survey, and higher incomes as a result of the higher earnings threshold would be due to a behavioural effect which is not modelled.
Because social security payments have been uprated in line with inflation, and no significant social security policy changes have been introduced in this Budget apart from those above, the following charts only show the impact of changes to Income Tax and Pension Age Winter Heating Payment.
Figures 6 and 7 below summarise the impact of the decisions made in the Budget on household incomes. Impacts are shown as a proportion of household income and in cash terms.
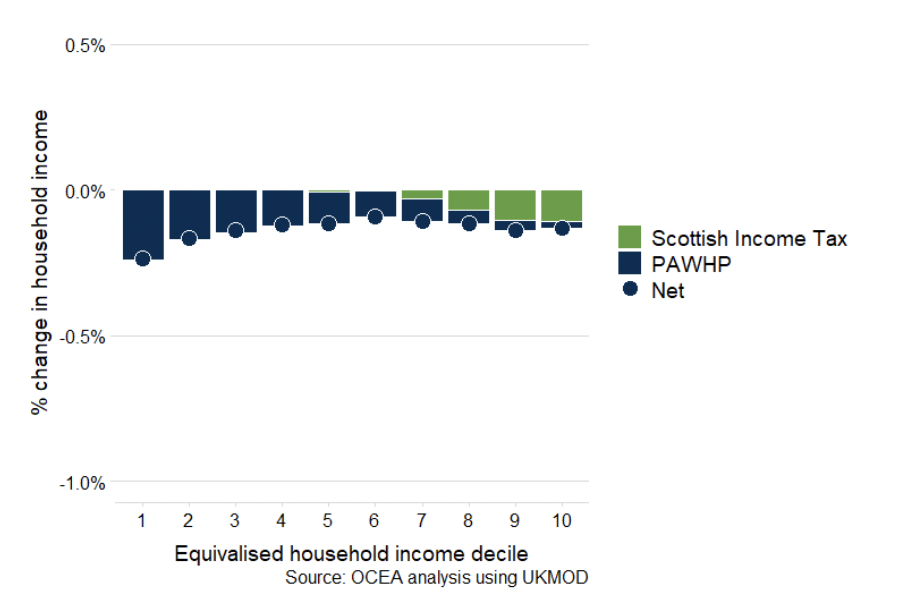
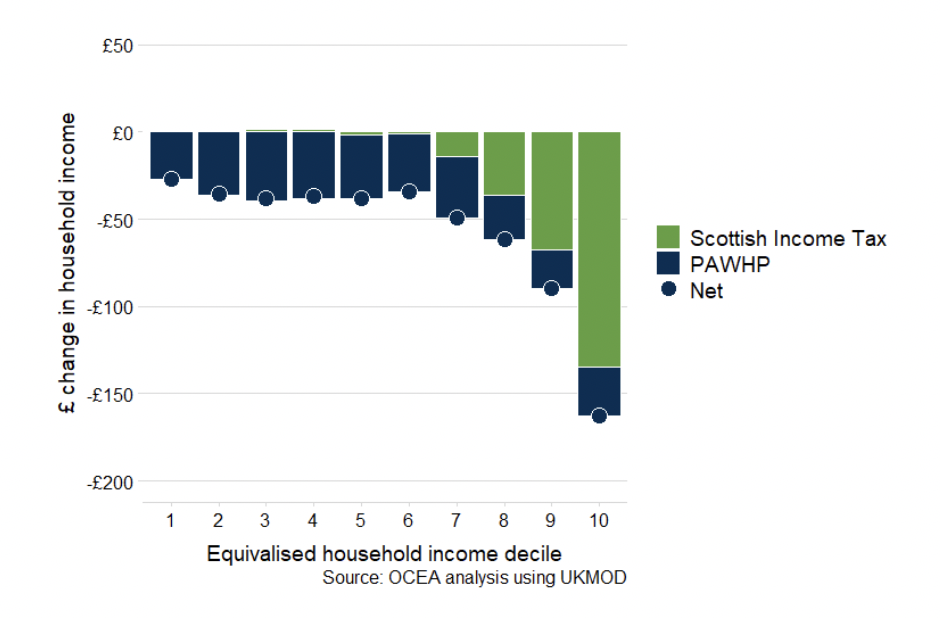
Reform of the Pension Age Winter Heating Payment results in a fairly uniform average loss in cash terms across the distribution relative to the universal eligibility originally planned.
As a share of income, the loss is largest in the bottom decile. Low take-up of Pension Credit (PC) means many households in the bottom decile are not in receipt of a relevant qualifying benefit which could make them substantially better off if claimed. This is not only because they would receive a higher PAWHP payment but because PC itself is generally worth a substantially larger amount than PAWHP and interacts with Council Tax and Housing Benefit[11]. The relatively low level of Pension Credit income thresholds is also a factor that results in some of these low-income households not qualifying for the higher payments.
Since the decision to move to a targeted benefit, the introduction of £100 payments provides an additional benefit to households in the bottom half of the income distribution.
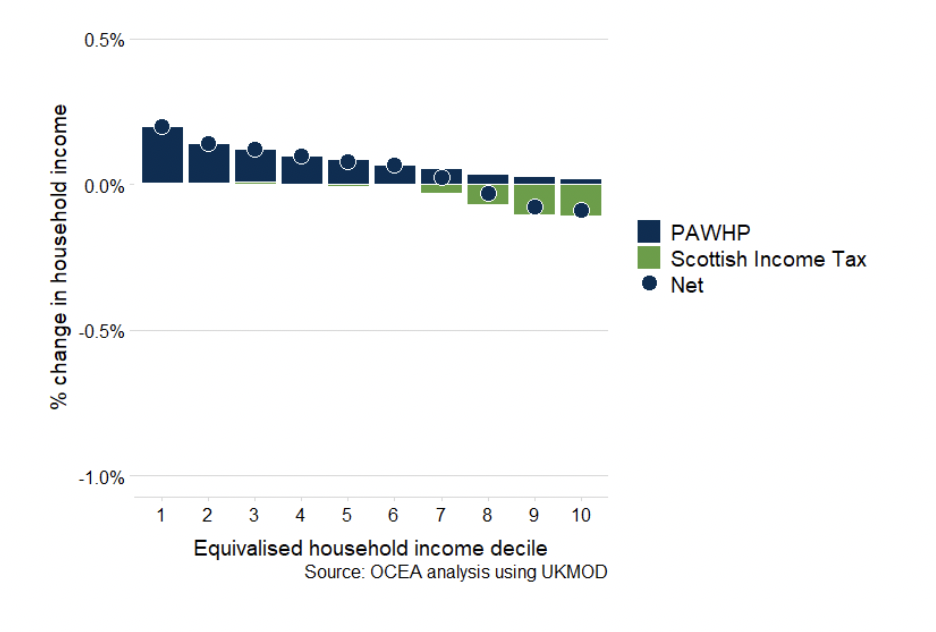
The Income Tax policy further increases the progressivity of the tax system, with the increasing thresholds benefitting households in the lower half of the income distribution by a small amount (up to £12). Almost all Higher rate taxpayers and taxpayers above the frozen thresholds see a progressively greater reduction in income.
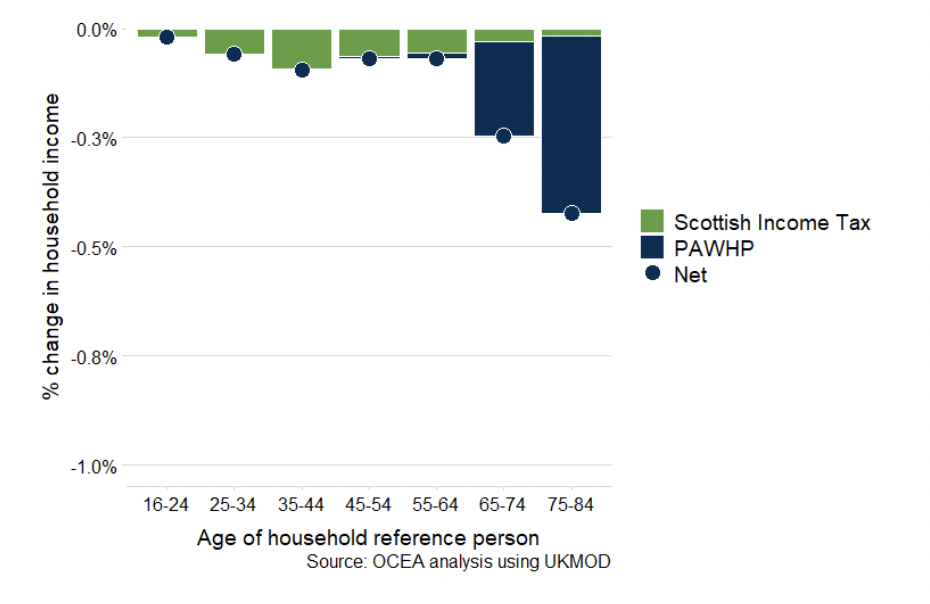
Figure 9 shows that there is relatively little overlap between the affected groups, with frozen thresholds primarily affecting 25 to 64 year olds, and the PAWHP changes affecting those 65 and above.
BOX: Consideration of the Potential Impact of Employer NICs changes
Household incomes will also be affected by recent changes in UK Government policy. The largest revenue-raising measures taken in the UK Autumn Budget were changes to employer National Insurance Contributions (NICs). There was a reduction in the secondary earnings threshold from £9,100 to £5,000 per annum, and an increase in the rate from 13.8 per cent to 15 per cent. The Office for Budget Responsibility (OBR) expect these measures to raise over £18 billion in 2025-26 after behavioural change.
Empirical studies[12] suggest that a substantial amount of the increased cost of employment[13] could be passed through in the form of lower wages, and this was reflected in the judgements of the OBR at the UK Autumn Budget. It is less clear whether this wage pass-through effect will be consistent across the earnings distribution.
It is not possible to fully model the impact on households but Figure B1 shows the number of adults in Scotland broken down into groups based on how they could be affected by the change.
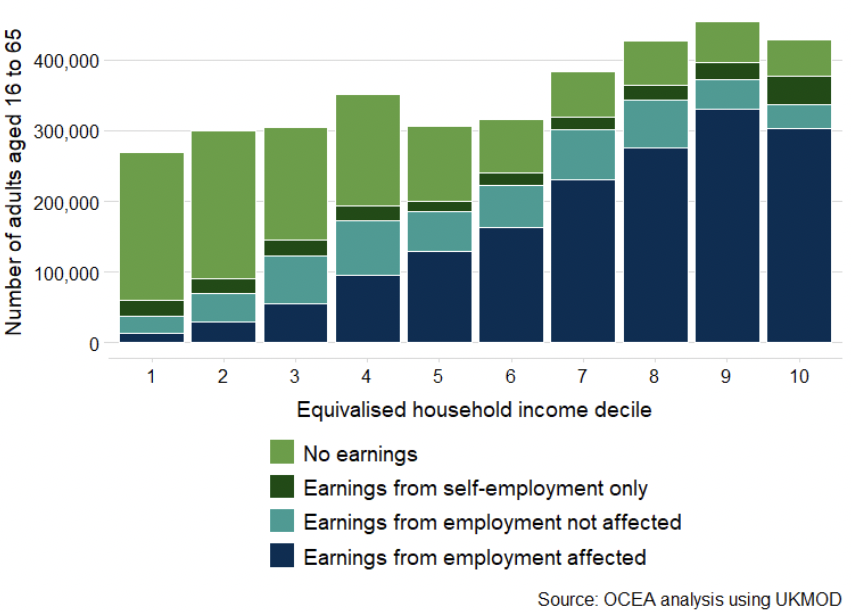
- Those with no employee earnings are not directly affected by the change. These groups are more prevalent at the bottom of the income distribution, although there are a larger number of self-employed people in the top decile.
- Employee earnings above the minimum wage could see additional costs to employers passed through in the form of lower wages.
- While adults with employment earnings at the minimum wage cannot legally see their wages reduced further, they could instead see a reduction in their hours or may be more likely to experience job losses. *A small number of employees earning less than £5,000 per year are also included in this group as they are less likely to see a reduction in their wage rate.
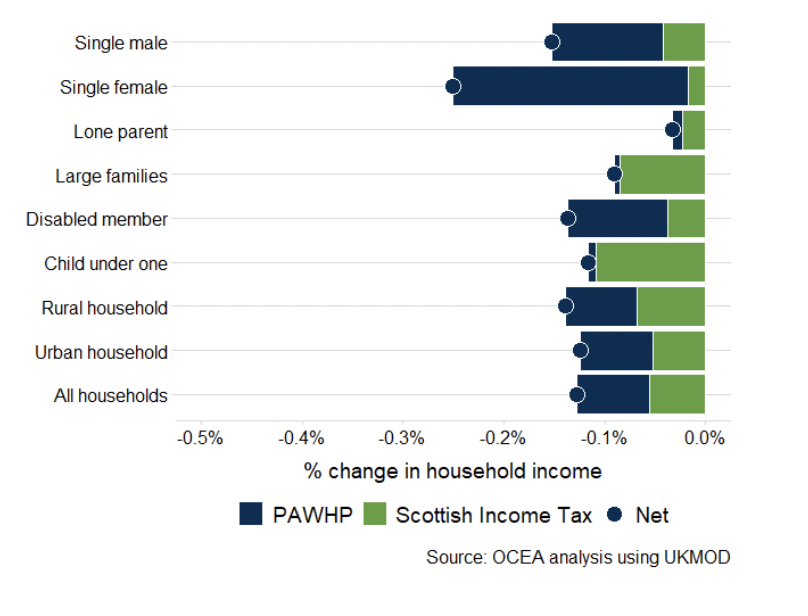
Figure 10 also analyses the impact of the policy changes announced in this budget by the same household types as used in Figure 4. The pronounced difference in the change due to PAWHP, such as for single female households, largely reflects a lower average household income in the group.
Contact
Email: jim.bowie@gov.scot
There is a problem
Thanks for your feedback