Scottish Budget 2025 to 2026: distributional analysis of the Scottish Budget
Analysis of the impact on household incomes of tax, social security and public spending decisions taken in the 2025-26 Scottish Budget.
Part Three: Public spending
This section extends the distributional analysis to consider areas of public spending, specifically resource spending[14] on health, schools, funded early learning and childcare (ELC), and transport. This is with the aim to provide a more comprehensive picture of the distributional implications of the budget and, in time, to inform decisions about spending priorities.
Unlike with tax and social security, spending on these public services does not have a direct monetary impact on household incomes. The average amount spent by government on different household types is used to reflect a benefit to those households.[15] However in practice, the benefit of a service could be greater or lesser than the cost of providing it, and this could vary across different groups, and from household to household.
As such, these estimates are not directly comparable to the tax and social security figures presented in parts one and two. The approaches will continue to be tested and refined for future publications as the analysis is extended to other areas. For more information see the methodology in the annex.
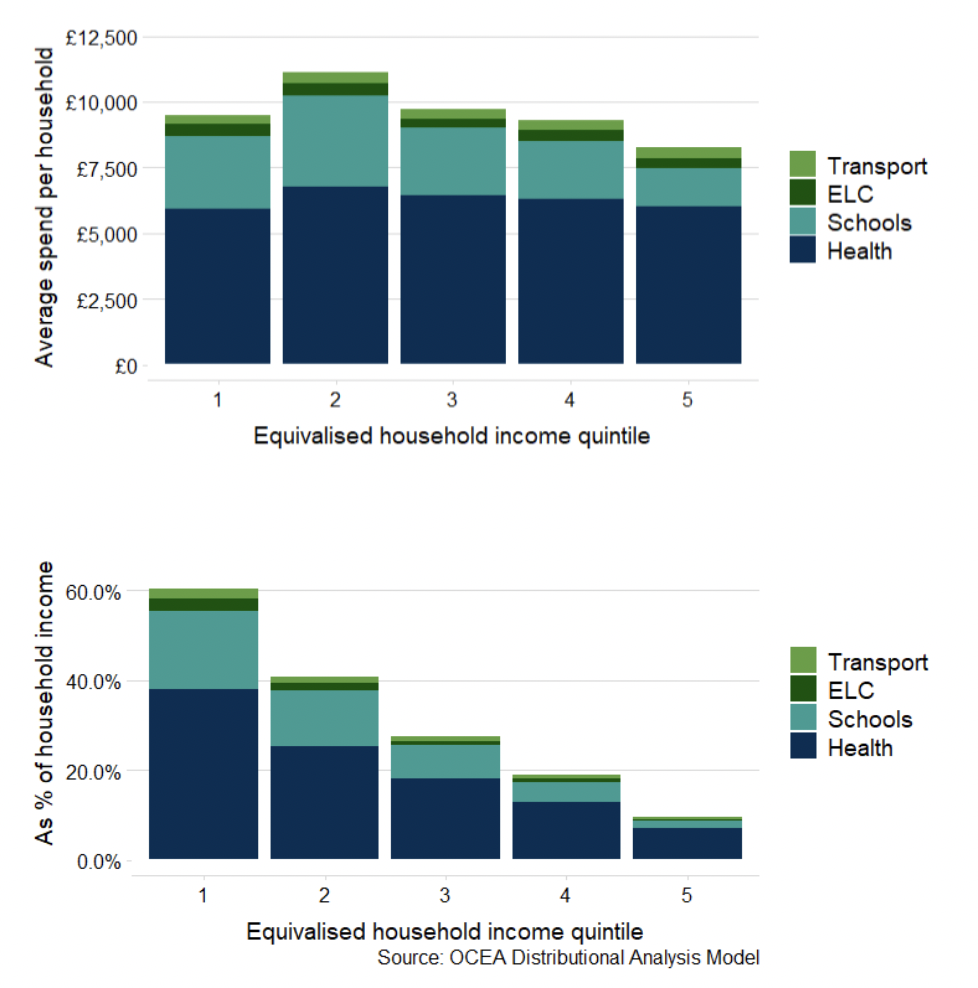
The areas covered in Table 1 account for around £24 billion – almost half of all resource spending in 2025-26.[16] Figure 11 shows the distribution of spending on these areas is dominated by health and schools.
| Area | Resource spend in £ | % of total resource spend |
|---|---|---|
| Health | £16 billion | 31% |
| Schools | £6 billion | 12% |
| ELC | £1 billion | 2% |
| Transport | £1 billion | 2% |
It should be noted that, similar to the previous sections, all figures show annual average spending among all households in the quintiles[18], not just among those who are estimated to be using these services – this enables amounts to be presented in a comparable way across areas. As shown in Figure 10, most income quintiles receive similar levels of the public services being considered in cash terms, with spending highest in the second income quintile. When considering spend as a share of household income, public service spend is a significantly larger proportion of household income in the lower income quintiles.
Health spending
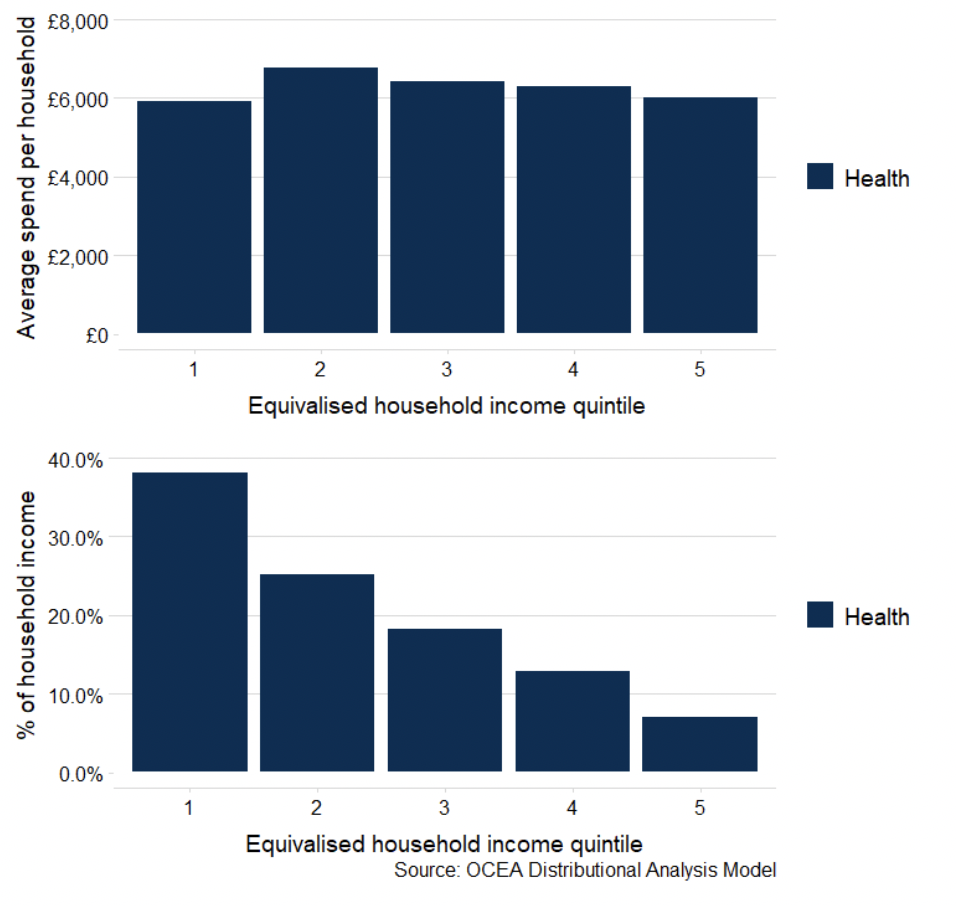
Health resource spending includes spending on NHS boards, community health and mental health services. Spending is assigned primarily based on age and sex in this analysis[19]. The shape of the distribution is largely driven by the position of households with older people in the income distribution. Overall, the level of average cash spend is relatively flat, although with less going to households in the bottom quintile. This quintile has fewer older people and more young people – including groups such as students. As a share of household income, health resource spending provides a greater impact for lower income quintiles.
Schools
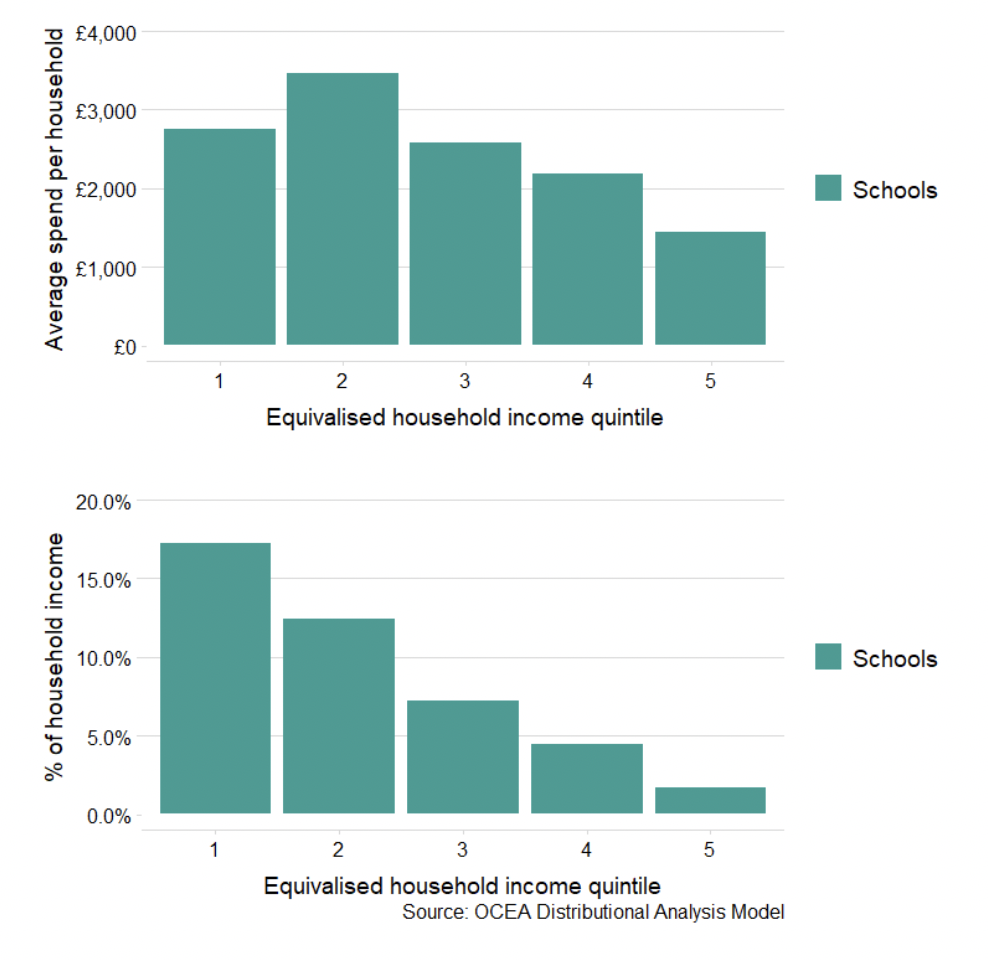
School resource spending includes spending on primary, secondary and special schools – it does not at present include spending on Free School Meals or School Clothing Grant and the analysis only considers state-schools. Spending is focussed on lower income households, both in cash terms and as a share of income, reflecting the distribution of families with children of school age across income quintiles.
Funded Early Learning and Childcare
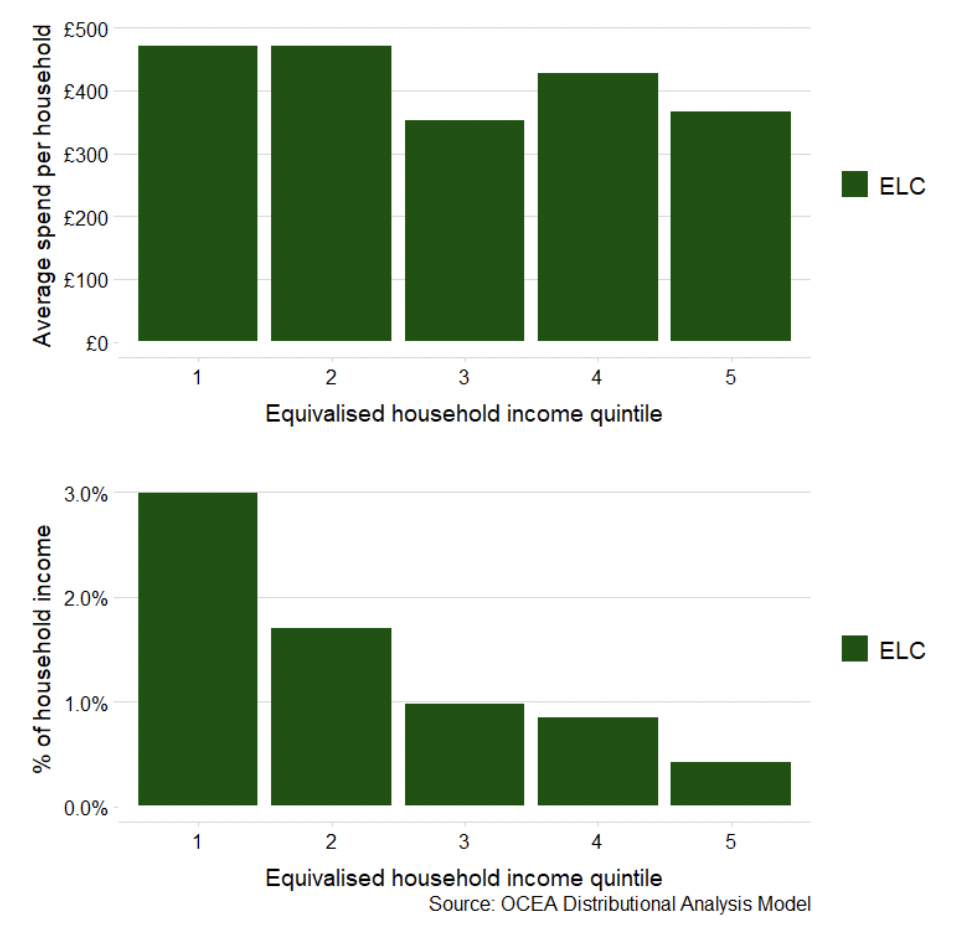
The pattern of ELC spending is driven by the position of households with 3 and 4 year olds and eligible 2 year olds in the income distribution. This results in greater average spending in the bottom half of the income distribution in cash terms and as a share of household income.
Transport
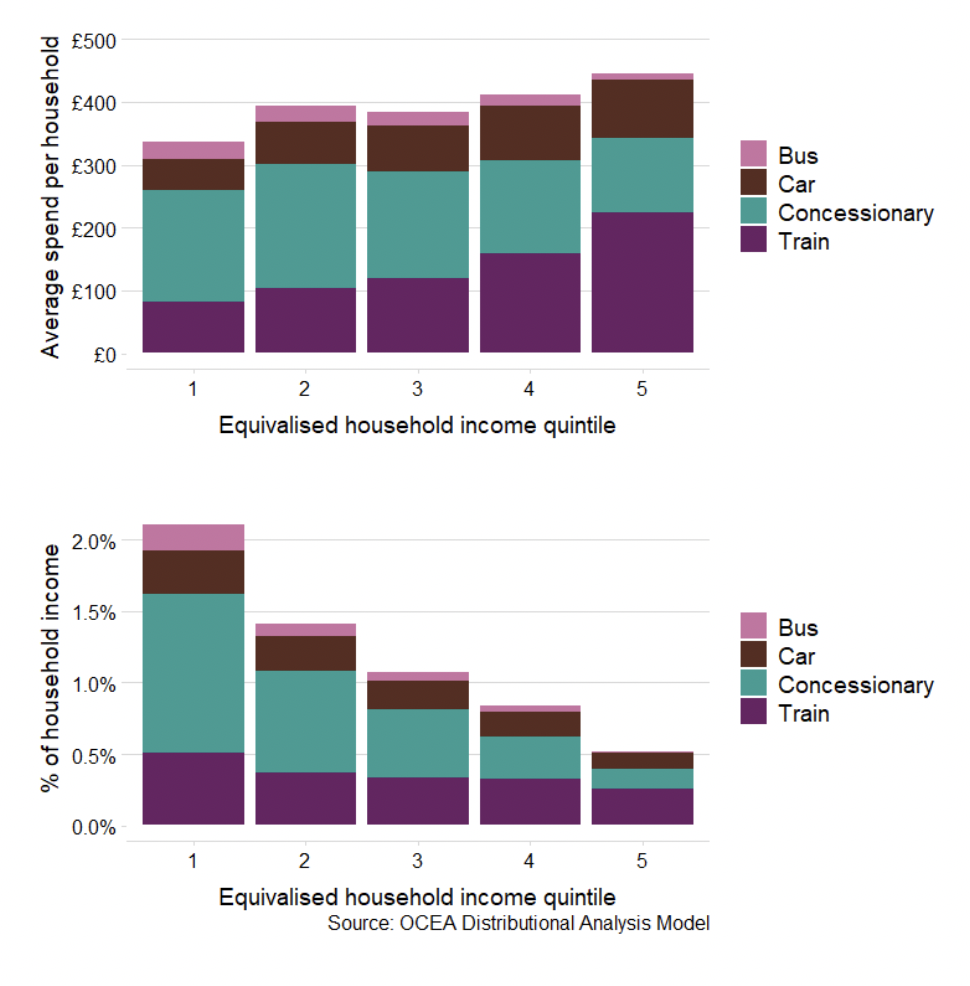
Transport includes resource spending on concessionary fares, bus, rail and road.[20] In cash terms, overall transport spending is higher for high income households than lower income households. This is driven by the larger amount spent on road and rail. In contrast, spending on bus services and concessionary travel is more focussed on lower income households.
Contact
Email: jim.bowie@gov.scot
There is a problem
Thanks for your feedback