Scottish Child Payment and the labour market
This publication presents Scottish Government analysis of how Scottish Child Payment interacts with the labour market in Scotland including how it impacts labour market decisions of its clients.
Labour Market Indicators
UC Conditionality Data
66. A way to explore how SCP could be impacting incentives to work is to study UC conditionality/labour market regime data, alongside employment status.
67. There are six UC conditionality regimes that place work related requirements upon clients to obtain their full UC entitlement. These regimes are part of a client’s claimant commitment and should limit the extent SCP clients can reduce hours worked as there would be a corresponding DWP response, including potentially sanctions or implications for UC award amounts[27]. See figure 8.
68. The Planning for Work conditionality regime covers: Expected to work in the future. Lone parent / lead carer of child aged 1(a). Claimant required to attend periodic interviews to plan for their return to work.
Figure 8 – Conditionality regimes and description
Conditionality Regime / Description
Searching for work
Not working, or with very low earnings. Claimant is required to take action to secure work - or more / better paid work. The Work Coach supports them to plan their work search and preparation activity.
Working - with requirements
In work but could earn more, or not working but has a partner with low earnings
No work requirements
Not expected to work at present. Health or caring responsibility prevents claimant from working or preparing for work.
Working - no requirements
Individual or household earnings over the level at which conditionality applies. Required to inform DWP of changes of circumstances, particularly if at risk of decreasing earnings or losing job.
Planning for work
Expected to work in the future. Lone parent / lead carer of child aged 1(a). Claimant required to attend periodic interviews to plan for their return to work.
Preparing for work
Expected to start preparing for future even with limited capability for work at the present time or a child aged 2(b), the claimant is expected to take reasonable steps to prepare for work including Work Focused Interview.
Source: DWP StatXplore
69. All the clients within the planning for work regime should be eligible[28] for SCP. Although these UC clients should not be in employment, since the regime (count date) and employment status (assessment period) are registered at different times[29], clients can be counted as in the planning for work regime and also as employed. However, this should mean these clients are not employed when counted in that conditionality regime, but when indicated by their employment indicator, either just before or just after their count date.
70. DWP advise caution when comparing these two figures but the proportion of planning for work clients counted as employed could be considered as the likelihood of these clients being employed around the time of being in that regime. This can provide a useful comparison between Scotland and England and inform analysis of SCP’s impact on employment behaviour.
Source: DWP, Stat Xplore, People on Universal Credit
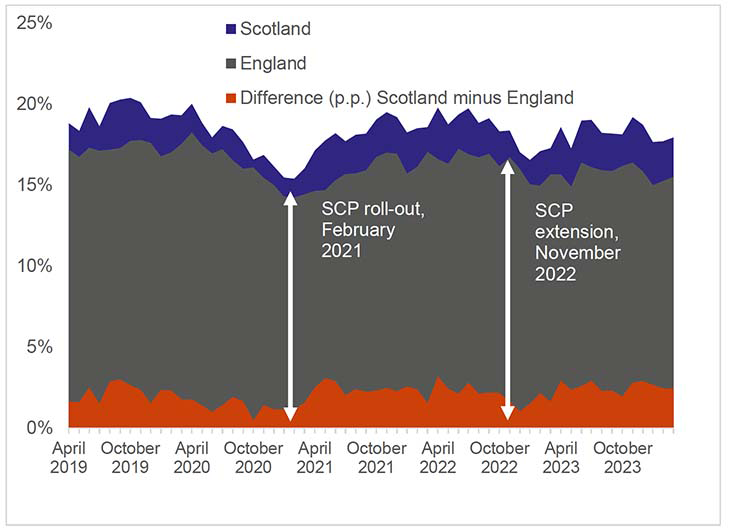
71. Figure 9 compares that likelihood of being in employment for planning for work clients in Scotland and England. This shows these clients are consistently more likely to be in employment in Scotland than in England over time.
72. If SCP acted to reduce the likelihood of planning for work clients in Scotland being in employment, the gap between employment likelihood in Scotland and England might be expected to narrow as employment indicators for planning for work clients fell in Scotland, particularly at SCP milestones.
73. Figure 9 shows employment likelihood is always higher in Scotland and the gap between Scotland and England has remained broadly similar over time at around 2 percentage points. The impact of COVID can be seen in the declines of employment likelihood in both Scotland and England between March 2020 and February 2021.
74. Although there is a decline in employment likelihood in Scotland around the time of the November 2022 eligibility extension, this is also observed for UC clients in England where SCP is not available.
75. A wide range of factors will influence any differences between this employment likelihood in Scotland and England, including the UC roll-out, the availability and affordability of childcare, demographic differences, and differences in labour market conditions (e.g. availability of flexible jobs).
76. The Scotland data reflects around 7,000 UC clients and the vast majority should be claiming SCP. If SCP was acting as a disincentive to employment, some convergence of those employment likelihoods with clients in the same regime in England could be expected. However, this effect would only be observed when an SCP client’s labour market status moves from employment to not employed, and would not for example, highlight changes in working hours. UC award amount data can be used to analyse trends in changes to working hours and earnings.
UC Award Data
77. Around three quarters of SCP clients qualify through UC. UC’s eligibility criteria and taper rate means people who earn more through paid work should have lower UC award amounts.
78. One way to test how SCP recipients’ labour market incentives are changing is to analyse how these award amounts are changing over time for SCP clients in Scotland, and compared with a natural control group, similar households in England, where SCP is not available.
79. If SCP incentivises people to not earn more than their UC earnings limit to retain eligibility for UC and SCP, we might expect to see a rise of low award amounts in Scotland at particular times (e.g. when SCP was doubled from £10 per week to £20 per week in April 2022) and compared with similar household types in England. This could reflect either clients who would a) ordinarily earn have earnings too high to qualify for UC and reduce their earned income through work in order to qualify, or b) clients whose earnings are almost too high to qualify for UC and reduce or don’t increase their earned income through work to avoid losing eligibility. This type of effect has been observed before, for example with a clustering of lone parents working exactly 16 hours a week – the minimum requirement for working tax credit eligibility. See figure 10.
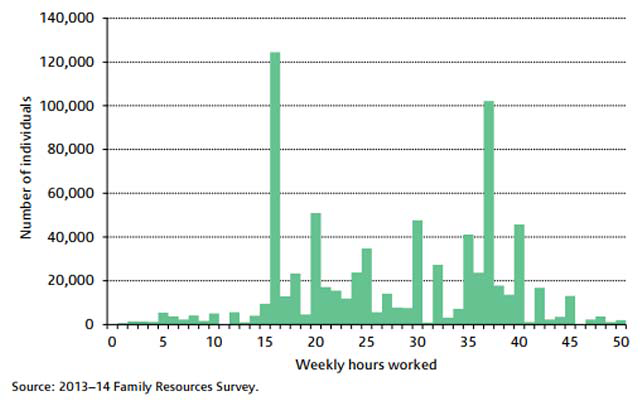
Source: Institute for Fiscal Studies, Green Paper (2016), page 238.
80. Where SCP clients purposely reduce earnings this is likely to be reflected by reduced working hours rather than wage rates. Employees will be unlikely to seek lower wage rates and minimum rates of pay are protected by legislation. However, it is likely to be difficult for some SCP clients to control their working hours. Some SCP clients will have fixed contracts where hours worked cannot be easily reduced or employers require particular shifts to be worked.
81. A labour market response to SCP could also be reflected not in reductions to earnings but avoidance of increased earnings e.g. some SCP clients in work could avoid taking promotions or changing to more highly paid jobs.
82. If these effects are present it would be expected to be most apparent at the margin of UC income thresholds where eligibility for SCP could be lost or gained. Low award amounts have been defined here as less than £100 per month. Due to the UC taper rate of 55%, at a UC award of £100 per month, UC clients should be able to earn around a further £180 net earnings per month before they would lose their UC award entirely. If a UC client paid no tax on those earnings this would reflect around 16 hours of paid work per month at the national minimum wage. However, this would be dependent on hourly wage rates and income tax and national insurance liabilities.
83. The following charts set out analysis of low UC award amounts in Scotland, for families with children eligible for SCP, compared with comparable households in England, and before and after the introduction of SCP.
Source: DWP, Stat Xplore, Universal Credit Household Data
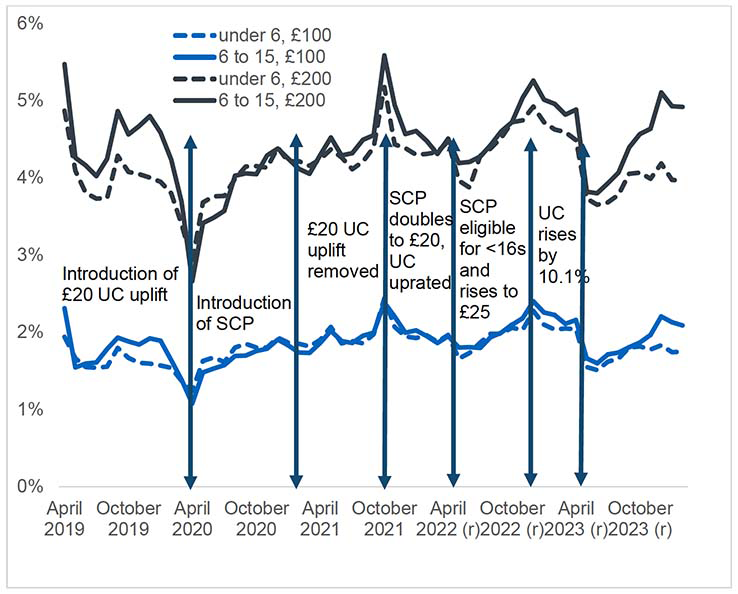
84. Figure 11 shows how the percentage of low award amounts as a percentage of all award amounts, for households with children aged under 6 and aged 6 to 15 in Scotland, have changed over time. Award amounts under £100 typically reflect around 2% of households with children aged under 16 and around 5% for award amounts of under £200 (around 4% where children are aged under 6).
85. These proportions have remained similar over time but with impacts from significant changes to UC rates. For example, the introduction of the £20 UC uplift in April 2020 leads to a reduction in proportions as awards previously under £100 and £200 become higher. Similarly, as the £20 UC uplift is removed in October 2021, there’s a spike in proportions as awards previously over £100 and £200 become lower. There’s also a large drop in proportions shortly after a larger than normal uprating to UC elements of 10.1% in April 2023.
86. The impact of these changes is very similar across households where the youngest child is aged under 6 and where the youngest child is aged 6 to 15. There are less obvious impacts from any SCP milestones. There is a rise of low award amounts in the months leading up to the eligibility extension to include children aged 6 to 15. However, these impacts appear smaller in magnitude.
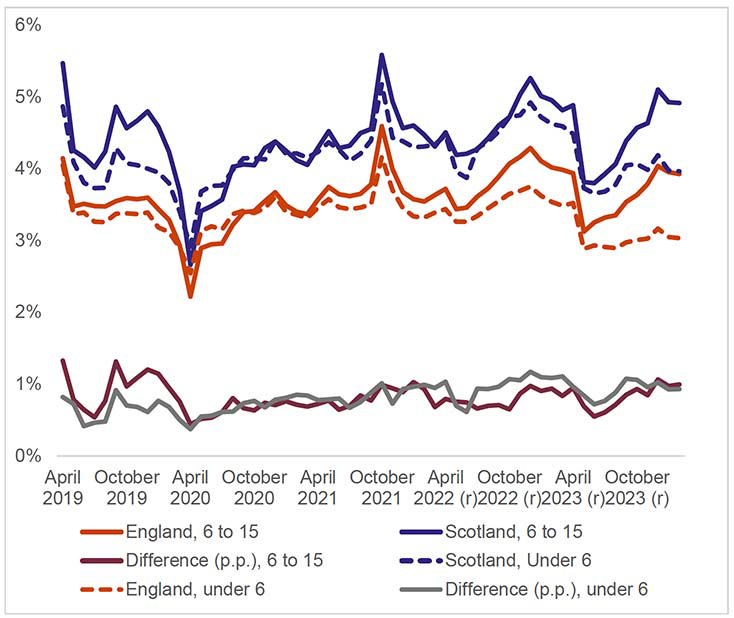
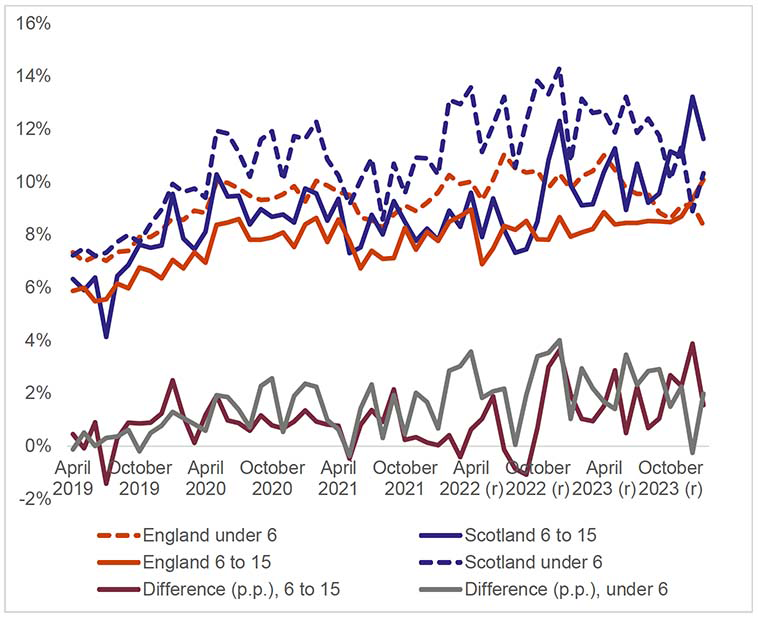
87. Figure 12 now includes households in England, and shows the difference in proportions of small award amounts between Scotland and England.
88. Scotland consistently has higher proportions of low awards than in England and these differences are gradually growing over time. However, this trend is apparent for both age groups before SCP could have had an impact (February 2021 for under 6 and November 2022 for 6 to 15). Trends over time show for both age groups, timing and magnitude of changes are very similar in England and Scotland. The rise in low awards around November 2022 is also present for England, where SCP is not available.
89. The gradual growth of low UC awards in Scotland relative to England could be linked to the UC roll-out and differences between Scotland and England in the income distribution and awards of households migrated from legacy benefits to date, and also the higher rates of housing entitlement award amounts in England, the only differential UC rate between Scotland and England.
90. All of this data suggests SCP is not leading to particular increases in low UC award amounts for households eligible for SCP in Scotland relative to England. As would be expected, trends in low award amounts seem more closely linked to changes to UC rates and are very similar for comparable households in England, where SCP has never been available.
Source: DWP, Stat Xplore, Universal Credit Household Data
91. However, we might expect to see more impact when focusing only on new claims to UC. A discernible rise in low award amounts for new claims could reflect people aiming to obtain eligibility for UC in order to also obtain receipt of SCP.
92. Since the number of households counted in new UC claims is much lower than overall claims, to increase the number of households in scope, the threshold for low award amounts is set to £300 per month and shown in figure 13.
Source: DWP, Stat Xplore, Universal Credit Household Data
93. When comparing this data with SCP milestones there does appear to be a spike of low UC award proportions in Scotland relative to England, for both under 6 and 6 to 15 households, around the time of the November 2022 eligibility extension. The extension would impact both households types as under 6 households reflects the age of the youngest child only, those households could also have a child newly eligible for SCP in November 2022.
94. However, those spikes when considered in the context of overall UC claims for households eligible for SCP, are small in scale. Excess low new UC claims compared with the longer term average appear concentrated in October, November and December and total around 100 to 150 additional low new UC claims over that period. This is compared to around 7000 new UC claims made over that time, representing less than 2% of new UC claims from households eligible for SCP.
95. In summary, if SCP had a significant impact on labour market decisions of clients and the amount earned from paid work, we could expect to see this reflected in changes to UC award amounts. Impacts would likely be concentrated at low award amounts where clients are close to earnings limits for UC/SCP. Low UC awards have been used to reflect proximity to that margin.
96. The analysis set out above of low UC award amounts suggests SCP is not impacting labour market decisions at scale in the economy. For households eligible for SCP, low award rates appear to be rising gradually in Scotland relative to comparable households in England. However, these trends are present before households in Scotland became eligible for SCP and timing and magnitude of changes are similar in England and Scotland. Additionally, where differential impacts between comparable households in Scotland and England are observed, as should be expected, these appear to be more closely linked to changes to UC rates (e.g. the £20 UC uplift) than SCP milestones.
97. The exception is analysis of new UC claims. Here, there are signs that Scotland saw a spike in new low award UC claims around the time of the eligibility extension in November 2022. This could reflect SCP incentivising clients to not earn above the UC threshold. However, this is small in scale, and at around an additional 100 to 150 new UC claims, represents around 0.2% of the almost 90,000 new SCP applications[30] made in November 2022. Rather than changes to labour market behaviour, this could also reflect increased take-up of UC of households already eligible, but who have submitted claims for the first time.
Family Resources Survey
98. The Family Resources Survey (FRS)[31] is a continuous survey of households published by the DWP every year and is a leading source of data on incomes of households across the UK. The FRS is used to produce a range of statistics outputs and by the Scottish Government to produce an annual official statistics publication of poverty rates in Scotland[32].
99. Unlike most other established national surveys, the FRS allows labour market indicators of SCP clients to be isolated, for example, median hours worked in employment. However, the underlying sample size of the FRS is too small to allow robust analysis of labour market outcomes of SCP clients specifically.
100. Scottish Government analysts will continue to explore the FRS data and future FRS releases to determine if and how it can be used to inform analysis of SCP’s interaction with the labour market.
Contact
Email: Dominic.Mellan@gov.scot
There is a problem
Thanks for your feedback