Scottish economic insights: October 2024
Provides further analysis and insights on the economic themes presented in the monthly Scottish economic bulletin.
Part of
Recent Economic Conditions
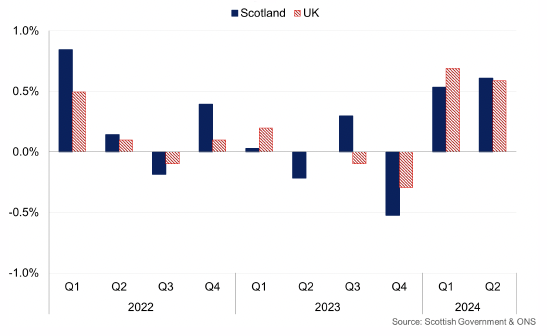
The Scottish economy grew 0.1% in 2023 with growth remaining largely flat since the start of 2022 and at risk of entering technical recession with inflationary pressures and higher interest rates weighing on activity over this period.
The pace of growth picked-up in the first half of 2024, albeit moderately, to 0.5% in the first quarter and 0.6% in the second quarter. Latest data for the 3-months to July showed the pace of growth eased back slightly to 0.3%, however overall the data continued the current pattern of stronger GDP growth compared to 2023.[1]
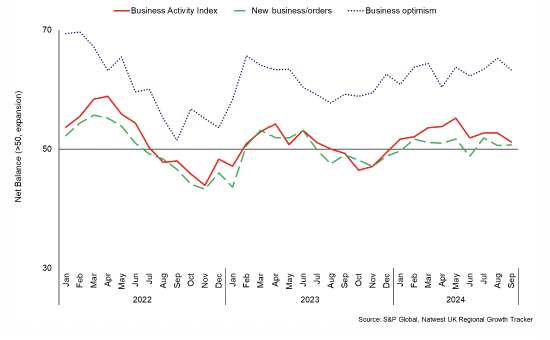
Business surveys also indicate stronger business activity this year, having weakened in the second half of 2023. The RBS Growth Tracker business activity indicator has been positive between January and September this year.[2] Similarly, both the Scottish Business Monitor and the Scottish Chambers of Commerce (SCC) Quarterly Economic Indicator reported a pick-up in business sales and turnover growth indicators in the second quarter.[3],[4]
However, the pick-up in GDP growth has not been consistent across sectors with service sector output up 1.3% annually in Q2 2024, while production output has fallen 0.1% and construction has fallen 1%.
Growth in the services sector, which accounts for nearly 80% of output in the economy, has been a key part of the resilience in overall GDP growth since the start of 2022 and growth since the start of the year has been relatively broad based across wholesale and retail, professional, scientific and technical services and financial and insurance activities. Latest data for the 3 months to July showed the sector continued to grow (0.4%), albeit at its slowest 3-monthly rate since the start of the year.
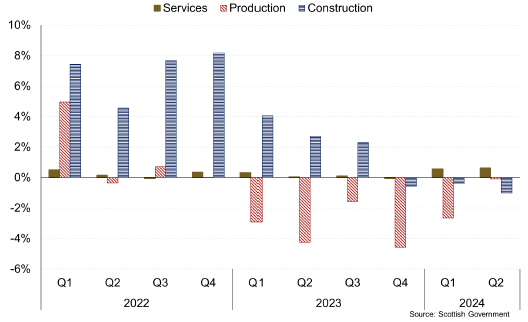
The fall in construction output during 2024 has continued its downward trend from the second half of 2023, albeit that the sector posted positive growth in the 3-months to July (1.2%) for the first time since September 2023. While production sector output has fallen over the past year, growth has strengthened in the first half of 2024, supported by a rebound in electricity and gas output. Manufacturing output has also strengthened, however remains 1.2% down over the year to Q2 2023. Furthermore, strengthening growth has been moderate with latest data for the 3-months to July showing production output fell 0.6% and 1.6% in the manufacturing sector.
The following box sets out further insights on the different patterns of growth across sectors since the start of 2022.
Insight on the resetting of the economy: GDP performance by sector since 2022
The significant impacts of the pandemic followed by the inflation shock has meant that aspects of the economy have undergone a reset over this period. Scotland’s GDP growth strengthened in the first half of 2024, following a relatively flat period of growth between Q1 2022 and Q4 2023 in which GDP fell 0.1%.
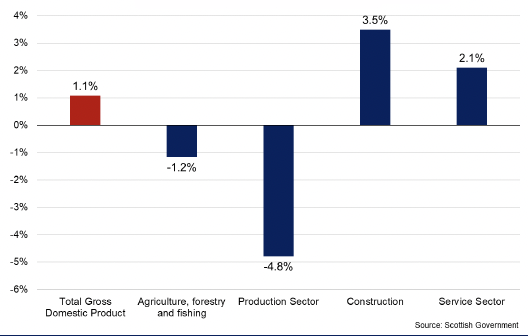
Latest data for Q2 2024 show the economy grew 1.1% in the first half of 2024 and 1.1% compared to Q1 2022. Over this nine-quarter period, growth has been driven by the services sector (2.1%) and construction sector (3.5%) which offset a 4.8% fall in output from the production sector.
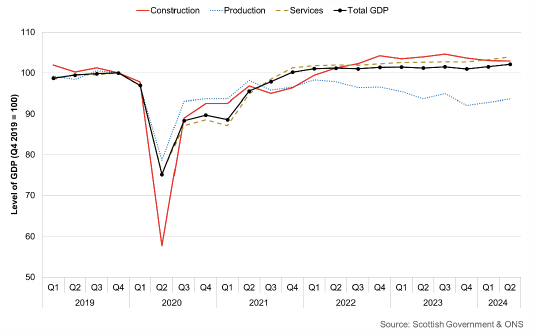
This box explores in more detail the fall in production output over this period, despite starting from a lower base post-pandemic, while the other key sectors have grown, albeit relatively weakly. The pattern of growth is broadly consistent with UK GDP over this period in which GDP grew 1.2% with 1.9% growth in the service sector and 3.5% in the construction sector offsetting a fall of 1.7% in the production sector. Production output is now 6.4% (UK: -8.4%) below its level in Q4 2019 prior to the pandemic.
Within the production sector, there have been relatively broad-based falls in output across production industries including Mining and Quarrying (-5.7%), Manufacturing (-6.6%) and Electricity and Gas Supply (-7.4%), the latter of which has seen a temporary fall in generation over the past year. Offsetting this, there has been output growth from Waste Supply and Management (+11.5%).
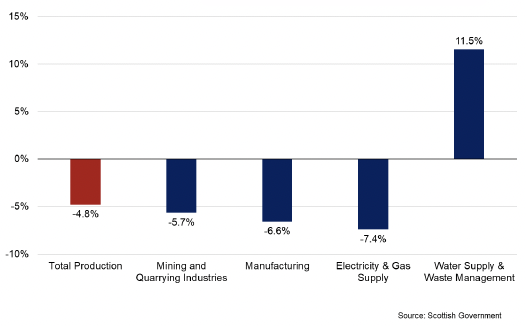
The manufacturing sector makes up around 10% of the Scottish economy and so the 6.6% fall in manufacturing output has been the most significant contributing factor the fall in output across the production sector.
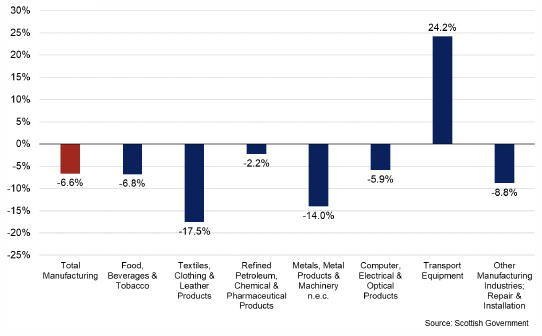
Within the manufacturing industry, the fall in output over the period Q1 2022 to Q2 2024 has been broad based across manufacturing subsectors with only growth in the manufacturing of transport equipment (24.2%). Manufacture of textiles, clothing and leather products have seen the biggest fall in output (-17.5%) while output of food, beverages and tobacco (the largest manufacturing sub sector of the economy) fell 6.8% over the period.
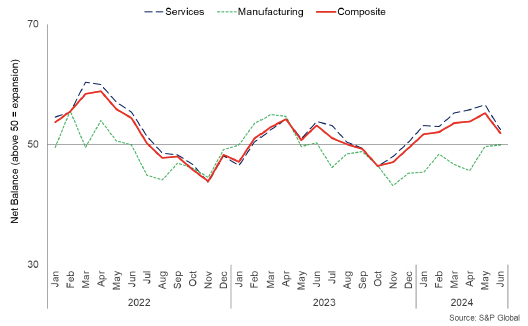
The divergence in growth between the services and manufacturing sector over the period has been reflected in the PMI business survey data up to June with manufacturing businesses generally reported on balance weaker business activity, new business orders and business optimism for the year ahead.[5]
The pattern of growth since 2022 in part reflects how different sectors were impacted during the pandemic and the different adjustments and pace of recovery across sectors and industries. Furthermore, the wide range of inflationary pressures facing the manufacturing and construction sectors over this period from higher energy prices, raw materials and staffing costs, combined with a period of relatively weak demand (domestic and international) and higher interest rates have been key factors impacting output over this period.
The strengthening in manufacturing sector growth in the first half of 2024 (1.5%) reflects that some of the headwinds that have been facing the sector over the past two years are more stabilised. However risks to the sector for the coming year remain, in part from ongoing disruption and higher costs in global supply chains.
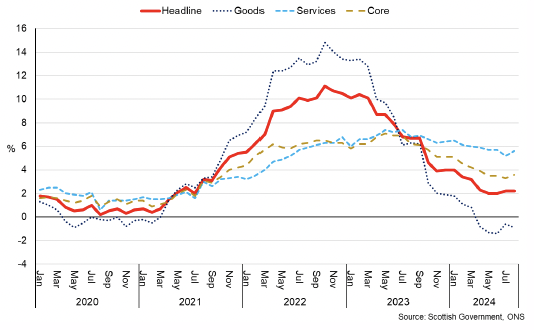
A number of underlying trends have supported stronger GDP growth in the first half of the year. The inflation shock over 2022 and 2023, alongside the rise in interest rates, weighed on business and consumer activity during that period. However the inflation rate has fallen back from its 11.1% peak in October 2022 to around its 2% target rate in recent months (2.2% in July and August).[6]
It is on this basis that the Bank of England cut the Bank Rate from 5.25% to 5% in August and has signalled a gradual pace of further interest rate reductions going forward. While the inflation rate is forecast to rise slightly towards the end of the year as base effects continue to pass through, inflation is currently expected to remain significantly more stable than in recent years with the Bank of England forecasting it to average around 2.5% over 2025.[7]
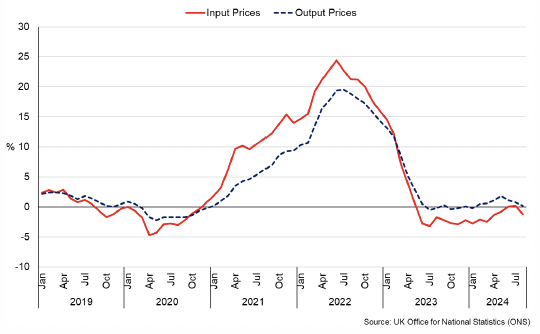
The fall in inflation rate has been largely driven by the fall back in energy prices which has impacted consumers directly through a fall in home electricity and gas prices and indirectly through lower producer input price inflation feeding through to output and consumer prices, particularly for goods.
Producer input prices fell 1.2% over the year to August and have been on a downward trend since June 2023, most recently reflected in lower fuel prices (-13.5%) and imported food prices (-3.2%), which in turn have been supported by the higher level of sterling over the year.[8] Similarly the pace of output price inflation has also remained lower and more stable over the past year.
This is partially reflected in the fall in consumer price inflation which was 2.2% in August with goods price inflation falling to -0.9% while services price inflation has remained more elevated at 5.6%. The stickiness in services price inflation is relatively broad based across parts of hospitality, recreational services and transport.
The combination of improved economic conditions and household finances as the inflation rate has fallen has underpinned an improvement in consumer sentiment in Scotland which has strengthened compared to 2023 and turned positive in May for the first time since February 2022.[9]
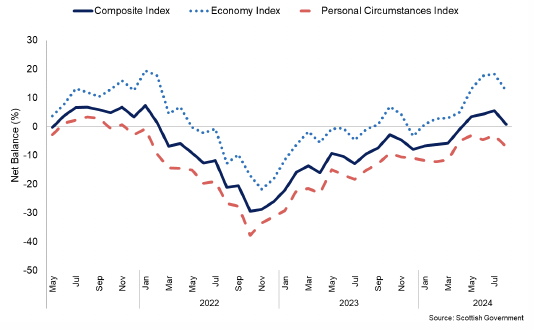
The improvement in consumer sentiment has been driven by improving sentiment relating to the economy, people’s personal circumstances regarding their household finances and confidence about spending which have been significantly impacted over the past two years during the inflationary shock. However, sentiment regarding people’s personal circumstances continues to be lower than regarding the economy, reflecting the challenges that consumers continue to face to their household finances.
Expectations for the year ahead are positive and have improved since the start of the year, however the improvement in current circumstances compared to the previous year has had a more significant impact on the overall improvement in sentiment. This is consistent with the improvement in real earnings growth and continued low unemployment over the past year.
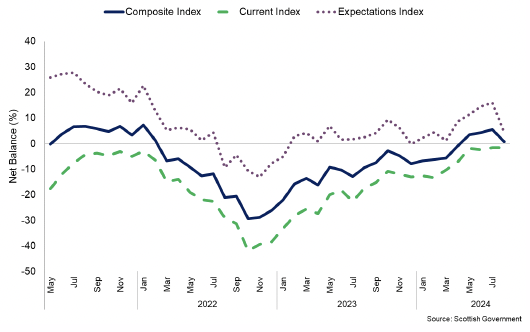
Furthermore, the fall in consumer sentiment in August by 4.7 points to 0.9, was largely driven by a fall in expectations for the economy and household finances for the year ahead. This highlights the ongoing concerns and uncertainty that households have for the future and the risk that this presents for current consumption behaviour.
The following box sets out further insights on how consumer sentiment has differed across different types of consumers.
Insight on Differences in Consumer Sentiment by Demographic Group
The Scottish Consumer Sentiment Indicator (SCSI) is a leading indicator of economic activity in Scotland providing timely insight on households sentiment and expectations regarding the Scottish economy, their household financial security and their confidence to spend. The SCSI is based on surveys of 1,000 people each month.
Changes in consumer sentiment can provide timely indications of how economic and financial developments could potentially impact household consumption and so is a key indicator for understanding consumer confidence and as a leading indicator for changes in GDP.
Since it was established in 2013, the SCSI has provided clear insights on how consumer sentiment in Scotland has responded to a succession of economic shocks including exiting the EU, the Covid pandemic and the cost of living crisis.
New analysis has been undertaken to disaggregate the SCSI by different characteristics of respondents to provide new insights into how consumer sentiment has changed over time for different groups in society.
Based on latest quarterly data, the SCSI net balance was 2.4 in Q2 2024. During this quarter, younger respondents on balance reported higher net balances of sentiment than older respondents, similarly for male respondents compared to female and for respondents in the lower middle socioeconomic group (C2) compared to the rest of the socioeconomic spectrum (grades AB, C1 and DE).[10]
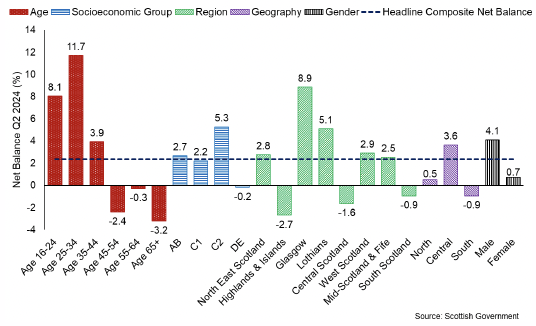
The clearest illustration of this is among age groups, with respondents aged 65+ reporting a negative net balance of -3.2, notably lower than the overall indicator average (2.4) and younger respondents who reported a positive net balance of 8.1 (aged 16-24) and 11.7 (aged 25-34).
Longer term trends in responses by gender and socioeconomic group are explored further below.
Consumer Sentiment and Gender
Since the start of the time series in 2013, the net balances of consumer sentiment for male and female respondents have followed the same pattern, though with the net balance for females tending to be slightly lower than for males.
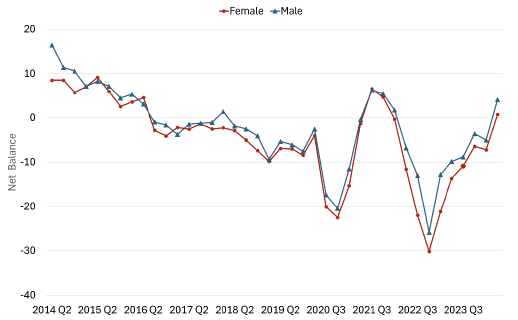
Since 2022, the gap between male and female sentiment has increased and has been more persistent than previously. Most recently during the inflation and cost of living shock in 2022, consumer sentiment fell more sharply and to a lower trough for females (-30.1) than males (-25.9) before rebounding. Latest data (Q2 2024) showed overall sentiment of female respondents was 0.7 compared to 4.1 for male respondents (a difference of 3.4).
Consumer Sentiment and Socioeconomic Group
Consumer sentiment has tended to be relatively similar across different socioeconomic groups since 2013 with net balances following a similar pattern apart from periods of volatility between 2016 and 2018, in which socio economic group AB fell temporarily below other groups.
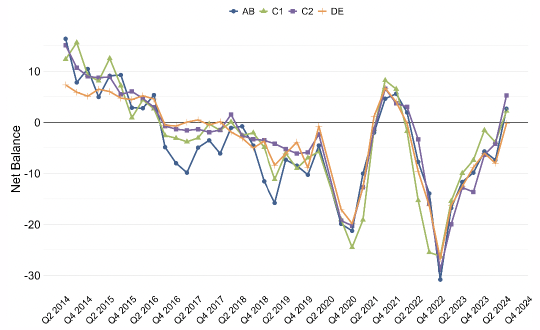
Most recently during the inflation shock there was a synchronised fall in sentiment across socioeconomic groups in 2022 with sentiment falling to the lowest levels for groups AB and C2, before rebounding over 2023. At the start of 2024, sentiment for groups AB (2.7), C1 (2.2) and DE (-0.2) is lower than for C2 (5.3).
Conclusion
The analysis presented here indicates that consumer sentiment has varied across demographic groups, reflecting that different groups have perceived and responded to changing economic and financial circumstances in different ways. Given that the SCSI survey sample is weighted at a national level and was not designed to sample different sub-groups equally, the data and any inferences derived from it must be treated with caution,
The current risks to the economic outlook, the implications for businesses, consumers, the labour market and more widely are captured in the table below, which sets out a range of economic indicators through which emerging risks are being monitored. The table also presents the risk profiles at the start of 2023 to illustrate how risks have changed over this period.
Red risks are expected to remain weak with significant downside risks, amber risks are expected to remain fragile with downside risks, and green risks are expected to remain broadly stable/fine relative to historical trends.
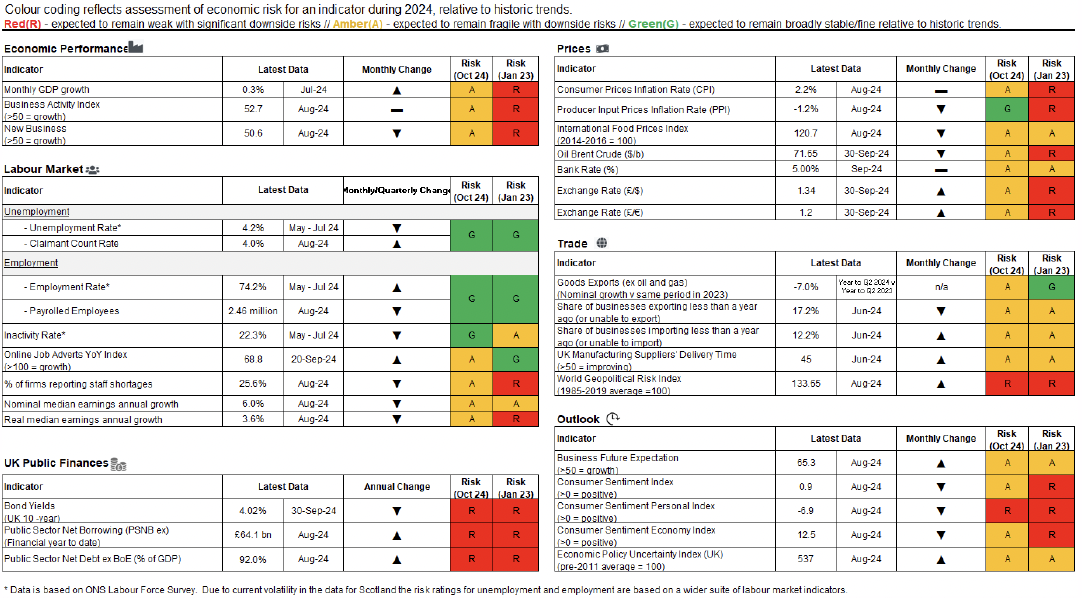
While economic conditions have improved in 2024, key areas of risks remain. Since 2022 key areas of risk in Scotland’s economic performance have centred around the weakness in economic growth and business activity, inflationary pressures and the fragility of consumer and business sentiment. In contrast the labour market has performed strongly at a headline level with low unemployment and steady recovery in real earnings.
These areas of economic risks have generally reduced over the past year as the risks of weak economic growth leading into recession have reduced, supported by improved indicators of business activity. Alongside this, the rate of inflation has fallen back to around its 2% target rate, further supporting a period of real wage growth, which alongside ongoing strength in labour market conditions is supporting an improvement in consumer sentiment and activity.
Furthermore, expectations of growth, albeit modest, and more stable prices than in recent years, is likely driving improved sentiment across consumers and businesses, providing a more stable basis for a stronger outlook for investment.
Some risks have persisted over this period such as in public finances, while international developments in Russia and Ukraine and more recently the Middle East have led to international supply chain challenges and volatility in commodity prices. The World Geopolitical Risk Index illustrates the spike in risk at the start of the war in Russia and Ukraine and similarly from the end of 2023 with the escalation of conflict in the Middle East.[11]
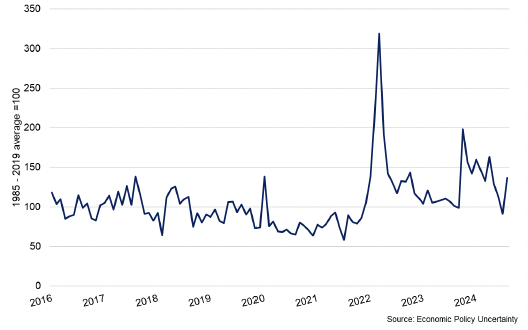
The inflationary impacts on commodity prices from the war in Ukraine are continuing to unwind, though a range of world energy, food and metals price indices remain notably higher than prior to the war.[12] A key channel through which the global economy has been impacted by the conflict in Israel and Gaza is through global supply chain disruption with a significant shift in trade volumes from the Red Sea to around the Cape of Good Hope. This has led to increased delivery times while the Shanghai Containerised Freight Index (sea freight rates) is around 160% higher than it was prior to the escalation of attacks on shipping in the Red Sea.
This is impacting global supply chains, particularly for businesses dependent on shipping supply chains from Asia, however there is little evidence to date that it has impacted the Scottish economy at an aggregate level. Business Insights and Conditions Survey (BICS) data for August show that 79% of businesses did not experience any global supply chain disruption in July.[13]
However the risk of increased escalation alongside the duration of supply disruptions remains a key risk to the global economic outlook and presents a risk to the trade outlook. Latest inflation adjusted HMRC Regional Trade statistics for Scotland show that when comparing the year ending June 2024 with the previous year, the value of Scotland’s international goods exports (exports of goods only, excluding oil and gas) fell by 8% in real terms to £22.5 billion, driven largely by a 14% decline in exports of drink.[14]
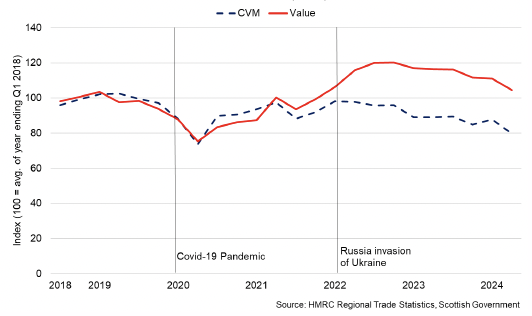
Over the longer term, Scotland has seen a 15% decrease in international goods exports in real terms (UK: -19%) in the year ending June 2024 compared to the equivalent period in 2019.
Contact
Email: economic.statistics@gov.scot
There is a problem
Thanks for your feedback